
Brief Introduction:The Tibetan Plateau, known as the " third pole " of the earth, has always been the focus of attention of the international community because it is an important area driving global environmental change research and has a profound regulatory effect on the ecology, environment and climate of the whole earth. Under the background of global warming, the cryosphere elements such as tripolar glaciers, frozen soils, and freeze-thaw lakes have undergone significant changes, with glaciers shrinking rapidly and permafrost active layers thickening. For a long time, China has carried out systematic and multidisciplinary research in the world ' s third pole with the Qinghai-Tibet Plateau as the main body, forming a rich research accumulation.
Publish Datetime:2022-12-13
Number of Datasets:184
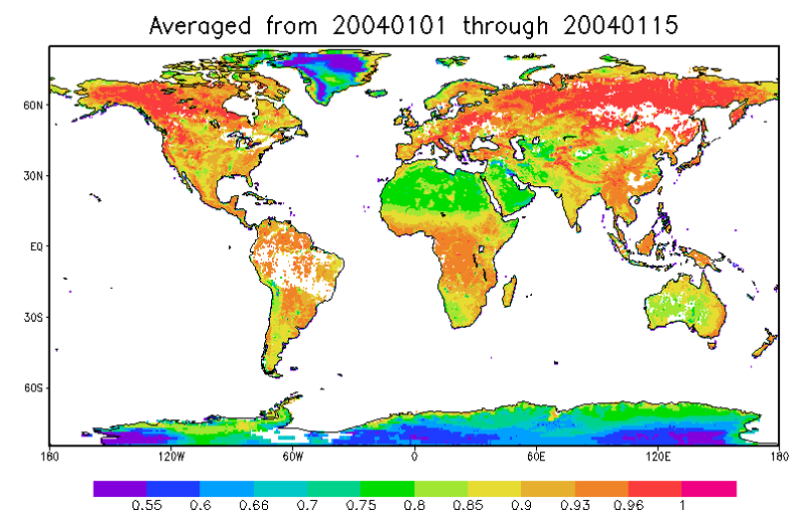
The aerosol optical thickness data of the Arctic Alaska station is based on the observation data products of the atmospheric radiation observation plan of the U.S. Department of energy at the Arctic Alaska station. The data coverage time is updated from 2017 to 2019, with the time resolution of hour by hour. The coverage site is the northern Alaska station, with the longitude and latitude coordinates of (71 ° 19 ′ 22.8 ″ n, 156 ° 36 ′ 32.4 ″ w). The source of the observed data is retrieved from the radiation data observed by mfrsr instrument. The characteristic variable is aerosol optical thickness, and the error range of the observed inversion is about 15%. The data format is NC format. The aerosol optical thickness data of Qomolangma station and Namuco station in the Qinghai Tibet Plateau is based on the observation data products of Qomolangma station and Namuco station from the atmospheric radiation view of the Institute of Qinghai Tibet Plateau of the Chinese Academy of Sciences. The data coverage time is from 2017 to 2019, the time resolution is hour by hour, the coverage sites are Qomolangma station and Namuco station, the longitude and latitude coordinates are (Qomolangma station: 28.365n, 86.948e, Namuco station Mucuo station: 30.7725n, 90.9626e). The source of the observed data is retrieved from the radiation data observed by mfrsr instrument. The characteristic variable is aerosol optical thickness, and the error range of the observed inversion is about 15%. The data format is TXT.
2020-06-03 View Details
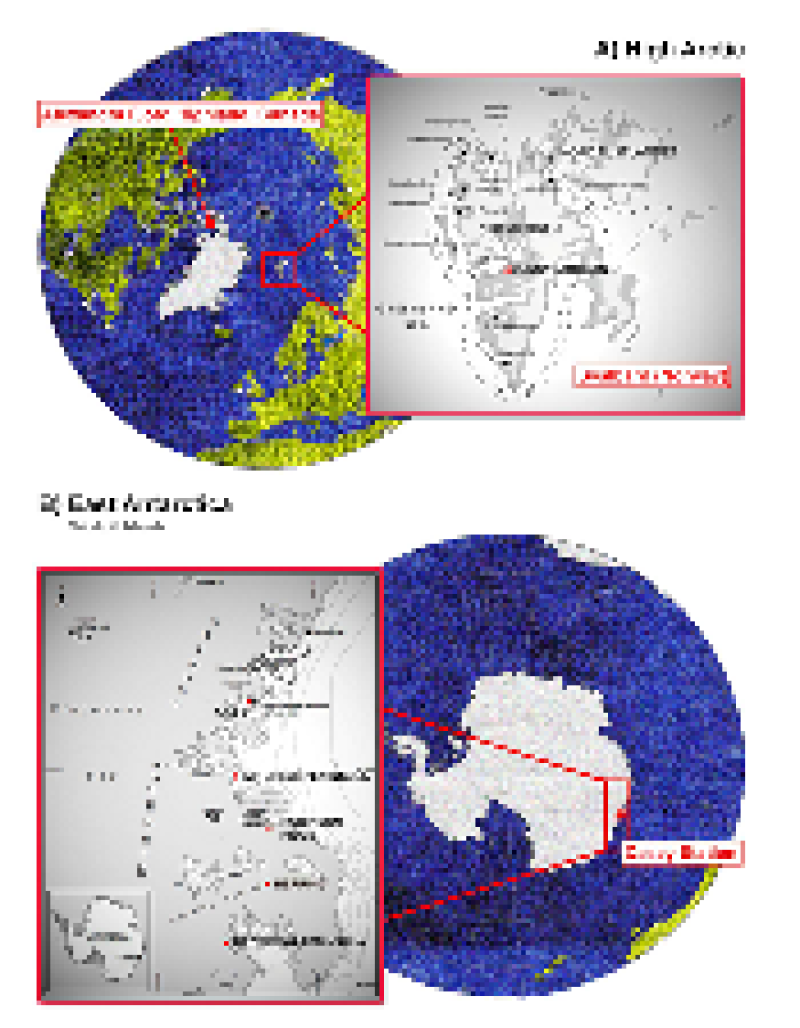
The data set of prokaryotic microorganism distribution in the snow and ice of the Arctic Antarctic and the Tibetan Plateau provides the bacterial 16S ribosomal RNA gene sequence collected by the experimental group led by Yongqin Liu from the NCBI database during 2010 to 2018. The keywords for NCBI database search are Antarctic, Arctic Tibetan, and Glacier. The collected sequences were calculated using the DOTOUR software to obtain the similarities between sequences, the sequences with similarities above 97% were clustered into one OTU, and the OTU representative sequence was defined. The OTU representative sequence was compared with the RDP database by the "Classifier" software and was identified as level one when the reliability exceeded 80%. After acquiring the sequence, the GPS coordinates of the sample were obtained by reading the sample information in the sequence file. These data contain the sequence of 16S ribosomal RNA gene fragments for each sequence, evolutionary classification, and sample GPS coordinates. Compared with sequences based on high-throughput sequencing, these data have a longer sequence and more accurate classification. It is significant for comparing the evolutionary information of three-pole microorganisms and understanding the evolution of psychrophilic microorganisms.
2020-06-03 View Details

This dataset is the spatial distribution map of the marshes in the source area of the Yellow River near the Zaling Lake-Eling Lake, covering an area of about 21,000 square kilometers. The data set is classified by the Landsat 8 image through an expert decision tree and corrected by manual visual interpretation. The spatial resolution of the image is 30m, using the WGS 1984 UTM projected coordinate system, and the data format is grid format. The image is divided into five types of land, the land type 1 is “water body”, the land type 2 is “high-cover vegetation”, the land type 3 is “naked land”, and the land type 4 is “low-cover vegetation”, and the land type 5 is For "marsh", low-coverage vegetation and high-coverage vegetation are distinguished by vegetation coverage. The threshold is 0.1 to 0.4 for low-cover vegetation and 0.4 to 1 for high-cover vegetation.
2020-06-03 View Details
The data set contains the slope aspect (resolution: 30 m) factor affecting soil erosion on the Loess Plateau and the slope aspect data extracted from the elevation data of the Loess Plateau. Each theme map is divided into frames according to the 1:250000 scale standard map cartography method, and the frames are denoted by the 1:250000 scale standard map cartography number. The geographical coordinate is WGS1984; the accuracy can meet the requirements of regional scale hydrology and soil erosion analysis and forecasting.
2020-06-03 View Details
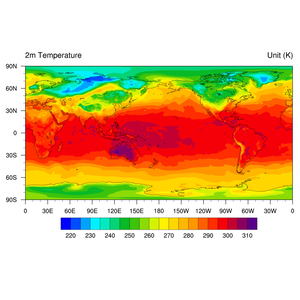
The data set of ERA-Interim global surface air temperature reanalysis (1979-2016) was obtained from the European Center for Medium-Range Weather Forecasts (ECMWF) by adopting the ECMWF IFS forecasting system (T255, 60 layers) and using the four-dimensional variational assimilation system (8DVAR) with an analysis window of 12 hours to assimilate satellite remote sensing data (TOVS, GOES, Meteosat, etc.) and regular observations of the surface and upper atmosphere in different regions of the world and from different sources. The surface air temperature (2 m air temperature) data span the time range from January 1979 to December 2016 and cover the whole world with the projection of equal latitude and longitude, a temporal resolution of six hours, and a horizontal resolution of 0.75. The data were stored as a NetCDF format file once a month and included longitude, latitude, time, and temperature (t2m, unit: K), with 241 latitudinal grid points and 480 longitudinal grid points.
2020-06-03 View Details
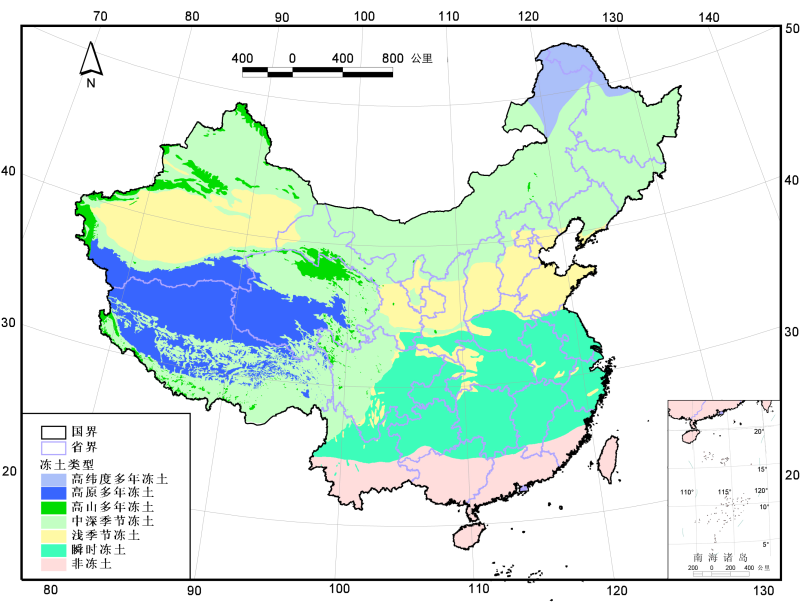
Overviewing the various frozen soil maps in China, there are great differences in the classification systems, data sources, and mapping methods. These maps represent the stage of understanding of the permafrost distribution of China in the past half century. To reflect the distribution and area of frozen soil in our country more reasonably, we have made a new frozen soil distribution map based on the analysis of the existing frozen soil maps. The map combines several existing maps of permafrost and the simulation results of a permafrost distribution model on the Tibetan Plateau. It unifies the acquisition time of data from various parts of the country and reflects the distribution of permafrost in our country around 2000. In the new frozen soil map, the distributions of various types of frozen soil are determined according to the following principles. 1. The base map uses the Geocryological Regionalization and Classification Map of the Frozen Soil in China (1:10 000 000) (Guoqing Qiu et al., 2000). The distribution of permafrost and instantaneous frozen soil in the high mountains outside the Tibetan Plateau follows the original map; the boundaries of seasonal frozen soil and instantaneous frozen soil, instantaneous frozen soil and nonfrozen soil remain unchanged, too. The distribution of permafrost on the Tibetan Plateau and in the high latitudes of the Northeast is updated with the following results. 2. The distribution of high-altitude permafrost and alpine permafrost in the Tibetan Plateau region is updated using the simulation results of Zhuotong Nan et al. (2002). This model uses the measured average annual ground temperature data of 76 boreholes along the Qinghai-Tibet Highway to perform regression statistical analysis and obtains the relationship between annual mean geothermal data with latitude and elevation. Based on this relationship, combined with the GTOPO30 elevation data (global 1-km digital elevation model data developed under the leadership of the US Geological Survey's Earth Resources Observation and Technology Center), the average annual ground temperature distribution over the entire Tibetan Plateau is simulated, the average annual ground temperature is 0.5 C, and it is used as the boundary between permafrost and seasonal frozen soil. 3. The distribution of permafrost at high latitudes in the Northeast is based on the latest results from Jin et al. (2007). Jin et al. (2007) analyze the average annual precipitation and soil moisture in Northeast China over the past few decades and conclude that the relationship between the southern boundary of permafrost in Northeast China and the annual average temperature has not changed substantially in the past few decades. 4. Alpine permafrost distribution in other regions is updated with the Map of the Glaciers, Frozen Ground and Deserts in China (1:4 million) (Cold and Arid Regions Environmental and Engineering Research Institute, Chinese Academy of Sciences, 2006). In terms of classification systems, the current existing frozen soil maps use continuous standards for the division of permafrost, but the specific definition of continuity is very different. Many studies have shown that the continuity criterion is a concept closely related to scale, it is not suitable for the classification of permafrost at high altitude (Guodong Cheng, 1984; Cheng et al., 1992), and it cannot be applied to the permafrost distribution model that uses grid as the basic simulation unit. In this paper, we abandon the continuity criteria and take the existence of frozen soil in the mapping unit (grid or region). The new frozen soil map divides China's frozen soil into several categories: (1) High latitude permafrost; (2) High altitude permafrost; (3) Plateau permafrost; (4) Alpine permafrost; (5) Medium-season seasonal frozen soil: the maximum seasonal freezing depth that can be reached is >1 m; (6) Shallow seasonal frozen soil: the maximum seasonal freezing depth that can be achieved is <1 m; (7) Instant frozen soil: less than one month of storage time; and (8) Nonfrozen soil. For a specific description of the data, please refer to the explanatory documents and citations.
2020-06-03 View Details
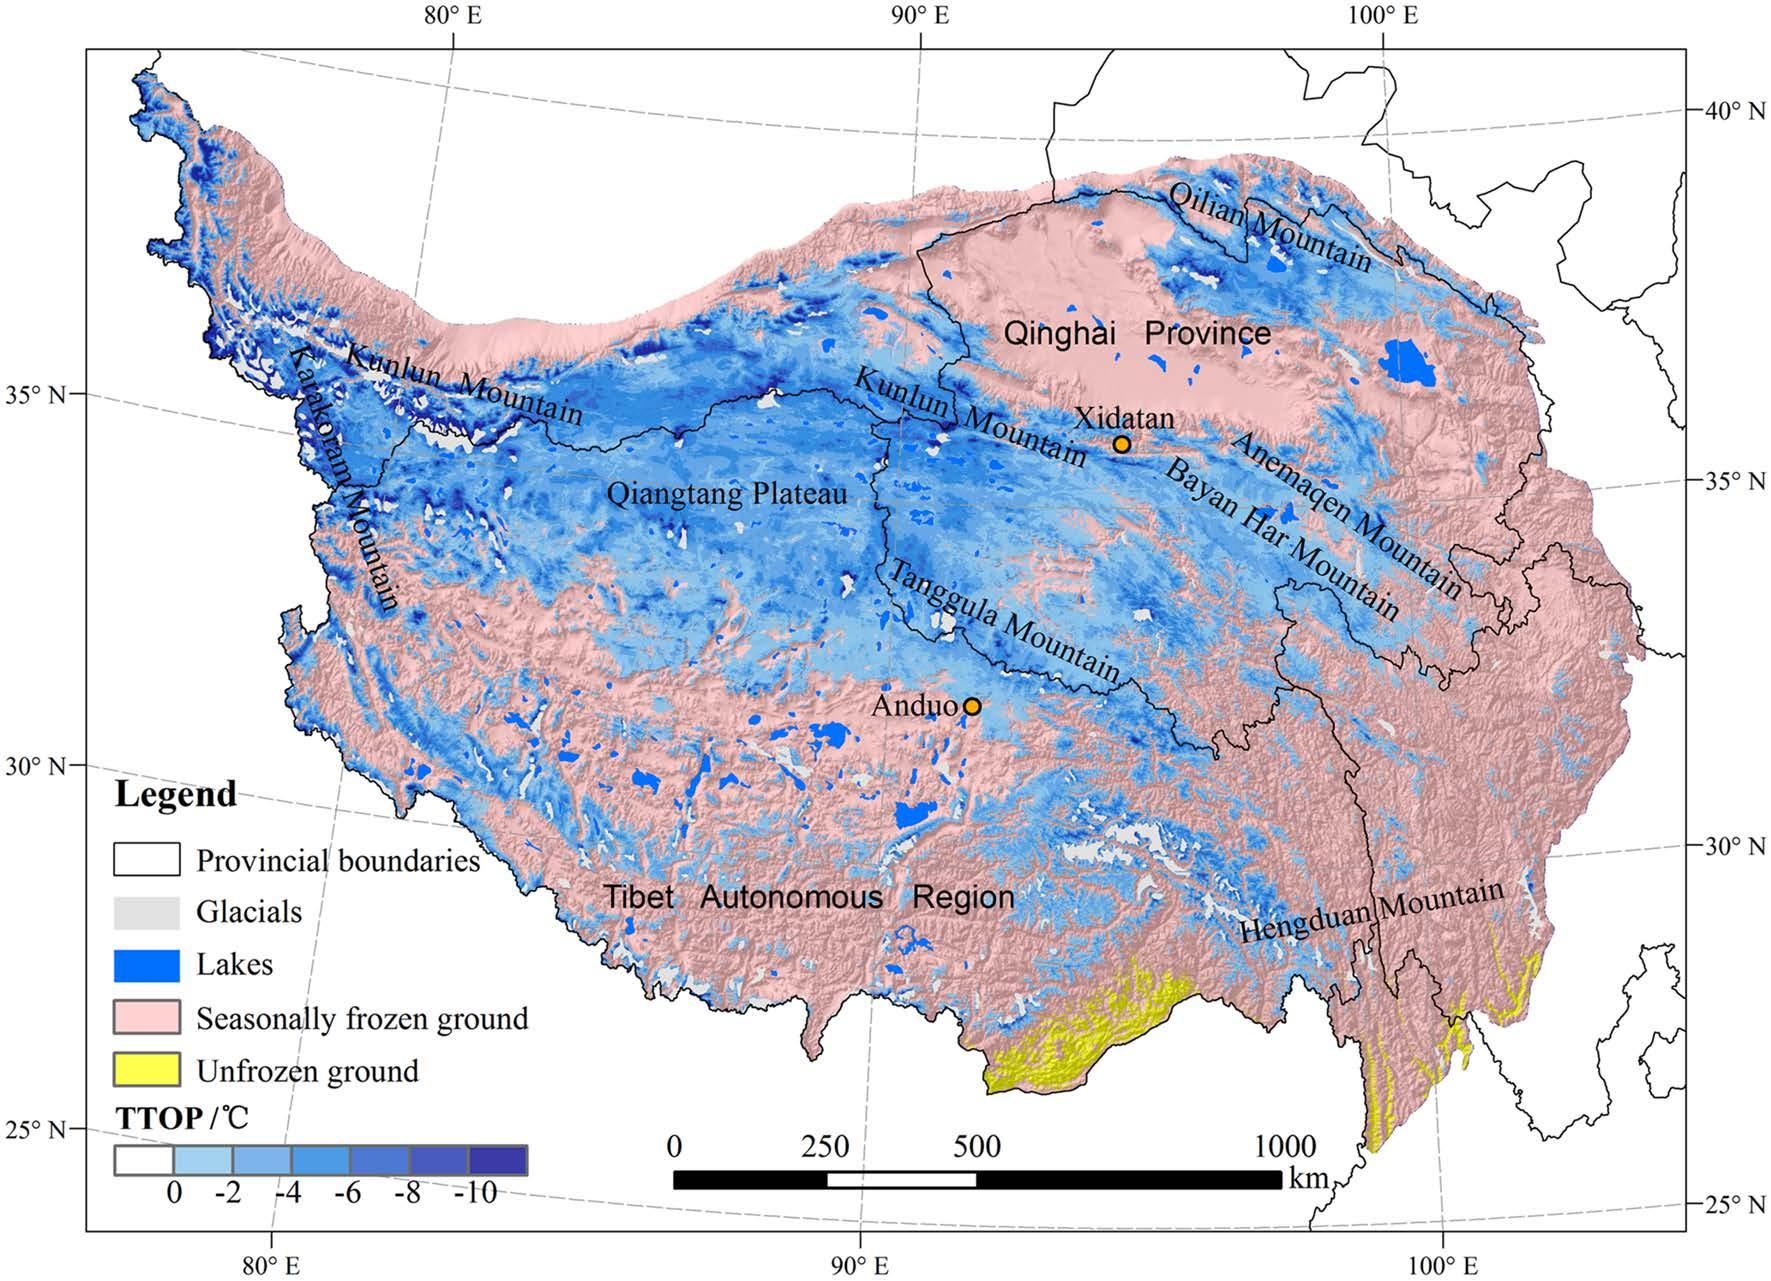
Qinghai Tibet Plateau is the largest permafrost area in the world. At present, some permafrost distribution maps have been compiled. However, due to the limited data sources, unclear standards, insufficient verification and lack of high-quality spatial data sets, there is great uncertainty in drawing Permafrost Distribution Maps on TP. Based on the improved medium resolution imaging spectrometer (MODIS) surface temperature (LSTS) model of 1 km clear sky mod11a2 (Terra MODIS) and myd11a2 (Aqua MODIS) product (reprocessing version 5) in 2003-2012, the data set simulates the distribution of permafrost and generates the permafrost map of Qinghai Tibet Plateau. The map was verified by field observation, soil moisture content and bulk density. Permafrost attributes mainly include: seasonally frozen ground, permafrost and unfrozen ground. The data set provides more detailed data of Permafrost Distribution and basic data for the study of permafrost in the Qinghai Tibet Plateau.
2020-06-02 View Details
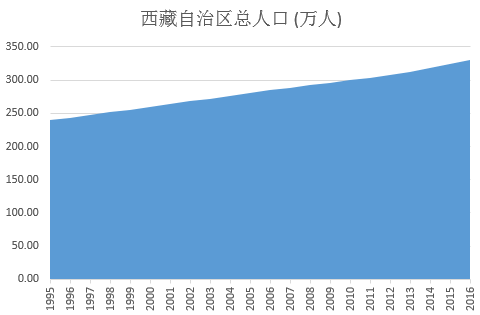
This dataset is the population index, which includes the dataset of Qinghai Province and Tibet Autonomous Region. It can be used for the coupling coordination relationship between urbanization and eco-environment in Qinghai-Tibet Plateau. The time span in Tibet Autonomous Region is 1995-2016. Permanent residents is based on the population census and the annual population change sampling survey. In addition to the total permanent population, the data were also calculated by gender and urban and rural areas. The time span is from 1952 to 2015 in Qinghai Province, and the indices are resident population, birth, death and natural increase. All data is from the statistical yearbook.
2020-05-28 View Details
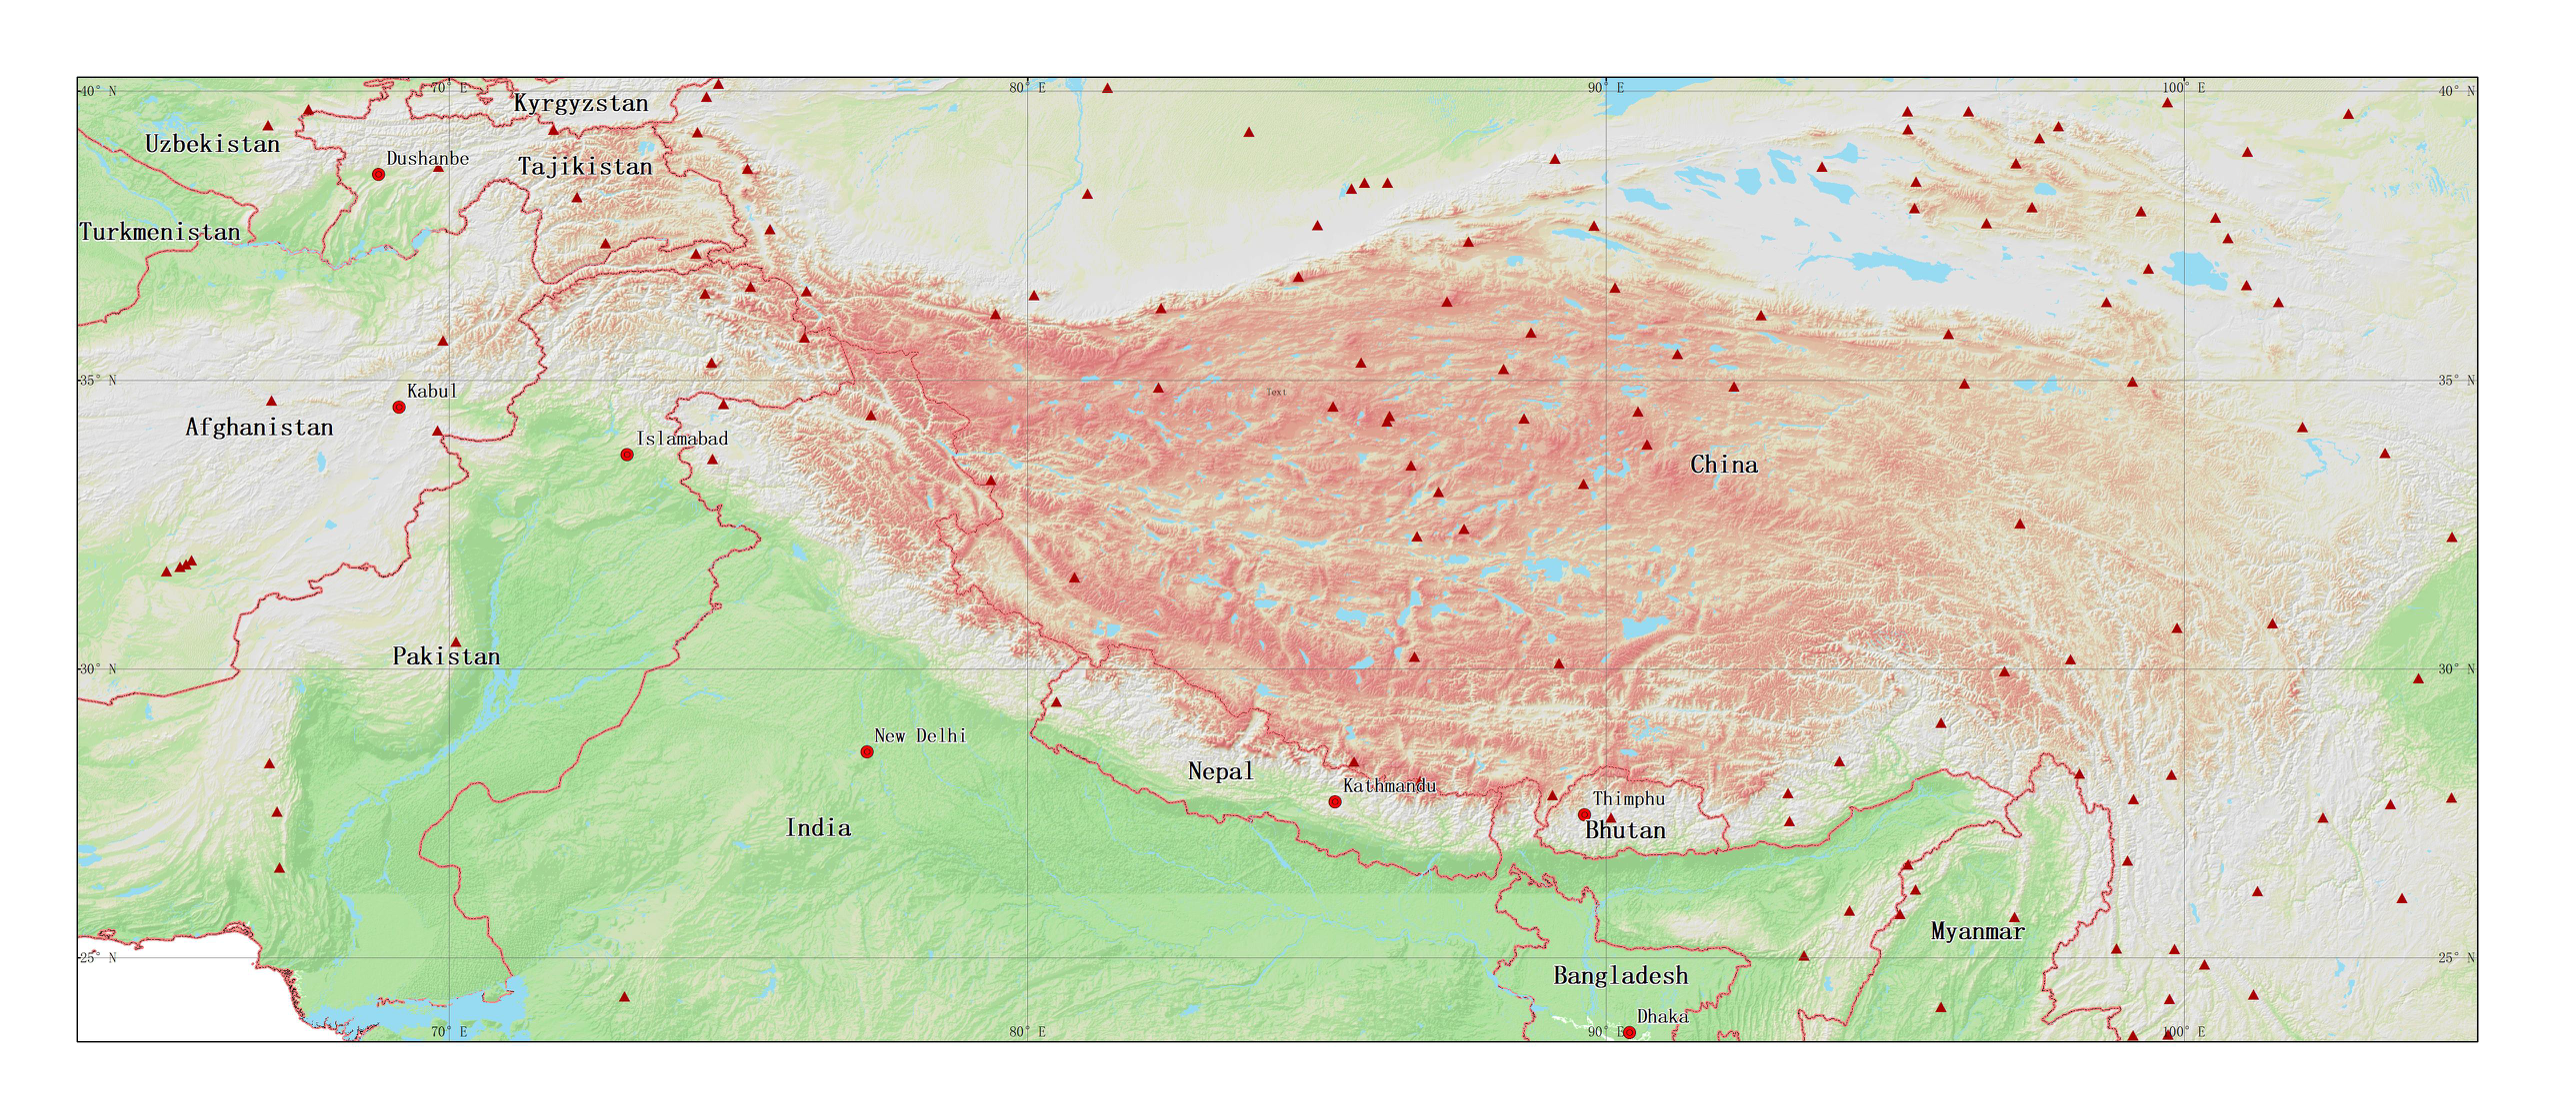
The third pole 1:100,000 range data set includes:Mountains(Tibet_Mountains)vector space data set and its attribute name:Name(Name)、Countries Name(CNTRY_NAME)、Countries Referred to as(CNTRY_CODE)、Latitude(LATITUDE)、Longitude(LONGITUDE). The data comes from the 1:100,000 ADC_WorldMap global data set,The data through topology, warehousing and other data quality inspection,Data through the topology, into the library,It's comprehensive, up-to-date and seamless geodigital data. The world map coordinate system is latitude and longitude, D_WGS_1984 datum surface
2020-05-28 View Details
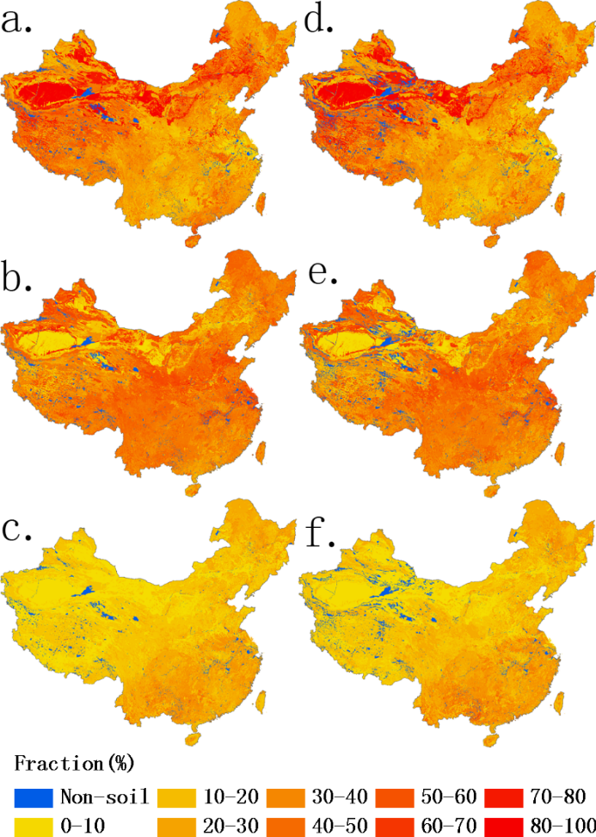
A multi-layer soil particle-size distribution dataset (sand, silt and clay content), based on USDA (United States Department of Agriculture) standard for regional land and climate modelling in China. was developed The 1:1,000,000 scale soil map of China and 8595 soil profiles from the Second National Soil Survey served as the starting point for this work. We reclassified the inconsistent soil profiles into the proper soil type of the map as much as possible because the soil classification names of the map units and profiles were not quite the same. The sand, silt and clay maps were derived using the polygon linkage method, which linked soil profiles and map polygons considering the distance between them, the sample sizes of the profiles, and soil classification information. For comparison, a soil type linkage was also generated by linking the map units and soil profiles with the same soil type. The quality of the derived soil fractions was reliable. Overall, the map polygon linkage offered better results than the soil type linkage or the Harmonized World Soil Database. The dataset, with a 1-km resolution, can be applied to land and climate modelling at a regional scale. Data characteristics: projection:projection Coverage: China Resolution: 0.00833 (about 1 km) Data format: FLT, TIFF Value range: 0%-100% Document describing: Floating point raster files include: Sand1. FLT, clay1. FLT -- surface (0-30cm) sand, clay content. Sand2. FLT, clay2. FLT -- content of sand and clay in the bottom layer (30-100cm). PSD. HDR -- header file: Ncols - the number of columns Nrows- rows Xllcorner - latitude in the lower left corner Yllcorner - longitude of the lower left corner Cellsize - cellsize NODATA_value - a null value byteorder - LSBFIRST, Least Significant Bit First TIFF raster files include: Sand1. Tif, clay1. Tif - surface (0-30cm) sand, clay content. Sand2. Tif, clay2. Tif - bottom layer (30-100cm) sand, clay content.
2020-05-28 View Details
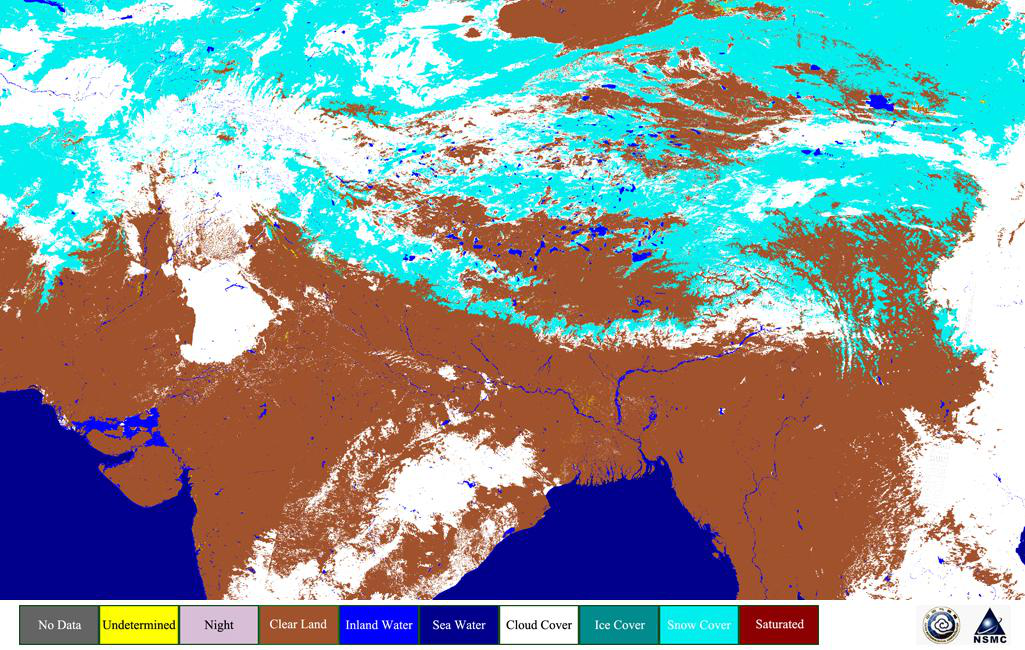
Snow cover dataset is produced by snow and cloud identification method based on optical instrument observation data, covering the time from 1989 to 2018 (two periods, from January to April and from October to December) and the region of Qinghai-Tibet Plateau (17°N-41°N, 65°E-106°E) with daily product, which takes equal latitude and longitude projection with 0.01°×0.01° spatial resolution, and characterizes whether the ground under clear sky or transparent thin cloud is covered by snow. The input data sources include AVHRR L1 data of NOAA and MetOp serials of satellites, and L1 data corresponding to AVHRR channels taken from TERRA/MODIS. Decision Tree algorithm (DT) with dynamic thresholds is employed independent of cloud mask and its cloud detection emphasizes on reserving snow, particularly under transparency cirrus. It considers a variety of methods for different situations, such as ice-cloud over the water-cloud, snow in forest and sand, thin snow or melting snow, etc. Besides those, setting dynamic threshold based on land-surface type, DEM and season variation, deleting false snow in low latitude forest covered by heavy aerosol or soot, referring to maximum monthly snowlines and minimum snow surface brightness temperature, and optimizing discrimination program, these techniques all contribute to DT. DT discriminates most snow and cloud under normal circumstances, but underestimates snow on the Qinghai-Tibet Plateau in October. Daily product achieves about 95% average coincidence rate of snow and non-snow identification compared to ground-based snow depth observation in years. The dataset is stored in the standard HDF4 files each having two SDSs of snow cover and quality code with the dimensions of 4100-column and 2400-line. Complete attribute descriptions is written in them.
2020-05-28 View Details
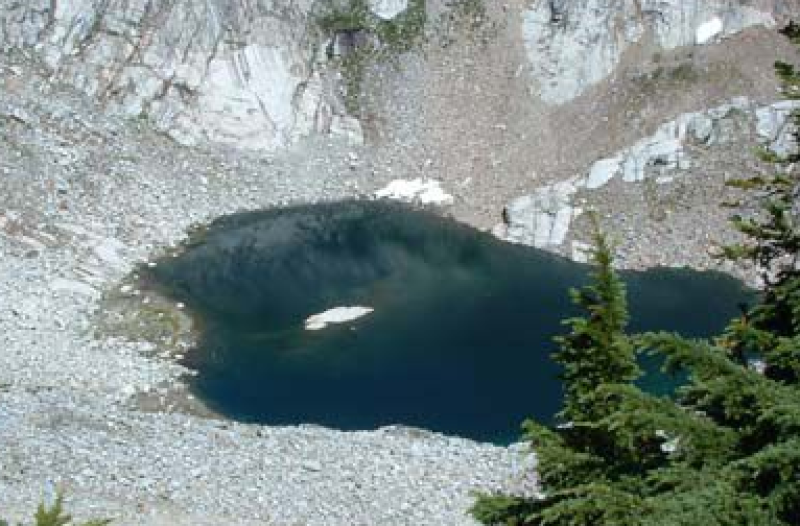
There are three types of glacial lakes: supraglacial lakes, lakes attached to the end of the glacier and lakes not attached to the end of the glacier. Based on this classification, the following properties are studied: the variation in the number and area of glacial lakes in different basins in the Third Pole region, the changes in extent in terms of size and area, distance from glaciers, the differences in area changes between lakes with and without the supply of glacial melt water runoff, the characteristics of changes in the glacial lake area with respect to elevation, etc. Data source: Landsat TM/ETM+ 1990, 2000, 2010. The data were visually interpreted, which included checking and editing by comparing the original image with Google Earth images when the area was greater than 0.003 square kilometres. The data were applied to glacial lake changes and glacial lake outburst flood assessments in the Third Pole region. Data type: Vector data. Projected Coordinate System: Albers Conical Equal Area.
2020-05-04 View Details
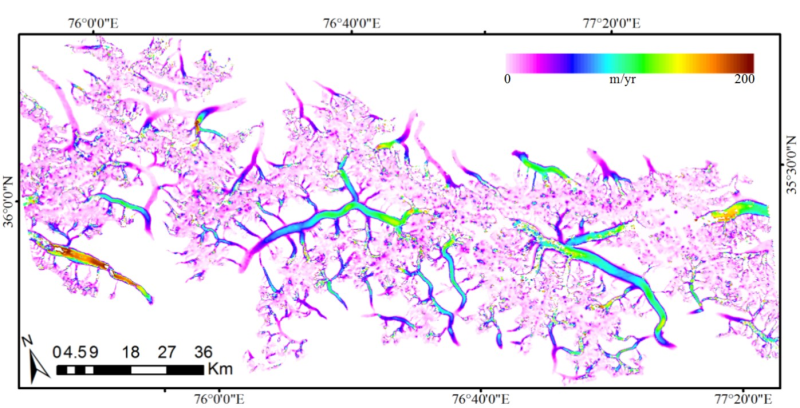
Under the background of global warming, mountain glaciers worldwide are facing strong ablation and retreat, but from existing field observations, it is found that most of the glaciers in the Karakorum region remain stable or are advancing, which is called the "Karakorum anomaly". Glacier surface velocity is an important parameter for studying glacier dynamics and mass balance. Studying the temporal and spatial variation characteristics of glacier velocity in central Karakorum is significant for understanding the dynamic characteristics of the glacier in this region and its response to climate change. Four pairs of Landsat 7 ETM+ images acquired in 1999 to 2003 (images acquired on 1999.7.16, 2000.6.16, 2001.7.21, 2002.8.9, 2002.4.19, 2003.3.21) were selected; using the panchromatic band with a resolution of 15 m, each pair of images was accurately registered, and then cross-correlation calculations were then performed on each image pair after registration to obtain the surface velocity of the glacier in the central Karakorum region from 1999 to 2003. Due to the lack of velocity observation data in the study area, the accuracy of the ice flow results is estimated using the offset value of the stable region, and the surface velocity error of the glacier is approximately ±7 m/year. The glacier velocity data dates are from 1999 to 2003, with a temporal resolution of one year. They cover the central Karakorum region, with a spatial resolution of 30 m. The data are stored as a GeoTIFF file every year. For details regarding the data, please refer to the data description.
2020-04-29 View Details
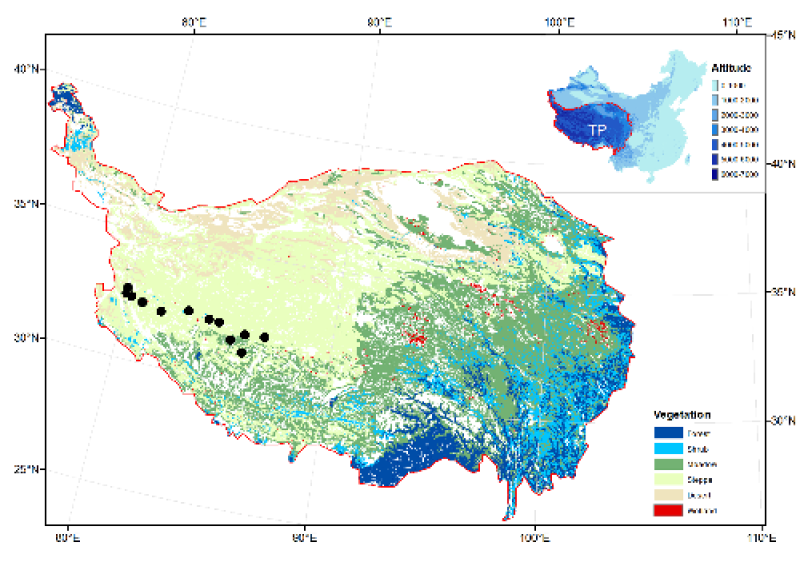
The data set of bacterial diversity in Tibetan soil provides the microbial distribution characteristics of the soil surface (0-2 cm) of the Tibetan Plateau. The samples were collected from July 1st to July 15th, 2015, from three types of ecosystems: meadows, grasslands and desert. The soil samples were stored in ice packs and transported to the Ecological Laboratory of the Institute of Tibetan Plateau Research in Beijing. The DNA from the soil was extracted using an MO BIO Power Soil DNA kit. The soil surface samples were stored in liquid nitrogen after collection, shipped to the Sydney laboratory, and then extracted using a Fast Prep DNA kit. The extracted DNA samples adopted 515F (5'-GTGCCAGCMGCCGCGGTAA-3') and 909r (5'-GGACTACHVGGGTWTCTAAT-3') to amplify the 16S rRNA gene fragments. The amplified fragments were sequenced by the Illumina Miseq PE250 method, and the raw data were analyzed using Mothur software. The sequences with poor sequencing quality were first removed; the sequences were sorted, and the chimeric sequences were removed. The similarities between the sequences were then calculated, the sequences with similarities above 97% were clustered into one OTU, and the OTU representative sequence was defined. The OTU representative sequence was compared with the Silva database and identified as level one when the reliability exceeded 80%. The microbial diversities in these data on the Tibetan Plateau were systematically compared, which made them significant to the study of the microbial distribution on the Tibetan Plateau.
2020-04-29 View Details
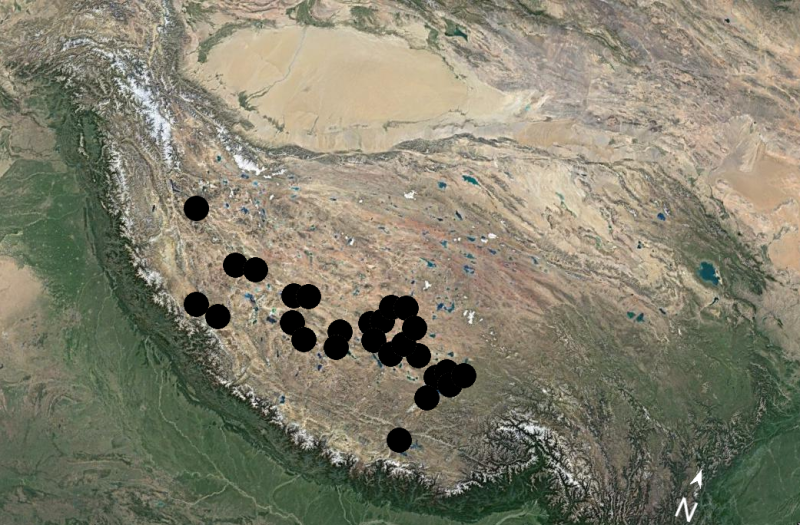
Microbial diversity data of lakes on the Tibetan Plateau. One hundred and thirty-eight samples were collected from July 1st to July 15th, 2015, from 28 lakes (Bamco, Baima Lake, Bange Salt Lake, Bangong Lake, Bengco, Bieruozeco, Cuoeco, Cuoe (Pingcuo North), Dawaco, Dangqiongco, Dangreyongco, Dongco, Eyacuoqiong, Gongzhuco, Guogenco, Jiarebuco, Mapangyongco, Namco, Nieerco (Salt Lake), Normaco, Pengyanco, Pengco, Qiangyong, Selinco, Wuruco, Wumaco, Zharinanmuco, and Zhaxico). The salinity gradients range from 0.07-118 ppm. The DNA extraction method: The DNA was extracted using an MO BIO PowerSoil DNA kit after the lake water was filtered onto a 0.45 membrane. The 16S rRNA gene fragment amplification primers were 515F (5'-GTGCCAGCMGCCGCGGTAA-3') and 909r (5'-GGACTACHVGGGTWTCTAAT-3'). The sequencing method was Illumina MiSeq PE250, and the raw data were analyzed by Mothur software, including quality filtering and chimera removal. The sequence classification was based on the Silva109 database, and archaea, eukaryotic and unknown source sequences have been removed. OTUs were classified by 97% similarity, and sequences that appear once in the database were then removed. Finally, each sample was resampled to 7,230 sequences/sample. GPS coordinates, evolutionary information, and environmental factors are listed in the data.
2020-04-29 View Details
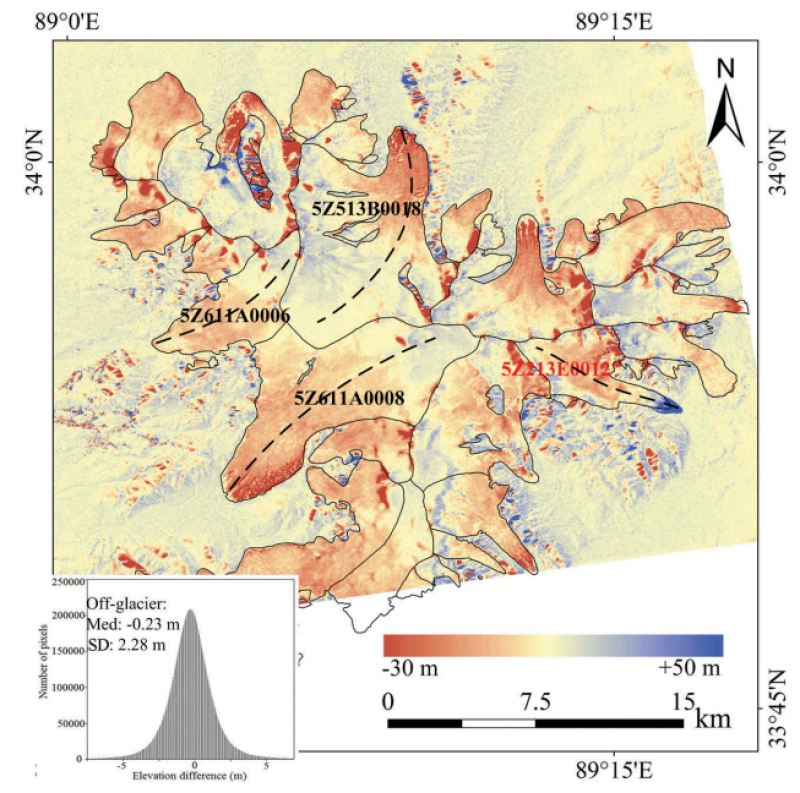
The continuous advancement of SAR interferometry technology makes it possible to obtain multitemporal DEMs with high precision in the glacial area. In particular, in 2000, the Shuttle Radar Topography Mission (SRTM) led by NASA provided DEM data covering the area from 56ºS to 60ºN; the TanDEM-X bistatic SAR interferometry system of DLR could provide the global DEM data with high resolution and precision. These high-quality, large-coverage SAR interferometry data, as well as published DEM data products, provided valuable information for using the multitemporal DEMs to detect changes in ice thickness. The temporal coverage of the ice thickness variation data of typical glaciers on the Tibetan Plateau was from 2000 to 2013, covering Puruogangri and the west Qilian Mountains with a spatial resolution of 30 meters. Using TanDEM-X bistatic InSAR data and a C-band SRTM DEM, the differential radar interferometry method was first used to generate a TanDEM-X DEM with high precision. Then, based on the precise registration of DEM, the DEM data obtained in different periods were compared. Lastly, the ice thickness changes were estimated. The format of the data set was GeoTIFF, and each typical glacier ice thickness change was stored in a folder. For details of the data, please refer to the Ice elevation changes for typical glaciers on the Tibetan Plateau - Data Description.
2020-04-29 View Details
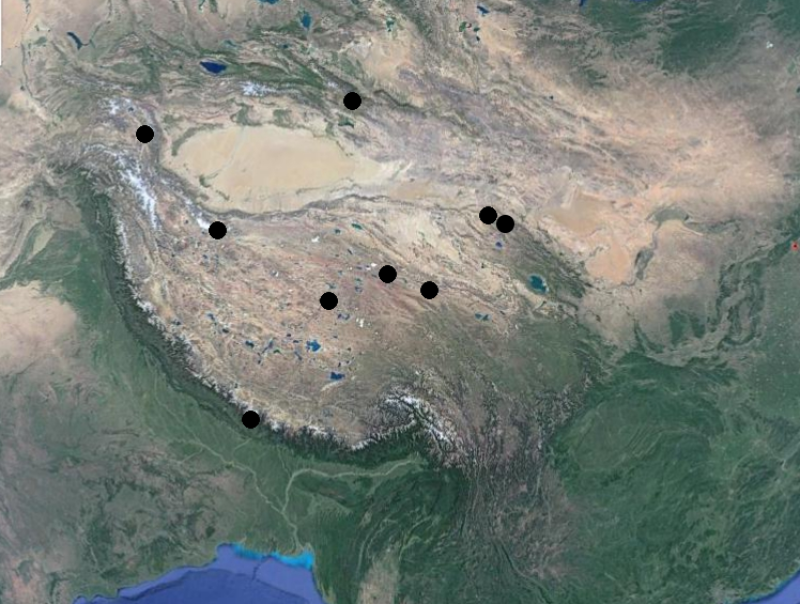
The glacial bacterial resource database of the Tibetan Plateau provides the bacterial 16S ribosomal RNA gene sequences of several glaciers, which are seven glaciers of the Tibetan Plateau separated by an experimental group led by Yongqin Liu during 2010 to 2018 (East Rongbuk Glacier of Mt. Qomolangma, Tianshan Glacier No.1, Guliya Glacier, Laohugou Glacier, Muztagh Ata Glacier, Qiyi Glacier and Yuzhufeng Glacier), the Malan Glacier separated by Shurong Xiang and the Puruogangri Glacier separated by Xinfang Zhang. After the glacier samples were collected, they were taken to the Ecological Laboratory of the Institute of Tibetan Plateau Research of the Chinese Academy of Sciences in Beijing and the National Cryosphere Laboratory in Lanzhou. After applying the spread plate method, the samples were cultured at different temperatures (4-25 °C) for 20 days to 90 days, and single colonies were picked out for purification. After the DNA was extracted from the isolated bacteria, the 16S ribosomal RNA gene fragment was amplified with 27F/1492R primer and sequenced using the Sanger method. The 16S ribosomal RNA gene sequence was compared with the RDP database using the "Classifier" software and identified as level one when the reliability exceeded 80%. These data contain the 16S ribosomal RNA gene fragment sequence and glacier sources of each sequence. Compared with sequences based on high-throughput sequencing, these data have a longer sequence and more accurate classification and can better serve in glacier microbiology research.
2020-04-29 View Details

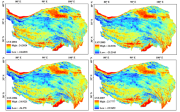
As the main parameter in the land surface energy balance, surface temperature indicates the degree of land-atmosphere energy and water transfer and is widely used in research on climatology, hydrology and ecology. In the study of frozen soil, climate is one of the decisive factors for the existence and development of frozen soil. The surface temperature is the main climatic factor affecting the distribution of frozen soil and affects the occurrence, development and distribution of frozen soil. It is the upper boundary condition for modelling frozen soil and is significant to the study of hydrological processes in cold regions. The data set was based on the DEM and observation station data of the Tibetan Plateau Engineering Corridor and analysed the changing trend of surface temperature on the Tibetan Plateau from 2000 to 2014. Using the surface temperature data products MOD11A1/A2 and MYD11A1/A2 of MODIS aboard Terra and Aqua, the surface temperature information under cloud cover was reconstructed based on the spatio-temporal information of the images. The reconstruction information and surface temperature representativeness problems were analysed using information obtained from 8 sites, including the Kunlun Mountains (wetland, grassland), Beiluhe (grassland, meadow), Kaixinling (meadow, grassland), and Tanggula Mountain (meadow, wetland). According to the correlation coefficient (R2), root-mean-square error (RMSE), mean absolute error (MAE) and mean deviation (MBE), the following results were obtained: (1) the reconstruction accuracy of MODIS surface temperature under cloud cover is higher when it is based on spatio-temporal information; (2) the weighted average representation is the best when generalizing four observations of Terra and Aqua. By analysing the reconstruction of MODIS surface temperature information and representativeness problems, the average annual MODIS surface temperature data of the Tibetan Plateau and the engineering corridor from 2000 to 2010 were obtained. According to the data set, the surface temperature from 2000 to 2010 also experienced volatile rising trends from 2000 to 2010, which is basically consistent with the changing trend of the climate change in the permafrost regions of the Tibetan Plateau and the Qinghai-Tibet Engineering Corridor.
2020-04-29 View Details
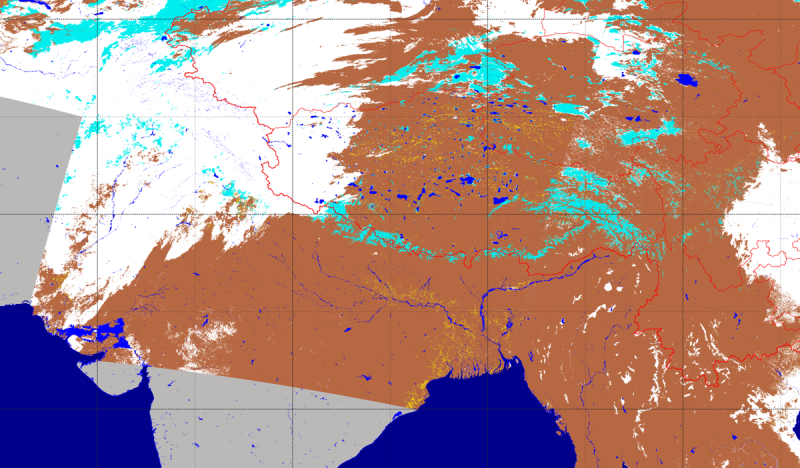
The variation in the duration of snow on the Tibetan Plateau is relatively great, and the high mountainous areas around the plateau are rich in snow and ice resources. Taking full account of the terrain of the Tibetan Plateau and the snow characteristics in the mountains, the data set adopted AVHRR data to gradually realize generating data products for daily, ten-day, and monthly snow cover areas while maintaining the snow classification accuracy. These data included the daily/10-day/monthly snow cover area data for the Tibetan Plateau from 2007 to 2015, the average accuracy of which is 0.92. It can provide reliable data for snow changes during the historical periods of the Tibetan Plateau.
2020-04-29 View Details
Contact Support
Links
National Tibetan Plateau Data CenterFollow Us

A Big Earth Data Platform for Three Poles © 2018-2020 No.05000491 | All Rights Reserved
|  No.11010502040845
Tech Support: westdc.cn