
Brief Introduction:The Tibetan Plateau, known as the " third pole " of the earth, has always been the focus of attention of the international community because it is an important area driving global environmental change research and has a profound regulatory effect on the ecology, environment and climate of the whole earth. Under the background of global warming, the cryosphere elements such as tripolar glaciers, frozen soils, and freeze-thaw lakes have undergone significant changes, with glaciers shrinking rapidly and permafrost active layers thickening. For a long time, China has carried out systematic and multidisciplinary research in the world ' s third pole with the Qinghai-Tibet Plateau as the main body, forming a rich research accumulation.
Publish Datetime:2022-12-13
Number of Datasets:184
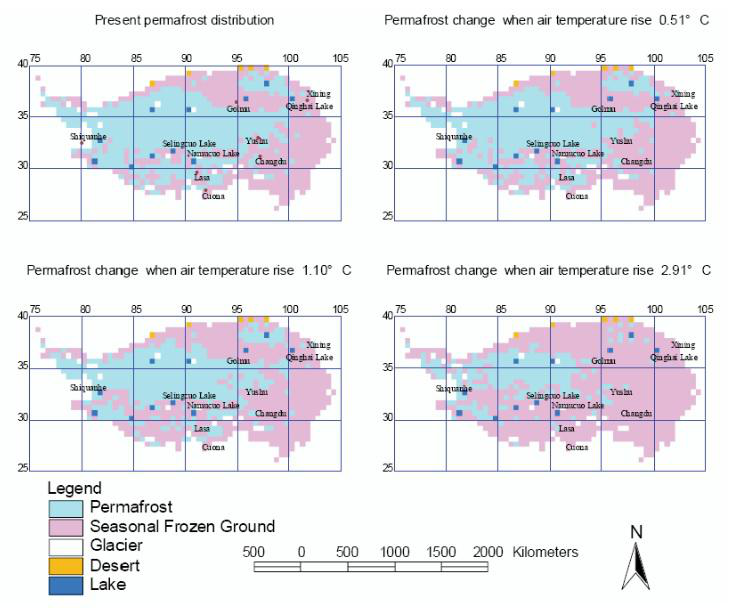
Chinese Cryospheric Information System is a comprehensive information system for the management and analysis of Chinese Cryospheric data. The establishment of Chinese Cryospheric Information System is to meet the needs of earth system science, to provide parameters and validation data for the development of response and feedback model of frozen soil, glacier and snow cover to global change under GIS framework; on the other hand, it is to systemically sort out and rescue valuable cryospheric data, to provide a scientific, efficient and safe management and division for it Analysis tools. The basic datasets of the Tibet Plateau mainly takes the Tibetan Plateau as the research region, ranging from longitude 70 -- 105 ° east and latitude 20 -- 40 ° north, containing the following types of data: 1. Cryosphere data. Includes: Permafrost type (Frozengd), (Fromap); Snow depth distribution (Snowdpt) Quatgla (Quatgla) 2. Natural environment and resources. Includes: Terrain: elevation, elevation zoning, slope, slope direction (DEM); Hydrology: surface water (Stram_line), (Lake); Basic geology: Quatgeo, Hydrogeo; Surface properties: Vegetat; 4. Climate data: temperature, surface temperature, and precipitation. 3. Socio-economic resources (Stations) : distribution of meteorological Stations on the Tibetan Plateau and it surrounding areas. 4. Response model of plateau permafrost to global change (named "Fgmodel"): permafrost distribution data in 2009, 2049 and 2099 were projected. Please refer to the following documents (in Chinese): "Design of Chinese Cryospheric Information System.doc", "Datasheet of Chinese Cryospheric Information System.DOC", "Database of the Tibetan Plateau.DOC" and "Database of the Tibetan Plateau 2.DOC".
2020-06-23 View Details
The application of general circulation models (GCMs) can improve our understanding of climate forcing. In addition, longer climate records and a wider range of climate states can help assess the ability of the models to simulate climate differences from the present. First, we try to find a substitute index that combines the effects of temperature in different seasons and then combine it with the Beijing stalagmite layer sequence and the Qilian tree-ring sequence to carry out a large-scale temperature reconstruction of China over the past millennium. We then compare the results with the simulated temperature record based on a GCM and ECH-G for the past millennium. Based on the 31-year average, the correlation coefficient between the simulated and reconstructed temperature records was 0.61 (with P < 0.01). The asymmetric V-type low-frequency variation revealed by the combination of the substitute index and the simulation series is the main long-term model of China's millennium-scale temperature. Therefore, solar irradiance and greenhouse gases can account for most of the low-frequency variation. To preserve low-frequency information, conservative detrended methods were used to eliminate age-related growth trends in the experiment. Each tree-ring series has a negative exponential curve installed while retaining all changes. The four fields of the combined 1000-yr (1000 AD-2000 AD) reconstructed temperature records derived from stalagmite and tree-ring archives (excel table) are as follows: 1) Year 2) Annual average temperature reconstruction 3) Reconstructed temperature deviation 4) Simulated temperature deviation
2020-06-09 View Details
This glacial lake inventory receives joint support from International Centre for Integrated Mountain Development (ICIMOD) and United Nations Environment Programme/Regional Resource Centre, Asia and the Pacific (UNEP/RRC-AP). 1. This glacial lake inventory referred to Landsat 4/5 (MSS, TM/1984/1999), Landsat 7 (TM & ETM+), IRS-1C, LISS-III (1995 IRS-1C), (1997 IRS-1D) and other remote sensing data. It reflects the current situation of glacial lakes with areas larger than 0.01 km2 in 2000. 2. Glacial Lake Inventory Coverage: Tista Basin, Sikkim Region 3. Glacial Lake Inventory includes: glacial lake inventory, glacial lake type, glacial lake orientation, glacial lake width, glacial lake area, glacial lake depth, glacial lake length and other attributes. 4. Projection parameter: Projection: Lambert conformal conic Ellipsoid: Everest (India 1956) Datum: India (India, Sikkim) False easting: 2743196.40 False northing: 914398.80 Central meridian: 90°00’00” E Central parallel: 26°00’00” N Scale factor: 0.998786 Standard parallel 1: 23°09’28.17” N Standard parallel 2: 28°49’8.18” N Minimum X Value: 2545172 Maximum X Value: 2645240 Minimum Y Value: 1026436 Maximum Y Value: 1163523 For a detailed data description, please refer to the data file and report.
2020-06-09 View Details
This glacial lake inventory is supported by the International Centre for Integrated Mountain Development (ICIMOD) and the United Nations Environment Programme/Regional Resource Centre, Asia and The Pacific (UNEP/RRC-AP). 1. The glacial lake inventory adopts the Landsat remote sensing data and reflects the status of glacial lakes in the Pakistan region from 2003 to 2004. 2. In terms of spatial coverage, the glacial lake inventory covers the Swat, Chitral, Gilgit, Hunza, Shigar, Shyok, Upper, Indus, Shingo, Astor and Jhelum river basins in the upper reaches of the Indus River. 3. The glacial lake inventory data include the glacial lake code, glacial lake type, glacial lake area, distance between the glacier and the glacial lake, glaciers related to the glacial lake, etc. For detailed descriptions of the data, please refer to the data file and report.
2020-06-09 View Details
This glacier inventory is supported by the International Centre for Integrated Mountain Development (ICIMOD) and the United Nation Environment Programme/Regional Resources Centre, Asia and The Pacific (UNEP/RRC-AP)。 1、The glacier inventory uses the remote sensing data of Landsat,reflecting the current status of glaciers in Nepal in 2000. 2、The spatial coverage of the glacier inventory: Nepal 3、Contents of the glacier inventory: glacier location, glacier code, glacier name, glacier area, glacier length, glacier thickness, glacier stocks, glacier type, glacier orientation, etc. 4、Data Projection: Grid Zone IIA Projection: Lambert conformal conic Ellipsoid: Everest (India 1956) Datum: India (India, Nepal) False easting: 2743196.40 False northing: 914398.80 Central meridian: 90°00'00"E Central parallel: 26°00'00"N Scale factor: 0.998786 Standard parallel 1: 23°09'28.17"N Standard parallel 2: 28°49'8.18"N Minimum X Value: 1920240 Maximum X Value: 2651760 Minimum Y Value: 914398 Maximum Y Value: 1188720 Grid Zone IIB Projection: Lambert conformal conic Ellipsoid: Everest (India 1956) Datum: India (India, Nepal) False easting: 2743196.40 False northing: 914398.80 Central meridian: 90°00'00"E Central parallel: 26°00'00"N Scale factor: 0.998786 Standard parallel 1: 21°30'00"N Standard parallel 2: 30°00'00"N Minimum X Value: 1823188 Maximum X Value: 2000644 Minimum Y Value: 1306643 Maximum Y Value: 1433476 For a detailed data description, please refer to the data file and report.
2020-06-09 View Details
This glacial lake inventory receives joint support from the International Centre for Integrated Mountain Development (ICIMOD) and the United Nations Environment Programme/Regional Resources Centre for Asia and the Pacific (UNEP/RRC-AP), Cold and Arid Region Environmental and Engineering Research Institute (CAREERI). 9. This glacial lake cataloging uses Landsat (TM and ETM), Aster and other remote sensing data. It reflects the current situation of glacial lakes with areas larger than 0.01 km2 in the Himalayas in 2004. 10. Glacial lake catalogue coverage: the Himalayan region, Pumqu (Arun), Rongxer (Tama Koshi), Poiqu (Bhote-Sun Koshi), Jilongcangbu (Trishuli), Zangbuqin (Budhigandaki), Majiacangbu (Humla Karnali) and others. 11. Glacial Lake cataloging includes glacial lake cataloging, glacial lake type, glacial lake orientation, glacial lake width, glacial lake area, glacial lake depth, glacial lake length and other attributes. 12. Data projection information: Projection: Transverse_Mercator False_Easting: 500000.000000 False_Northing: 0.000000 Central_Meridian: 87.000000 Scale_Factor: 0.999600 Latitude_Of_Origin: 0.000000 Linear Unit: Meter (1.000000) Geographic Coordinate System: GCS_WGS_1984 Angular Unit: Degree (0.017453292519943299) Prime Meridian: Greenwich (0.000000000000000000) Datum: D_WGS_1984 Spheroid: WGS_1984 Semimajor Axis: 6378137.000000000000000000 Semiminor Axis: 6356752.314245179300000000 Inverse Flattening: 298.257223563000030000 For a detailed data description, please refer to the data file and report.
2020-06-09 View Details
This glacial lake inventory is supported by the International Centre for Integrated Mountain Development (ICIMOD) and the United Nations Environment Programme/Regional Resource Centre, Asia and The Pacific (UNEP/RRC-AP). 1. The glacial lake inventory incorporates topographic map data and reflects the status of glacial lakes in the region in 2000. 2. The spatial coverage of the glacial lake inventory is as follows: Pa Chu Sub-basin, Mo Chu Sub-basin, Thim Chu Sub-basin, Pho Chu Sub-basin, Mangde Chu Sub-basin, Chamkhar Chu Sub-basin, Kuri Chu Sub-basin, Dangme Chu Sub-basin, Northern Basin, etc. 3. The glacial lake inventory includes the following data fields: glacial lake code, glacial lake types, glacial lake orientation, glacial lake width, glacial lake area, glacial lake depth, glacial lake length, etc. 4. Data projection: Projection: Polyconic Ellipsoid: Everest (India 1956) Datum: Indian (India, Nepal) False easting: 2,743,196.4 False northing: 914,398.80 Central meridian: 90°0'00'' E Central parallel: 26°0'00'' N Scale factor: 0.998786 For a detailed description of the data, please refer to the data file and report.
2020-06-09 View Details
The data are a digitized permafrost map along the Qinghai-Tibet Highway (1:600,000) (Boliang Tong, et al. 1983), which was compiled by Boliang Tong, shude Li, Jueying bu, and Guoqing Qiu from the Cold and Arid Regions Environmental and Engineering Research Institute of the Chinese Academy of Sciences (originally called the Lanzhou Institute of Glaciology and Cryopedology, Chinese Academy of Sciences) in 1981. The map aims to reflect the basic laws of permafrost distribution along the highway and its relationship with the main natural environmental factors. The basic data for the compilation of the map include hydrogeological and engineering geological survey results and maps along the Qinghai-Tibet Highway(1:200000) (First Hydrogeological Engineering Geological Brigade of Qinghai Province, Institute of Geomechanics of the Academy of Geological Science), the cryopedological research results of the Institute of Glaciology and Cryopedology of Chinese Academy of Sciences since 1960 in nine locations along the Qinghai-Tibet Highway (West Datan, Kunlun pass basin, Qingshuihe, Fenghuohe, Tuotuohe, the Sangma Basin, Buquhe, Tumengela, and Liangdaohe) and drilling data of the Golmud-Lhasa oil pipeline and aerial topographic data of the work area. Taking the 1:200000 topographic map as the working base map, a permafrost map was compiled, which was then downscaled to a 1:600000 map to ensure the accuracy of the map. To make up for the lack of data in a larger area along the line, the characteristics and principles of the frozen soils found in the nine frozen soil research points along the highway were applied to areas with the same geologic and geographical conditions; meanwhile, aerial photographs were used as supplements to the freeze-thaw geology and frozen soil characteristics. The permafrost map along the Qinghai-Tibet Highway (1:600,000) includes the annual average temperature contour map along the Qinghai-Tibet Highway (1:7,200,000) and the permafrost map along the Qinghai-Tibet Highway (1:600,000). The permafrost map along the Qinghai-Tibet Highway also contains information on permafrost types, lithology, frozen soil phenomena, types of through-melting zones, classification of frozen soil engineering, and geological structural fractures. These data contain only digitized permafrost information. The spatial coverage is from Daxitan on the Qinghai-Tibet Highway in the north to Sangxiong in the south and is nearly 800 kilometers long and 40-50 kilometers wide. The data set includes a vectorized and a scanned map of the permafrost map along the Qinghai-Tibet Highway. The attribute information of the map is as follows. A-1; Continuous permafrost; >0°C; remained as a frozen soil layer and isolation layer A-2; Continuous permafrost; 0~-0.5°C; 0-25 m A-3; Continuous permafrost; -0.5~-1.5°C; 25-60 m A-4; Continuous permafrost; -1.5~-3.5°C; 60-120 m A-5;Continuous permafrost;<-3.5°C;>120 m B-1; Island permafrost ground; Seasonal Frozen Ground; B-2; Continuous permafrost; >0°C; remained as a frozen soil layer and isolation layer B-3; Island permafrost extent; 0~-0.5°C; 0-25 m B-4; Island permafrost extent; -0.5~-1.5°C; 25-60 m B-5; Island permafrost extent; -1.5~-3.5°C; 60-120 m
2020-06-09 View Details
This glacial lake inventory is supported by the International Centre for Integrated Mountain Development (ICIMOD) and the United Nation Environment Programme/Regional Resources Centre, Asia and The Pacific (UNEP/RRC-AP). 1. The glacial lake inventory uses the remote sensing data of Landsat,reflecting the current status of glacial lakes larger than 0.01 square kilometers in Nepal in 2000. 2. The spatial coverage of the glacial lake inventory: Nepal 3. Contents of the glacial lake inventory: glacial lake code, glacial lake types, glacial lake area, distance between glacial lakes and the glaciers, related glaciers, etc. 4. Data Projection: Grid Zone IIA Projection: Lambert conformal conic Ellipsoid: Everest (India 1956) Datum: India (India, Nepal) False easting: 2743196.40 False northing: 914398.80 Central meridian: 90°00'00"E Central parallel: 26°00'00"N Scale factor: 0.998786 Standard parallel 1: 23°09'28.17"N Standard parallel 2: 28°49'8.18"N Minimum X Value: 1920240 Maximum X Value: 2651760 Minimum Y Value: 914398 Maximum Y Value: 1188720 Grid Zone IIB Projection: Lambert conformal conic Ellipsoid: Everest (India 1956) Datum: India (India, Nepal) False easting: 2743196.40 False northing: 914398.80 Central meridian: 90°00'00"E Central parallel: 26°00'00"N Scale factor: 0.998786 Standard parallel 1: 21°30'00"N Standard parallel 2: 30°00'00"N Minimum X Value: 1823188 Maximum X Value: 2000644 Minimum Y Value: 1306643 Maximum Y Value: 1433476 For a detailed data description, please refer to the data file and report.
2020-06-09 View Details

The source data of this data set are 1:1 million Chinese soil maps and 8,595 soil profiles from the second soil census.The data include section depth, soil thickness, sand, silt, clay, gravel, bulk density, porosity, soil structure, soil color, pH value, organic matter, nitrogen, phosphorus, potassium, exchangeable cation amount, exchangeable hydrogen, aluminum, calcium, magnesium, potassium, sodium ion and root amount.The dataset also provides data quality control information. The data is in raster format with a spatial resolution of 30 arc seconds.To facilitate the use of CLM model, soil data is divided into 8 layers, with the maximum depth of 2.3 meters (i.e. 0- 0.045, 0.045- 0.091, 0.091- 0.166, 0.166- 0.289, 0.289- 0.493, 0.493- 0.829, 0.829- 1.383 and 1.383- 2.296 m) Data file description: 1 Soil profile depth PDEP.nc 2 Soil layer depth "LDEP.nc LNUM.nc" 3 pH Value (H2O) PH.nc 4 Soil Organic Matter SOM.nc 5 Total N TN.nc 6 Total P TP.nc 7 Total K TK.nc 8 Alkali-hydrolysable N AN.nc 9 Available P AP.nc 10 Available K AK.nc 11 Cation Exchange Capacity (CEC) CEC.nc 12 Exchangeable H+ H.nc 13 Exchangeable Al3+ AL.nc 14 Exchangeable Ca2+ CA.nc 15 Exchangeable Mg2+ MG.nc 16 Exchangeable K+ K.nc 17 Exchangeable Na+ NA.nc 18 Particle-Size Distribution Sand SA.nc Silt SI.nc Clay CL.nc 19 Rock fragment GRAV.nc 20 Bulk Density BD.nc 21 Porosity POR.nc 22 Color (water condition unclear) Hue Unh.nc Value Chroma Unc.nc 23 Dry Color Hue Dh.nc Value Chroma Dc.nc 24 Wet Color Hue Wh.nc Value Chroma Wc.nc 25 Dominant and Second Structure S1.nc SW1.nc RS.nc 26 Dominant and Second Consistency C1.nc CW1.nc RC.nc 27 Root Abundance Description R.nc
2020-06-08 View Details
The frozen soil type map of Kazakhstan (1:10,000,000) includes three .shp vector layers: 1, Polyline ranges.shp, indicating the extent of frozen soil; 2, Polygon kaz_perm.shp, frozen soil; 3, An attribute description Word file. The kaz_perm attribute table includes four fields: ID, REGION, SUBREGION, M_RANGE. Comparison of the main attributes: First, Area I. Altai-TienShan Second, Region: High mountains I.1. Altai, I.2. Saur-Tarbagatai, I.3.Dzhungarskyi, I.4. Northern Tien Shan, I.5. Western Tien Shan Intermountain depressions I.6. Zaysanskyi, I.7. Alakulskyi, I.8. Iliyskyi II. Western Siberian Second, Region: Planes II.1. Northern Kazakhstanskyi V. Western Kazakhstanskaya III. Kazakh small hills area IV. Turanskaya: IV.1. Turgayskyi IV.2. Near Aaralskyi IV.3. Chuysko-Syrdaryinskyi IV.4. South-Balkhashskyi V. Western Kazakhstanskaya: V.1. Mugodzhar-Uralskyi V.2. Near Caspian V.3. manghyshlak-Ustyrtskyi Third, Sub-region: I.1.1. Western Altai I.1.2. South Altai I.1.3. Kalbinskyi I.2.1. Tarbagatayskyi I.2.2. Saurskyi I.3.1. Nortern Dzhungarskyi I.3.2. Western Dzhungarskyi I.3.3. Southern Dzhungarskyi I.4.1. Kirgizskyi Alatau I.4.2. Zailiyskyi-Kungeyskyi I.4.3. Ketmenskyi I.4.4. Bayankolskyi I.5.1. Karatauskyi I.5.2. Talaso-Ugamskyi The layer projection information is as follows: GEOGCS["GCS_WGS_1984", DATUM["WGS_1984", SPHEROID["WGS_1984", 6378137.0, 298.257223563]], PRIMEM["Greenwich", 0.0], UNIT["Degree",0.0174532925199433]] Different regions feature different frozen soil attributes, and the specific attribute information can be found in the Word file.
2020-06-04 View Details
This glacier inventory is supported by the International Centre for Integrated Mountain Development (ICIMOD) and the United Nations Environment Programme/Regional Resource Centre, Asia and The Pacific (UNEP/RRC-AP). 1.The glacier inventory incorporates topographic map data, and reflects the status of glaciers in the region in 2000. 2.The spatial coverage of the glacier inventory includes the following: Pa Chu Sub-basin,Mo Chu Sub-basin,Thim Chu Sub-basin,Pho Chu Sub-basin,Mangde Chu Sub-basin, Chamkhar Chu Sub-basin,Kuri Chu Sub-basin,Dangme Chu Sub-basin,Northern Basin, etc. 3.The glacier inventory includes the following data fields: glacier location, glacier code, glacier name, glacier area, glacier length, glacier thickness, glacier stocks, glacier type, glacier orientation, etc. 4.Data projection: Projection: Polyconic Ellipsoid: Everest (India 1956) Datum: Indian (India, Nepal) False easting: 2,743,196.4 False northing: 914,398.80 Central meridian: 90°0'00'' E Central parallel: 26°0'00' N Scale factor: 0.998786 For a detailed description of the data, please refer to the data file and report.
2020-06-04 View Details
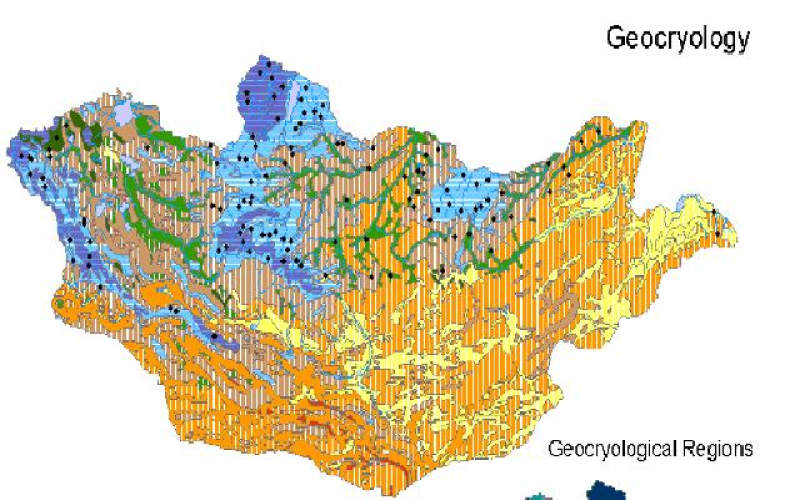
A map of the frozen soil distribution in the Republic of Mongolia is digitized from the National Atlas of the Republic of Mongolia (Sodnom and Yanshin, 1990). This data set describes the distribution and general properties of permafrost, seasonally frozen soil, and low-temperature phenomena in the Republic of Mongolia. Two plates were specifically digitized. The first plate, with a scale of 1:12,000,000, describes four general frozen soil regions: (1) continuous and discontinuous permafrost; (2) island-like and sparse island-like permafrost; (3) sporadic permafrost; and (4) seasonally frozen soil. The second plate, with a scale of 1:4,500,000, describes 14 different terrain types. The terrain types are divided based on elevation, annual average temperature, permafrost thickness, melting depth, and freezing depth of seasonally frozen soil. The locations of the six types of low-temperature phenomena in Mongolia are also included: pingos, ice cones, hot karst, detachment failures, solifluction, and cryoplatation processes. The data are provided in the ESRI shape file format and can be downloaded from the US Ice and Snow Data Center.
2020-06-04 View Details
This dataset is the spatial distribution map of the marshes in the source area of the Yellow River near the Zaling Lake-Eling Lake, covering an area of about 21,000 square kilometers. The data set is classified by the Landsat 8 image through an expert decision tree and corrected by manual visual interpretation. The spatial resolution of the image is 30m, using the WGS 1984 UTM projected coordinate system, and the data format is grid format. The image is divided into five types of land, the land type 1 is “water body”, the land type 2 is “high-cover vegetation”, the land type 3 is “naked land”, and the land type 4 is “low-cover vegetation”, and the land type 5 is For "marsh", low-coverage vegetation and high-coverage vegetation are distinguished by vegetation coverage. The threshold is 0.1 to 0.4 for low-cover vegetation and 0.4 to 1 for high-cover vegetation.
2020-06-04 View Details
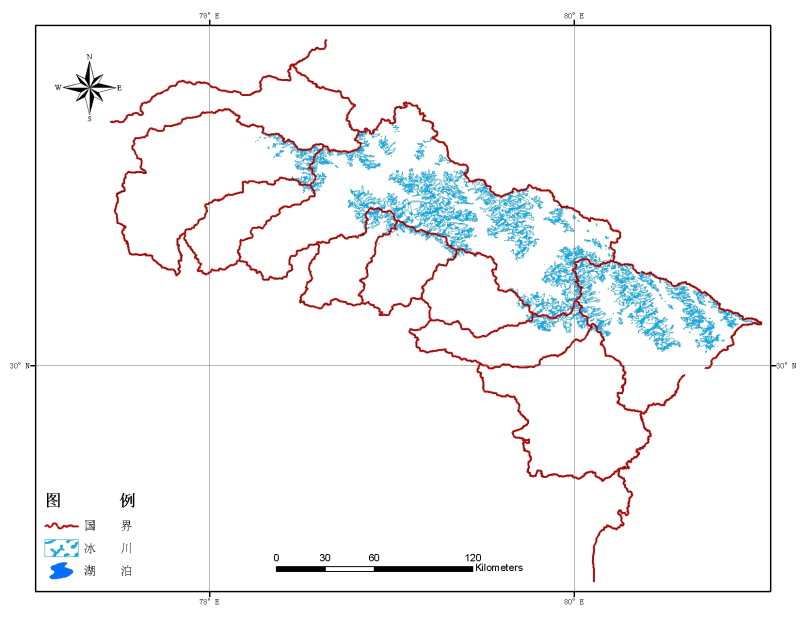
This glacial lake inventory receives joint support from the International Centre for Integrated Mountain Development (ICIMOD) and United Nations Environment Programme/Regional Resource Centre, Asia and the Pacific (UNEP/RRC-AP). 5. This glacial lake inventory referred to Landsat 4/5 (MSS and TM), SPOT(XS), IRS-1C/1D(LISS-III) and other remote sensing data. It reflects the current situation of glacial lakes with areas larger than 0.01 km2 in 2004. 6. Glacial Lake Inventory Coverage: Yamuna basin, Ravi basin, Chenab basin, Satluj River Basin and others. 7. The Glacial Lake Inventory includes glacial lake inventory, glacial lake type, glacial lake width, glacial lake orientation, glacial lake length from the glacier and other attributes. 8. Projection parameter: Projection: Albers Equal Area Conic Ellipsoid: WGS 84 Datum: WGS 1984 False easting: 0.0000000 False northing: 0.0000000 Central meridian: 82° 30’E Central parallel: 0° 0’ N Latitude of first parallel: 20° N Latitude of second parallel: 35° N For a detailed data description, please refer to the data file and report.
2020-06-04 View Details
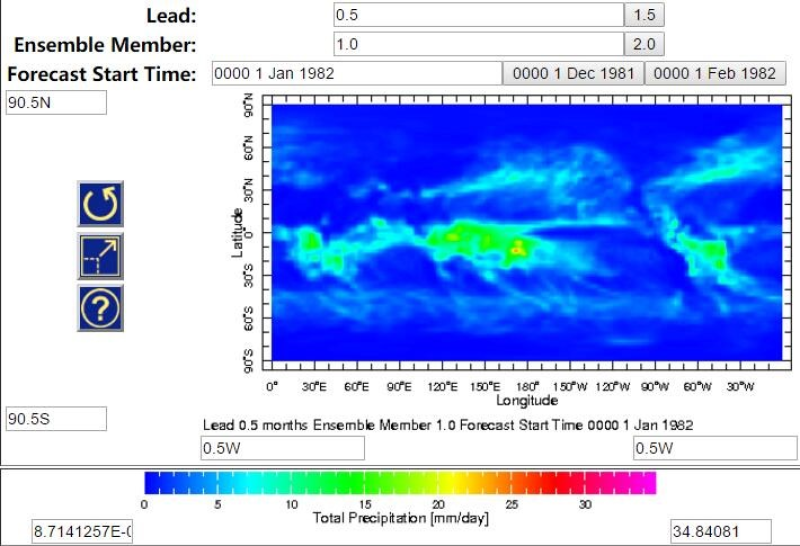
The North American Multi-Model Ensemble (NMME) Forecast is a multi-modal ensemble seasonal forecasting system jointly published by the US Model Center (including NOAA/NCEP, NOAA/GFDL, IRI, NCAR, and NASA) and the Canadian Meteorological Centre. The data include retrieval data from 1982 to 2010 and real-time weather forecast data from 2011 to the present. The forecasting system covers the whole world with a temporal resolution of one month and a horizontal spatial resolution of 1°. NMME has nine climate forecasting models, and each contains 6-28 ensemble members, with a forecasting period of 9-12 months. The name, source, ensemble members, and forecasting period of the climate models are as follows: 1) CMC1-CanCM3, Environment Canada, 10 models, 12 months 2) CMC2-CanCM4, Environment Canada, 10 models, 12 months 3) COLA-RSMAS-CCSM3, National Center for Atmospheric Research, 6 models, 12 months 4) COLA-RSMAS-CCSM34, National Center for Atmospheric Research, 10 models, 12 months 5) GFDL-CM2p1-aer04, NOAA Geophysical Fluid Dynamics Laboratory, 10 models, 12 months 6) GFDL-CM2p5-FLOR-A06, NOAA Geophysical Fluid Dynamics Laboratory, 12 models, 12 months 7) GFDL-CM2p5-FLOR-B01, NOAA Geophysical Fluid Dynamics Laboratory, 12 models, 12 months 8) NASA-GMAO-062012, NASA Global Modeling and Assimilation Office, 12 models, 9 months 9) NCEP-CFSv2, NOAA National Centers for Environmental Prediction, 24/28 models, 10 months With the exception of the CFSv2 model (which includes only precipitation and average temperature), the variables of other models include precipitation, average temperature, maximum temperature, and minimum temperature. Each model ensemble member stores one NC file every month for each variable. The meteorological elements, variable names, units, and physical meanings of each variable are as follows: 1) Average temperature, tref, K, monthly average near-surface (2-m) average air temperature 2) Maximum temperature, tmax, K, monthly average near-surface (2-m) maximum air temperature 3) Minimum temperature, tmin, K, monthly average near-surface (2-m) minimum air temperature 4) Precipitation, prec, mm/day, monthly average precipitation. The dataset has been widely applied in climate forecasting, hydrological forecasting, and quantitatively estimating model forecasting uncertainty.
2020-06-03 View Details
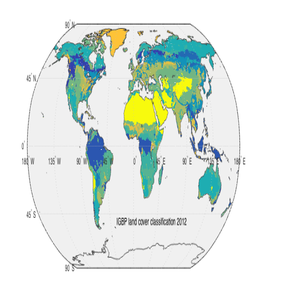
The MODIS land cover type product is a data classification product (MOD12Q1) with different classification schemes for land cover features extracted from Terra data each year. These data are generated by reprojecting the standard MODIS land cover product MOD12Q1 to geographic coordinates with a spatial resolution of one-half degree. The basic land cover classification comprises the 17 types defined by the International Geosphere Biosphere Programme (IGBP): 11 types of natural vegetation classification, 3 types of land use and land inlays, and 3 types of nonvegetation land classification. It covers a longitude range of -180-180 degrees and a latitude range of -64-84 degrees. The data are in GeoTIFF format. This data are free to use, and the copyright belongs to the University of Maryland Department of Geography and NASA.
2020-06-03 View Details
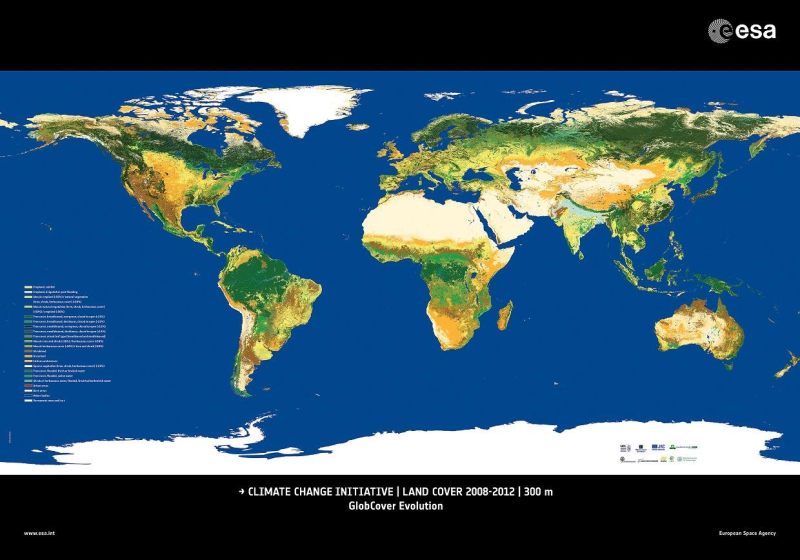
The land cover classification product is the second phase product of the ESA Climate Change Initiative (CCI), with a spatial resolution of 300 meters and a temporal coverage of 1992-2015. The spatial coverage is latitude -90-90 degrees, longitude -180-180 degrees, and the coordinate system is the geographic coordinate WGS84. The classification of the surface coverage is based on the Land Cover Classification System (LCCS) of the Food and Agriculture Organization of the United Nations. When the data are used for scientific research purposes, the ESA CCI Land Cover project should be acknowledged. In addition, the published article should be send to contact@esalandcover-cci.org.
2020-06-03 View Details
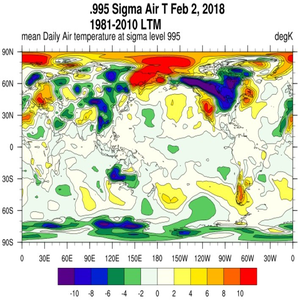
NCEP/NCAR Reanalysis 1 is an assimilation of data from the past (1948-recent). It was developed by the National Centers for Environmental Prediction-National Center for Atmospheric Research (NCEP–NCAR) in the US to act as an advanced analysis and prediction system. Most of the data are from the original daily average data of the PSD (Physical Sciences Division). However, the data from 1948 to 1957 are slightly different because these data are conventional (non-Gaussian) grid data. The information published on the official website is generally from 1948 to the present, and the latest information is generally updated every two days. For data on an isostatic surface, the general vertical resolution is 17 layers, from 1000 hPa to 10 hPa. The horizontal resolution is typically 2.5° x 2.5°. The NCEP reanalysis data are systematically comparable among international atmospheric science reanalysis data sets. Compared with the reanalysis data of the European Center, the initial year is earlier, and the latest data updates are more frequent. These two sets of reanalysis data are currently the most widely used data sets in the world. For details of the data, please visit the following website: https://www.esrl.noaa.gov/psd/data/gridded/data.ncep.reanalysis.html
2020-06-03 View Details
The Randolph Glacier Inventory (RGI) is a complete inventory of global glacier outlines published by GLIMS (Global Land Ice Measurements from Space). It is currently available in six versions: Version 1.0 was published in February 2012, version 2.0 was published in June 2012, version 3.0 was published in April 2013, version 4.0 was published in December 2014, version 5.0 was published in July 2015, and version 6.0 was published in July 2017. The data sets include four versions, which are 6.0, 5.0, 4.0 and 3.2 (revision, August 2013). The data are organized according to different regions. In each region, each glacier record includes a shape file (.shp file and its corresponding .dbf, .prj, and .shx files) and a .csv file of height measurement data. The data are from GLIMS: Global Land Ice Measurements from Space (http://www.glims.org/RGI/) Data quality checks include geometry, topology, and certain attributes, and the following checks were performed: 1) All polygons were checked by the ArcGIS Repair Geometry tool. 2) Glaciers with areas less than 0.01 square kilometres were removed. 3) The topology was checked with the Does Not Overlap rule. 4) The attribute sheet was checked by Fortran subroutines and Python scripts for data quality.
2020-06-03 View Details
Contact Support
Links
National Tibetan Plateau Data CenterFollow Us

A Big Earth Data Platform for Three Poles © 2018-2020 No.05000491 | All Rights Reserved
|  No.11010502040845
Tech Support: westdc.cn