
Brief Introduction:The Tibetan Plateau, known as the " third pole " of the earth, has always been the focus of attention of the international community because it is an important area driving global environmental change research and has a profound regulatory effect on the ecology, environment and climate of the whole earth. Under the background of global warming, the cryosphere elements such as tripolar glaciers, frozen soils, and freeze-thaw lakes have undergone significant changes, with glaciers shrinking rapidly and permafrost active layers thickening. For a long time, China has carried out systematic and multidisciplinary research in the world ' s third pole with the Qinghai-Tibet Plateau as the main body, forming a rich research accumulation.
Publish Datetime:2022-12-13
Number of Datasets:184
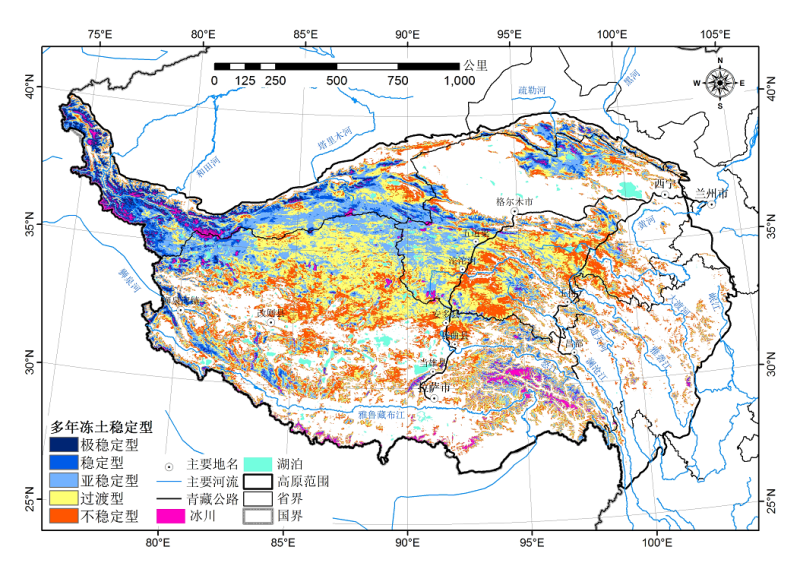
The past frozen soil map of the Tibetan Plateau was based on a small number of temperature station observations and used a classification system based on continuity. This data set used the geographically weighted regression model (GWR) to synthesize MODIS surface temperature, leaf area index, snow cover ratio and multimodel soil moisture forecast products of the National Meteorological Information Center through spatiotemporal reconstruction. In addition, precipitation observations of more than 40 meteorological stations, the precipitation products of FY2 satellite observations and the multiyear average temperature observation data of 152 meteorological stations from 2000 to 2010 were integrated to simulate the average temperature data of the Tibetan Plateau, and the permafrost thermal condition classification system was used to classify permafrost into several types: Very cold, Cold, Cool, Warm, Very warm, and Likely thawing. The map shows that, after deducting lakes and glaciers, the total area of permafrost on the Tibetan Plateau is approximately 1,071,900 square kilometers. Verification shows that this map has higher accuracy. It can provide support for future planning and design of frozen soil projects and environmental management.
2020-04-29 View Details
Taking 2005 as the base year, the future population scenario prediction adopted the Logistic model of population, and it not only can better describe the change pattern of population and biomass but is also widely applied in the economic field. The urbanization rate was predicted using the urbanization Logistic model. Based on the existing urbanization horizontal sequence value, the prediction model was established by acquiring the parameters in the parametric equation applying nonlinear regression. The urban population was calculated by multiplying the predicted population by the urbanization rate. The Logistic model was used to predict the future gross national product of each county (or city), and then, according to the economic development level of each county (or city) in each period (in terms of real GDP per capita),the corresponding industrial structure scenarios in each period were set, and each industry’s output value was predicted. The trend of changes in industrial structure in China and the research area lagged behind the growth of GDP, and, therefore, it was adjusted according to the need of the future industrial structure scenarios of the research area.
2020-04-28 View Details
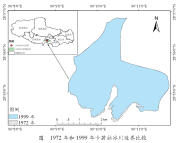
The Karuola Glacier of Tibet is located at the junction of Langkazi County, the Shannan Area of the Tibetan Autonomous Region and Jiangzi County of the Shigatse Region. Latitude: 28°54'23.30′′~28°56'50.95′′N, Longitude 90°11′42.21′′~90°09′26.23′′E. It is a continental glacier with an average elevation of 5042 meters. It is the north-south spreading part of the Ningjingangsang peak. Based on the integration of the first glacier inventory data of China from the Cold and Arid Regions Environmental and Engineering Research Institute,Chinese Academy of Sciences, the 1:100,000 inventory data of the Yarlu Zangbu River Basin Glacier from the Sharing Platform for the Earth Systematic Science Data, and Google Earth remote sensing image and field survey data, the dataset was obtained with the help of ArcGIS, ENVI and other software by the following steps: first, the research and development of the data was achieved by band combination, research area clipping, manual visual interpretation and other techniques, and the accuracy of the obtained data was then verified. This dataset includes a total of 25 statistics of vector and area data of Tibet’s Karuola Glacier. It recorded the changes at the borders of Karuola Glacier in the past 45 years and could be used as reference data for the study of glacier and climate changes on the Tibetan Plateau.
2020-04-28 View Details
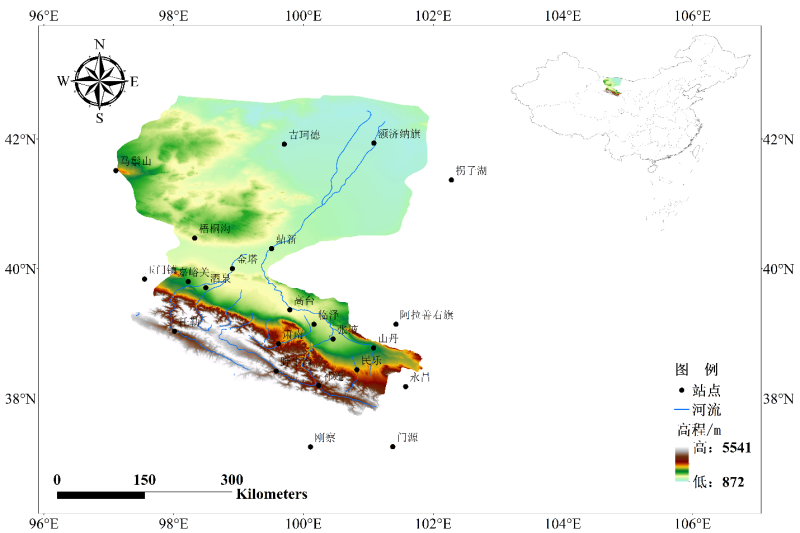
By applying Supply-demand Balance Analysis, the water resource supply and demand of the whole river basin and each county or district were calculated, based on which the vulnerability of the water resources system of the basin was evaluated. The IPAT equation was used to set a future water resource demand scenario, setting variables such as future population growth rate, economic growth rate, and unit GDP water consumption to establish the scenario. By taking 2005 as the base year and using assorted forecasting data of population size and economic scale, the future water demand scenarios of various counties and cities from 2010 to 2050 were forecast. By applying the basic structure of the HBV conceptual hydrological model of the Swedish Hydrometeorological Institute, a model of the variation tendency of the basin under climate change was designed. The glacial melting scenario was used as the model input to construct the runoff scenario under climate change. According to the national regulations of the water resources allocation of the basin, a water distribution plan was set up to calculate the water supply comprehensively. Considering of the supply and demand situation, the water resource system vulnerability was evaluated by the water shortage rate. By calculating the (grain production) land pressure index of the major counties and cities in the basin, the balance of supply and demand of land resources under the climate change, glacial melt and population growth scenarios was analyzed, and the vulnerability of the agricultural system was evaluated. The Miami formula and HANPP model were used to calculate the human appropriation of net primary biomass and primary biomass in the major counties and cities for the future, and the vulnerability of ecosystems from the perspective of supply and demand balance was assessed.
2020-04-28 View Details
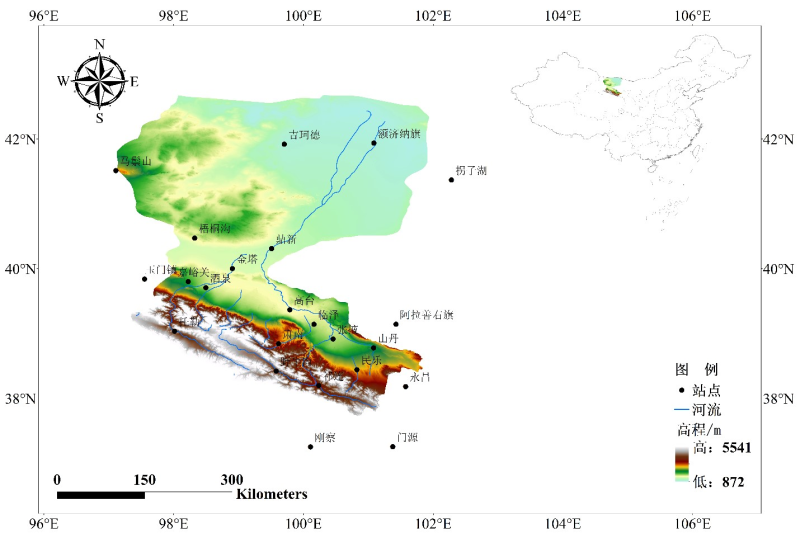
Taking 2000 as the base year, the future population scenario prediction adopted the Logistic model of population, and it not only can better describe the change pattern of population and biomass but also is widely applied in the economic field. The urbanization rate was predicted using the urbanization Logistic model. Based on the existing urbanization horizontal sequence value, the prediction model was established by acquiring the parameters in the parametric equation applying nonlinear regression. The urban population was calculated by multiplying the predicted population by the urbanization rate. The Logistic model was used to predict the future gross national product of each county (or city), and then, according to the economic development level of each county (or city) in each period (in terms of real GDP per capita), the corresponding industrial structure scenarios in each period were set, and the output value of each industry was predicted. The trend of industrial structure changing in China and the research area lagged behind the growth of GDP, so it was adjusted according to the need of the future industrial structure scenarios of the research area.
2020-04-28 View Details
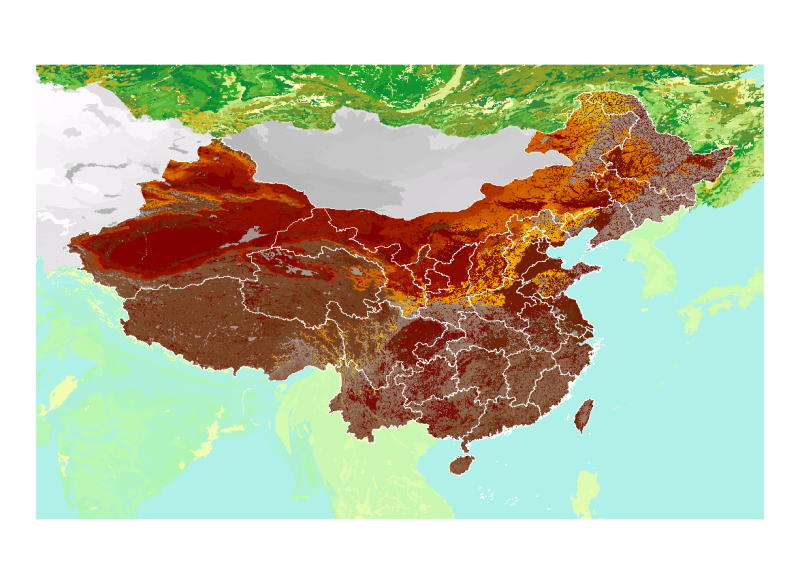
The data is based on the Harmonized World Soil Database version 1.1 (HWSD) constructed by the Food and Agriculture Organization of the United Nations (FAO) and the Vienna International Institute for Applied Systems (IIASA). The data source of China is 1: 1 million soil data in the second national land survey provided by the Nanjing Soil Research Institute. The data can provide model input parameters for modelers, in agricultural perspective, it can be used to study eco-agricultural zoning, food security and climate change. The data format is grid and the projection is WGS84. The soil classification system used is mainly FAO-90. The main fields of the soil property table include: SU_SYM90 (the soil name in the FAO90 soil classification system); SU_SYM85 (FAO85 classification); T_TEXTURE (top soil texture); DRAINAGE (19.5); REF_DEPTH (soil reference depth); AWC_CLASS (19.5); AWC_CLASS (soil effective water content); PHASE1: Real (soil phase); PHASE2: String (soil phase); ROOTS: String (depth classification with obstacles to the bottom of the soil); SWR: String (soil moisture characteristics); ADD_PROP: Real (a specific soil type related to agricultural use in the soil unit); T_GRAVEL: Real (gravel volume percentage); T_SAND: Real (sand content); T_SILT: Real (silt content); T_CLAY: Real (clay content); T_USDA_TEX: Real (USDA soil texture classification); T_REF_BULK: Real (soil bulk density); T_OC: Real (organic carbon content); T_PH_H2O: Real (pH) T_CEC_CLAY: Real (cation exchange capacity of clay soil); T_CEC_SOIL: Real (cation exchange capacity of soil) T_BS: Real (basic saturation); T_TEB: Real (exchangeable base); T_CACO3: Real (carbonate or lime content) T_CASO4: Real (sulfate content); T_ESP: Real (exchangeable sodium salt); T_ECE: Real (conductivity). The attribute field beginning with T_ indicates the upper soil attribute (0-30cm), and the attribute field beginning with S_ indicates the lower soil attribute (30-100cm). For the meaning of specific attribute values, please refer to the documentation * .pdf and database * .mdb in the folder.
2020-03-26 View Details
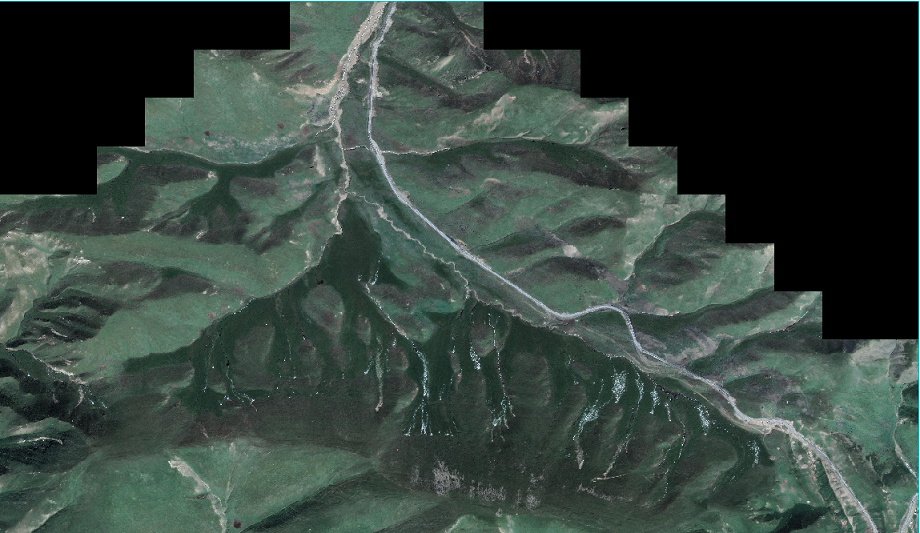
Global warming and human activities have led to the degradation of permafrost and the collapse of permafrost, which have seriously affected the construction of permafrost projects and the ecological environment. Based on high-resolution satellite images, the permafrost of oboling in Heihe River Basin of Qinghai Tibet Plateau is taken as the research area, and the object-oriented classification technology of machine learning is used to extract the thermal collapse information in the research area. The results show that from 2009 to 2019, the number of thermal collapse increased from 12 to 16, and the total area increased from 14718.9 square meters to 28579.5 square meters, nearly twice. The combination of high spatial resolution remote sensing and object-oriented classification method has a broad application prospect in the monitoring of thermal thawing and collapse of frozen soil.
2020-03-14 View Details
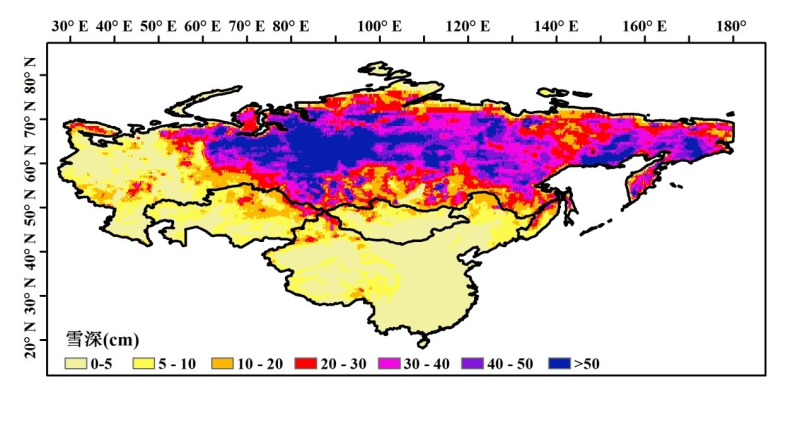
The “long-term series of daily snow depth in Eurasia” was produced using the passive microwave remote sensing data. The temporal range is 1980~2016, and the coverage is the Eurasia continent. The spatial resolutions is 0.25° and the temporal resolution is daily. A dynamic brightness temperature gradient algorithm was used to derive snow depth. In this algorithm, the spatial and temporal variations of snow characteristics were considered and the spatial and seasonal dynamic relationships between the temperature difference between 18 GHz and 36 GHz and the measured snow depth were established. The long-term sequence of satellite-borne passive microwave brightness temperature data used to derive snow depth came from three sensors (SMMR, SSM/I and SSMI/S), and there is a certain system inconsistency among them. So, the inter-sensor calibration was performed to improve the temporal consistency of these brightness temperature data before snow depth derivation. The accuracy analysis shows that the relative deviation of Eurasia snow depth data is within 30%. The data are stored as a txt file every day, each file includes a file header (projection mode) and a 720*332 snow depth matrix, and each snow depth represents a 0.25°*0.25° grid. For details of the data, please refer to data specification “Snow depth dataset of Eurasian (Version 1.0) (1980-2016).doc”
2020-03-13 View Details
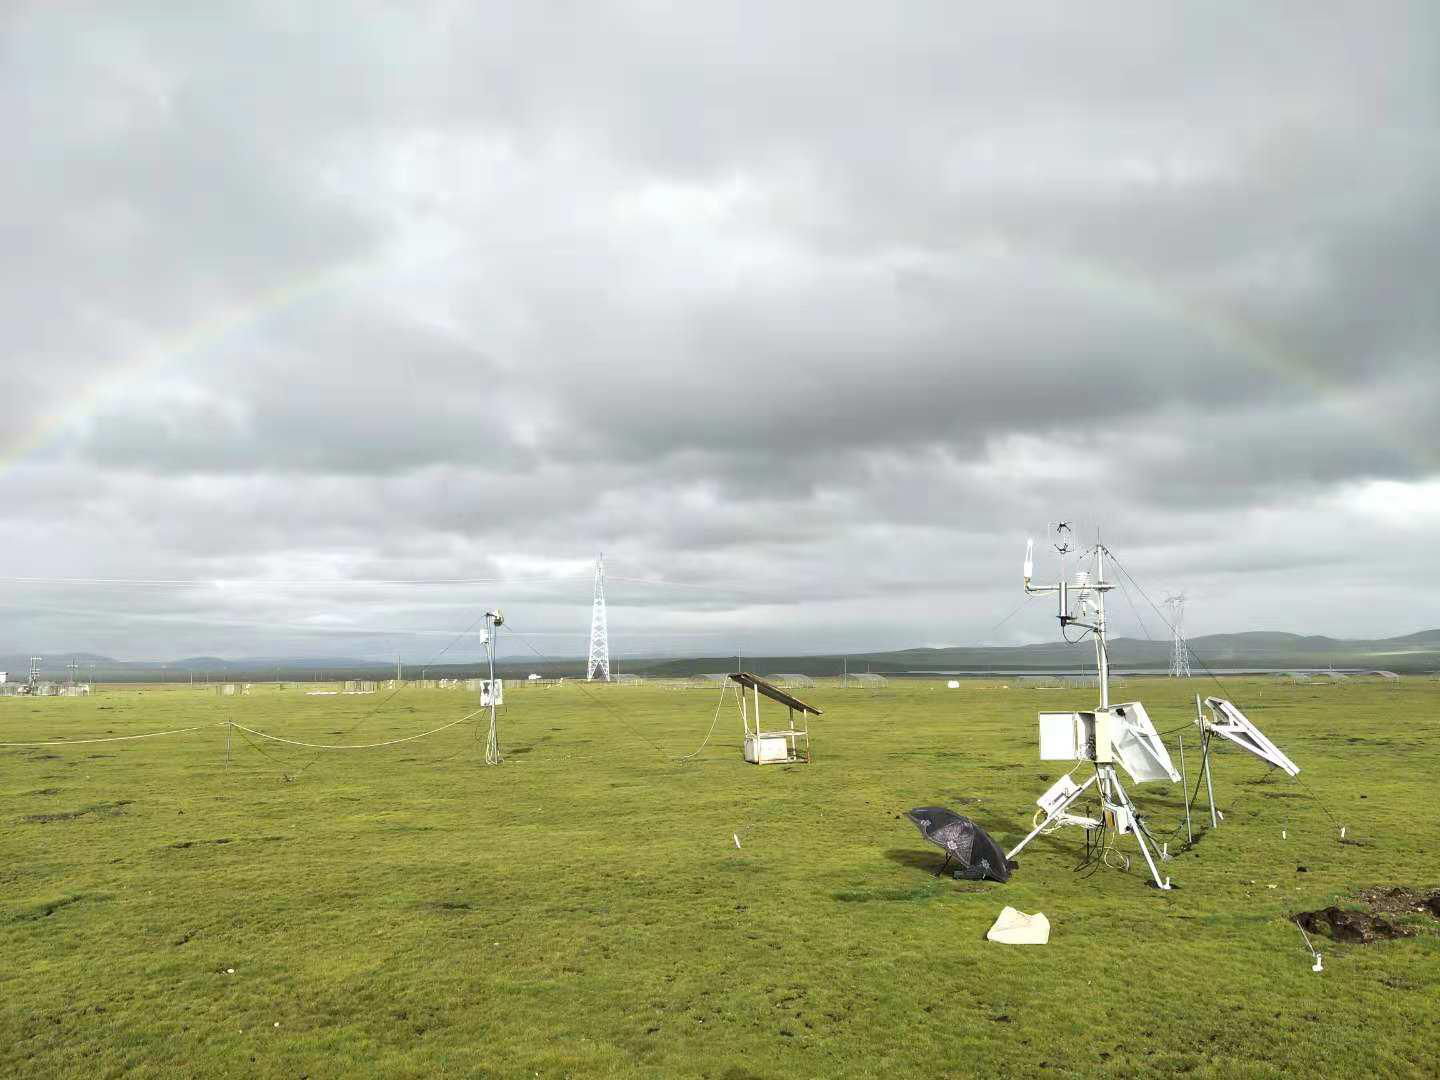
The dataset is a 30-minute eddy covariance flux observation data from nine flux stations in the Three Poles, including the data of ecosystem Net Carbon Exchange (NEE), Gross Primary Productivity(GPP), and Ecosystem Respiration (ER) . The time coverage of the data is from 2000 to 2016. The main steps of data pre-processing include outlier removal (±3σ), coordinate axis rotation(three-dimensional wind rotation), Webb-Pearman-Leuning correction, outlier elimination, carbon flux interpolation and decomposition. And missing data is interpolated by the nonlinear empirical formula between CO2 flux value(Fc) and environmental factors.
2020-01-19 View Details
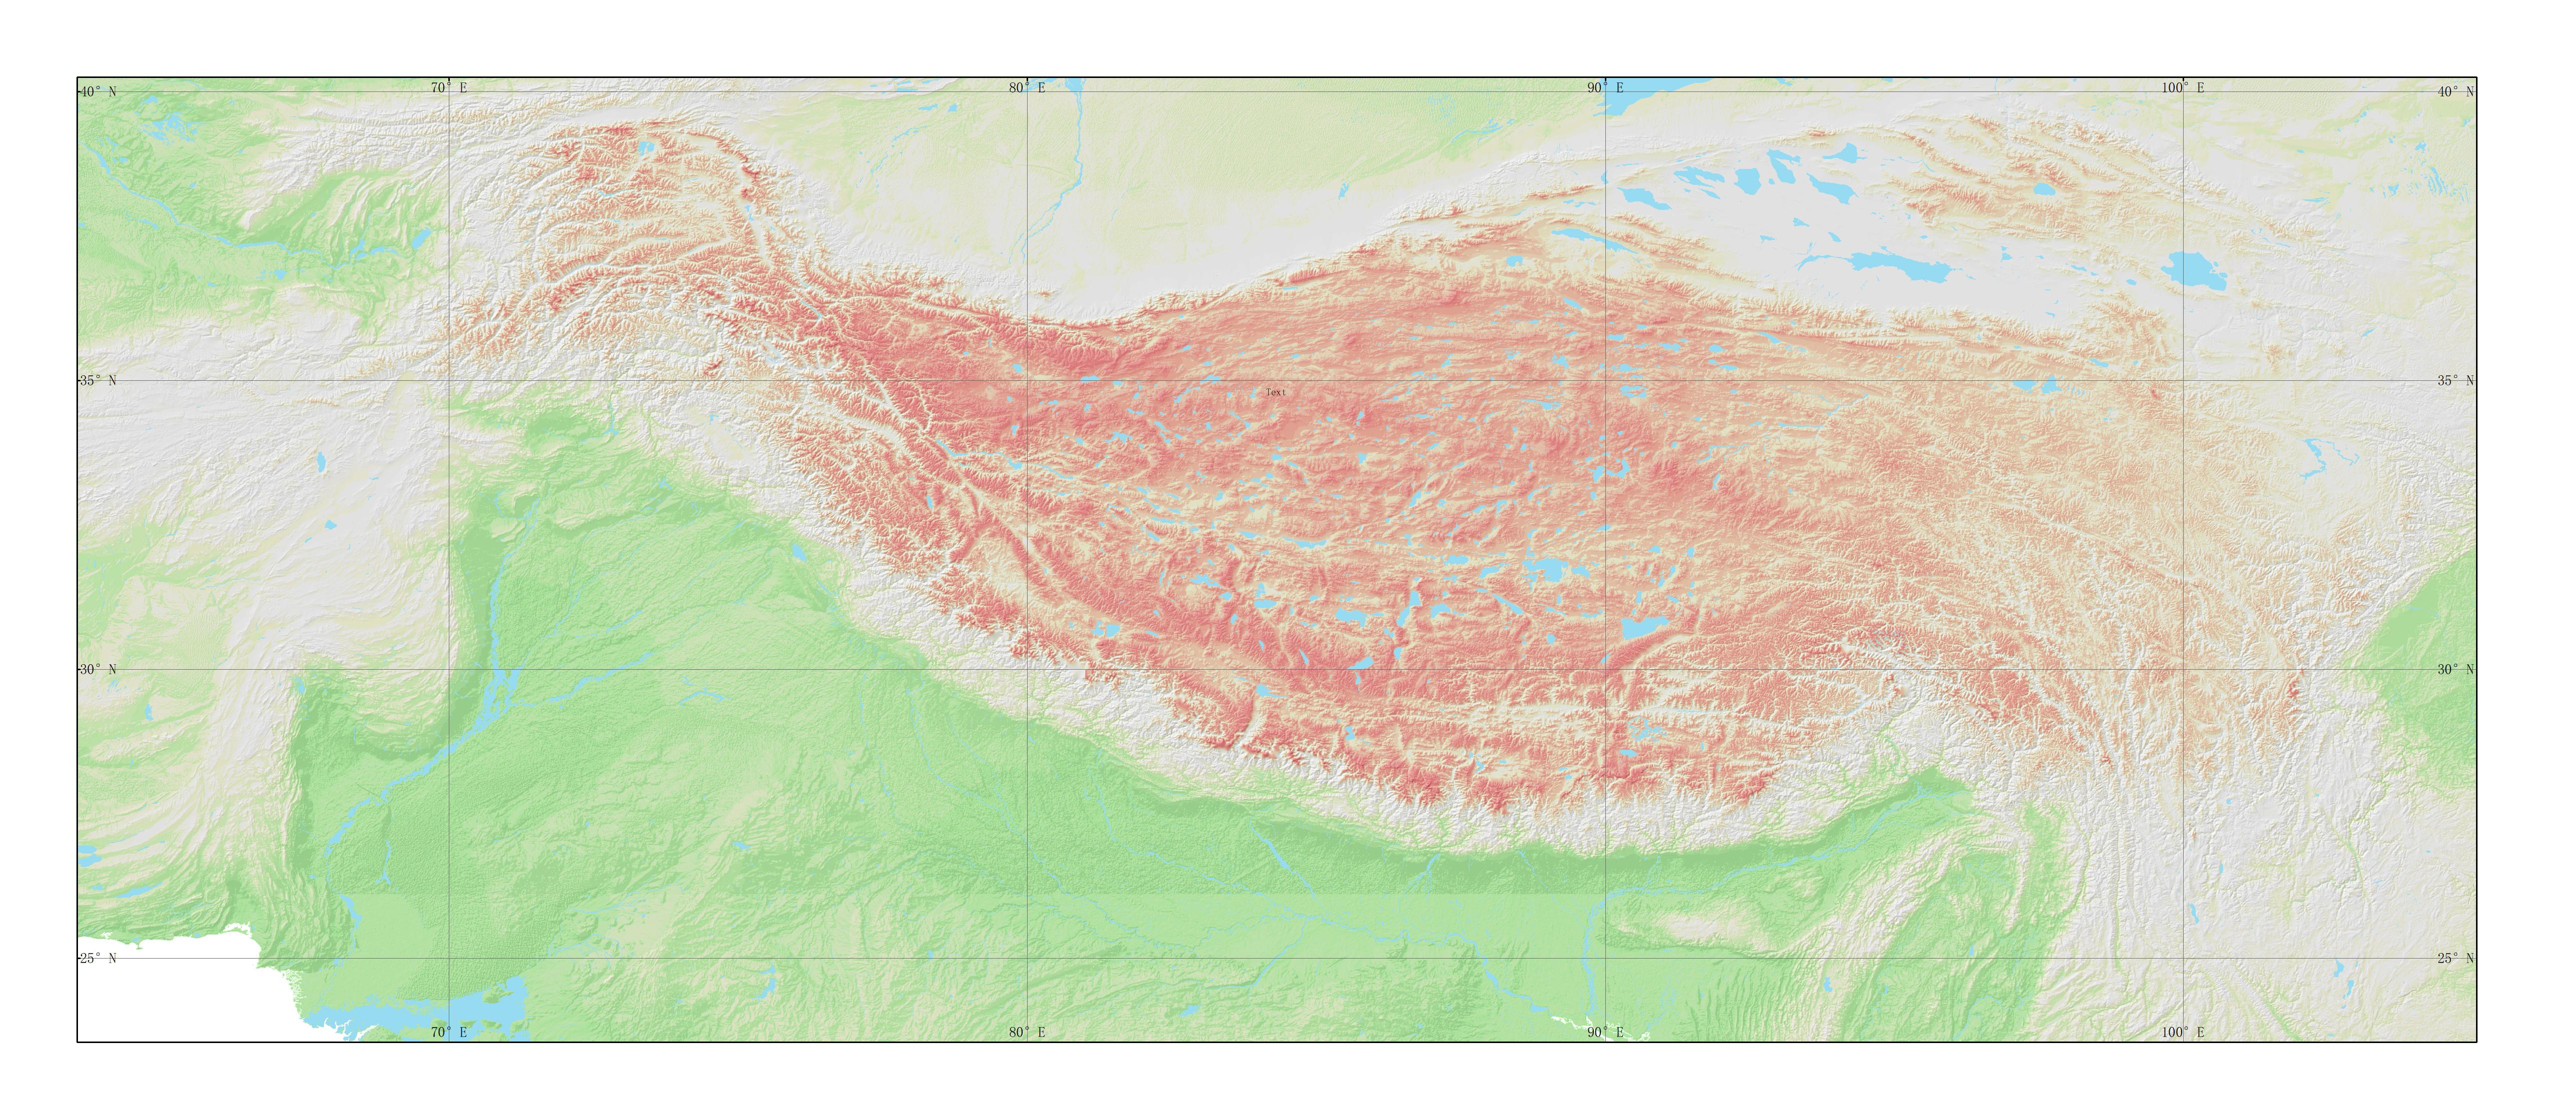
Digital Elevation Model (DEM) is a kind of solid ground Model that represents the ground Elevation in the form of a set of ordered numerical arrays. The third pole region of40°1′52″N~23°11′59″N、105°43′45″E~61°28′45″E of the roof of the world ecological geographic area,These include the qinghai-tibet plateau, the hengduan mountains, the Himalayas, the Hindu kush mountains and the pamirs plateau.Classified according to:At 4000 m altitude as a benchmark, the fusion of slope, reference mountain integrity and ecological system integrity, the spatial resolution of 0.008 ° x 0.008 °
2020-01-18 View Details
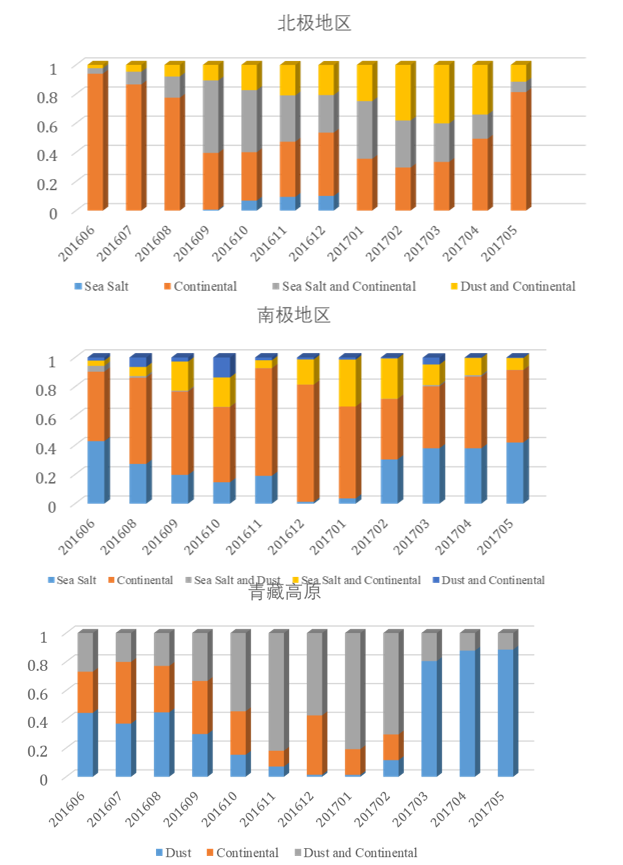
The three pole aerosol type data product is an aerosol type result obtained by integrating the data assimilation of Meera 2 and the active satellite CALIPSO product through a series of data preprocessing, quality control, statistical analysis and comparative analysis. The key of this algorithm is to judge the type of CALIPSO aerosol. In the process of aerosol type data fusion, according to the type and quality control of CALIPSO aerosol, and referring to the type of merra 2 aerosol, the final aerosol type data (12 kinds in total) and quality control results in the three pole area are obtained. The data product fully considers the vertical distribution and spatial distribution of aerosols, with high spatial resolution (0.625 ° × 0.5 °) and time resolution (month).
2020-01-18 View Details
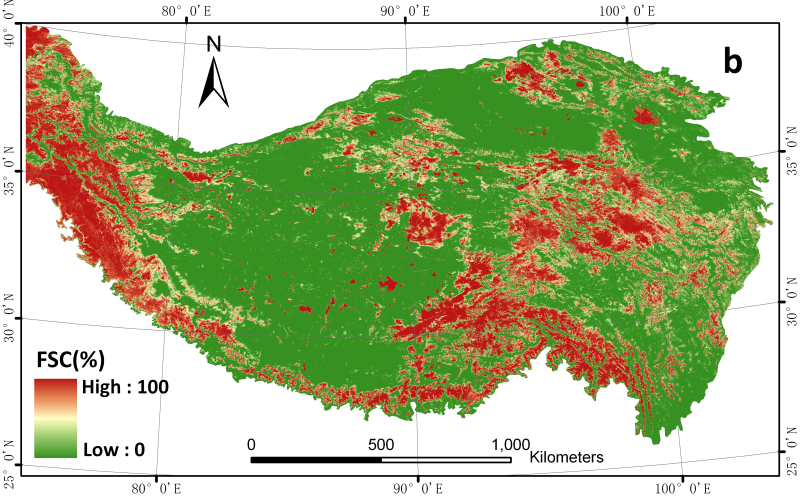
The daily cloudless MODIS Snow area ratio data set (2000-2015) of the Qinghai Tibet Plateau is based on MODIS daily snow product - mod10a1, which is obtained by using a cloud removal algorithm based on cubic spline interpolation. The data set is projected by UTM with spatial resolution of 500m, providing daily snow cover FSC results in the Tibetan Plateau. The data set is a day-to-day document, from 24 February 2000 to 31 December 2015. Each file is the result of snow area proportion on that day, the value is 0-100%, which is envi standard file, the naming rule is: yyyddd_fsc_0.5km.img, where yyyy represents the year, DDD represents Julian day (001-365 / 366). Files can be opened and viewed directly with envi or ArcMap. The original MODIS Snow data product for cloud removal comes from the mod10a1 product processed by the National Snow and Ice Data Center (NSIDC). This data set is in the format of HDF and uses the sinusional projection. The attributes of the daily cloudless MODIS Snow area ratio data set (2000-2015) on the Qinghai Tibet Plateau consist of the spatial-temporal resolution, projection information and data format of the data set. Temporal and spatial resolution: the temporal resolution is day by day, the spatial resolution is 500m, the longitude range is 72.8 ° ~ 106.3 ° e, and the latitude is 25.0 ° ~ 40.9 ° n. Projection information: UTM projection. Data format: envi standard format. File naming rules: "yyyyddd" + ". Img", where yyyy stands for year, DDD stands for Julian day (001-365 / 366), and ". Img" is the file suffix added for easy viewing in ArcMap and other software. For example, 2000055 ﹐ FSC ﹐ 0.5km.img represents the result on the 55th day of 2000. The envi file of this data set is composed of header file and body content. The header file includes row number, column number, band number, file type, data type, data record format, projection information, etc.; take 2000055 ﹣ FSC ﹣ 0.5km.img file as an example, the header file information is as follows: ENVI Description = {envi file, created [sat APR 27 18:40:03 2013]} Samples = 5760 Lines = 3300 Bands = 1 Header offset = 0 File type = envi standard Data type = 1: represents byte type Interleave = BSQ: data record format is BSQ Sensor type = unknown Byte order = 0 Map Info = {UTM, 1.500, 1.500, - 711320.359, 4526650.881, 5.0000000000e + 002, 5.0000000000e + 002, 45, north, WGS-84, units = meters} Coordinate system string = {projcs ["UTM [u zone [45N], geocs [" GCS [WGS [1984], data ["d [WGS [1984", organization ID ["WGS [1984", 6378137.0298.257223563]], prime ["Greenwich", 0.0], unit ["degree", 0.01745532925199433]]] project ["transfer [Mercator"]] parameter ["false [easting", 500000.0], parameter ["false [easting", 500000.0], parameter [500000.0], parameter [500000.0], parameter [false [false [easting ", 500000.0], parameter], parameter [500000.0], parameter [500000.0], parameter [500000.0], parameter [false [easting", 500000.0], parameter [500000.0], parameter [500000.0], parameter [500000.0], parameter ["false_northing", 0.0], parameter ["central_meridian", 87.0], parameter ["scale" _Factor ", 0.9996], parameter [" latitude ﹣ of ﹣ origin ", 0.0], unit [" meter ", 1.0]]} Wavelength units = unknown, band names = {2000055}
2020-01-16 View Details
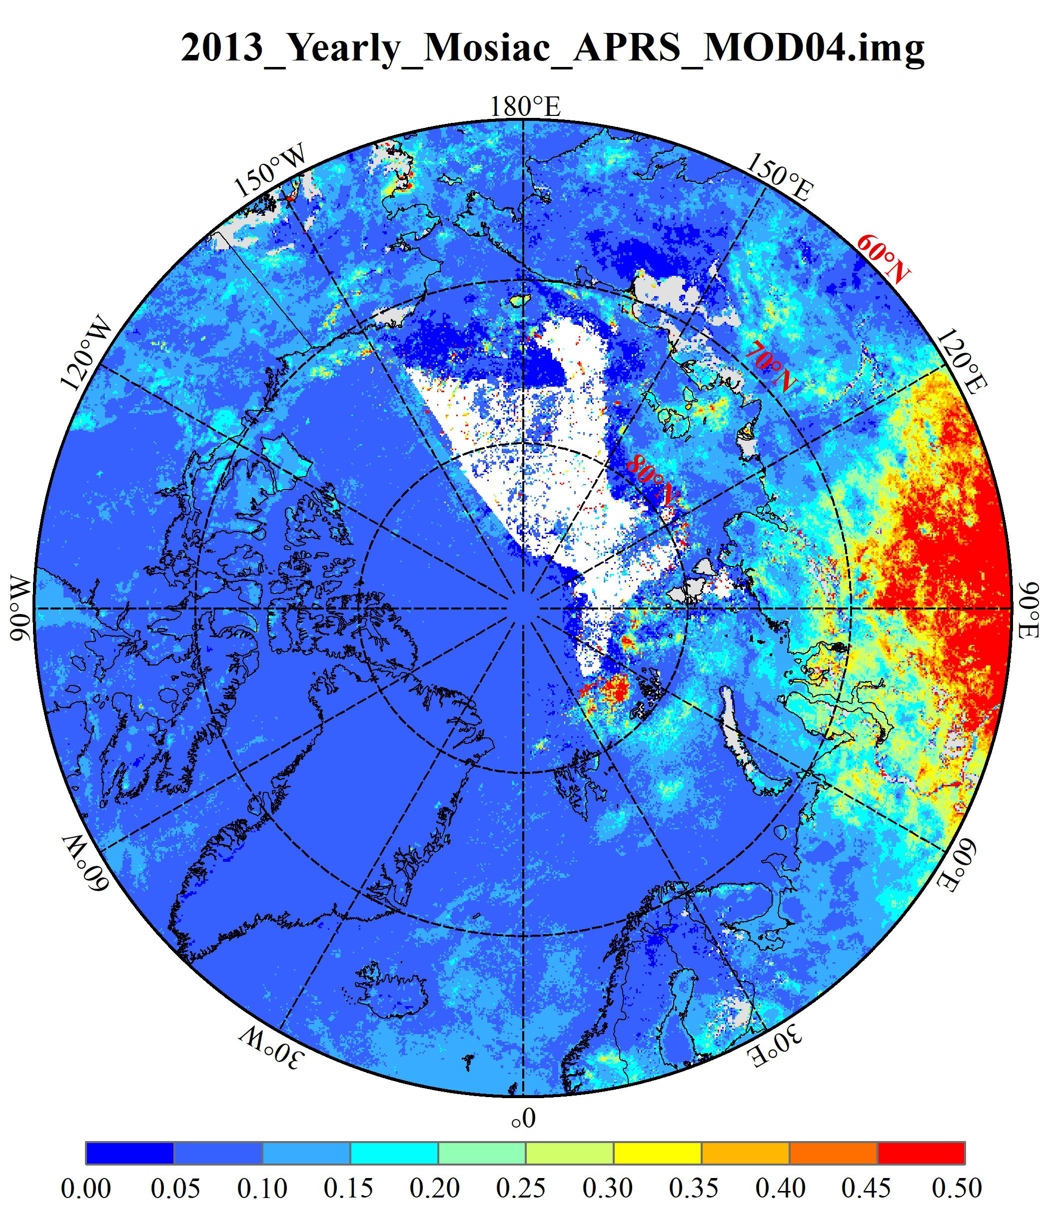
The "poles AOD Collection 1.0" aerosol optical thickness (AOD) data set adopts the self-developed visible band remote sensing inversion method, combined with the merra-2 model data and the official NASA product mod04. The data covers from 2000 to 2019, with the time resolution of day by day, covering the "three poles" (Antarctic, Arctic and Qinghai Tibet Plateau) area, and the spatial resolution of 0.1. Degree. The inversion method mainly uses the self-developed APRs algorithm to invert the aerosol optical thickness over ice and snow. The algorithm considers the BRDF characteristics of ice and snow surface, and is suitable for the inversion of aerosol optical thickness over ice and snow. The experimental results show that the relative deviation of the data is less than 35%, which can effectively improve the coverage and accuracy of the aerosol optical thickness in the polar region.
2020-01-12 View Details
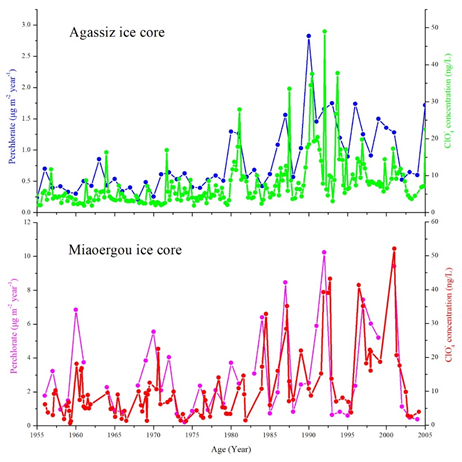
This data was reconstructed based on the history of perchlorate from 1956 to 2004 in Miaoergou ice core (94°19 'E,43°03 'N, 4518 m) in east Tianshan mountain. Data content: perchlorate from 1956 to 2004 (including: Cl-, NO3- and SO42-). Data was measured by ESI-MS/MS; Data quality: the blank sample was significantly lower than the sample values, and the quality was good. Data application result and prospect: The data has been published, the detailed information can be found in the published paper. Zhiheng Du, Cunde Xiao, Vasile I. Furdui C,Wangbin Zhang. (2019). The perchlorate record during 1956–2004 from Tienshan ice core, East Asia. Science of the Total Environment. Time range and resolution: 1956-2004 AD, and annual resolution.
2020-01-12 View Details
These data are a digitization of the frozen soil distribution map of the Map of the Glaciers, Frozen Ground and Deserts in China (1:4,000,000). Considering the unification with the global frozen soil classification system, the permafrost is divided into the following five types: (1) Discontinuous permafrost: continuous coefficient 50%-90% (2) Island permafrost: continuous coefficient <50% (3) Plateau discontinuous permafrost: continuous coefficient 50%-90% (4) Plateau island permafrost: continuous coefficient 50%-90% (5) Mountain permafrost The compilation basis of the frozen soil map includes (1) the measured field survey data and exploration of frozen soil; (2) aerial image and satellite image interpretation; (3) TOPO30 1-km resolution ground elevation data; and (4) and temperature and ground temperature data. The distribution of frozen soil on the Tibetan Plateau adopted the research results of Zhuotong Nan et al. (2002). Using the average annual temperature data of 76 boreholes along the Qinghai-Tibet Highway, a statistical regression analysis was performed to obtain the relation between annual mean ground temperature, latitude and elevation. Based on the relation combined with GTOPO30 elevation data (global 1-km digital elevation model data developed by the Earth Resources Observation and Technology Center of the U.S Geological Survey), the annual average ground temperature distribution over the entire Tibetan Plateau was simulated. Taking the annual average ground temperature of 0.5 °C as the boundary between permafrost and seasonal frozen soil and the Map of Snow Ice and Frozen Ground in China (1:4,000,000) (Yafeng Shi, et al., 1988) as a reference, the boundary between the plateau discontinuous permafrost and plateau island permafrost was determined. In addition, taking the Distributions Map of Permafrost in Daxiao Hinganling Northeast China (Dongxin Guo, et al. 1981), the Distribution Map of Permafrost and Ground Ice in Circum-Arctic (Brown et al. 1997) and the latest field data as references, the permafrost boundary of northeast China has been revised; the mountain permafrost boundary in the northwest mostly adopted the boundary delineated in the Map of Snow Ice and Frozen Ground in China (1:4,000,000) (Yafeng Shi, et al., 1988). According to this data set, permafrost area in China is approximately 1.75×10⁶ km2, accounting for 18.25% of the territory of China, among which the mountain permafrost area is 0.29×10⁶ km2, which accounts for 3.03% of the territory of China. For more information, please refer to the Map of the Glaciers, Frozen Ground and Deserts in China (1:4,000,000) specification (Cold and Arid Regions Environmental and Engineering Research Institute, Chinese Academy of Sciences, 2006).
2020-01-11 View Details
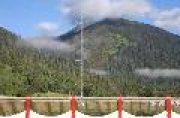
This data set includes daily average data of atmospheric temperature, relative humidity, precipitation, wind speed, wind direction, net radiance, and atmospheric pressure from 1 January 2007 to 31 December 2016 derived from the Integrated Observation and Research Station of the Alpine Environment in Southeast Tibet. The data set has been used by students and researchers in the fields of meteorology, atmospheric environment and ecological research. The units of the various meteorological elements are as follows: temperature °C; precipitation mm; relative humidity %; wind speed m/s; wind direction °; net radiance W/m2; pressure hPa; and particulate matter with aerodynamic diameter less than 2.5 μm μg/m3. All the data are the daily averages calculated from the raw observations. Observations and data collection were carried out in strict accordance with the instrument operating specifications and the guidelines published in relevant academic journals; data with obvious errors were eliminated during processing, and null values were used to represent the missing data. In 2015, due to issues related to the age of the observation probe at the station, only the wind speed data for the last 8 months were retained.
2020-01-10 View Details
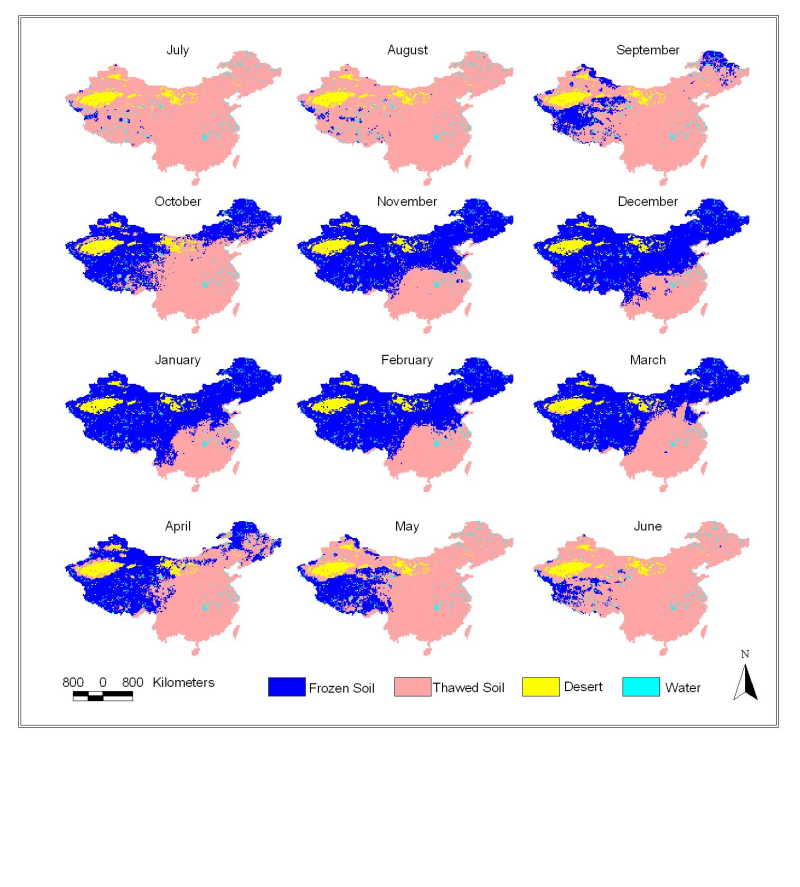
This dataset uses daily temperature data from SMMR (1978-1987), SSM/I (1987-2009) and SSMIS (2009-2015). It is generated by the dual-index (TB, 37v, SG) freeze-thaw discrimination algorithm. The classification results include the frozen surface, the thawed surface, the deserts and water bodies. The data coverage is the main part of China’s mainland, with a spatial resolution of 25.067525 km via the EASE-Grid projection method, and it is stored in ASCIIGRID format. All the ASCII files in this data set can be opened directly with a text program such as Notepad. Except for the head file, the body content is numerically characterized by the freeze/thaw status of the surface soil: 1 for frozen, 2 for thawed, 3 for desert, and 4 for precipitation. If you want to use the icon for display, we recommend using the ArcView + 3D or Spatial Analyst extension module for reading; in the process of reading, a grid format file will be generated, and the displayed grid file is the graphical expression of the ASCII file. The read method comprises the following. [1] Add the 3D or Spatial Analyst extension module to the ArcView software and then create a new View. [2] Activate View, click File menu, and select the Import Data Source option. When the Import Data Source selection box pops up, select ASCII Raster in the Select import file type box. When the dialog box for selecting the source ASCII file automatically pops up, click to find any ASCII file in the data set, and then press OK. [3] Type the name of the Grid file in the Output Grid dialog box (it is recommended that a meaningful file name is used for later viewing) and click the path to store the Grid file, press OK again, and then press Yes (to select integer data) and Yes (to put the generated grid file into the current view). The generated files can be edited according to the Grid file standard. This completes the process of displaying an ASCII file into a Grid file. [4] In the batch processing, the ASCIGRID command of ARCINFO can be used to write AML files, and then use the Run command to complete the process in the Grid module: Usage: ASCIIGRID <in_ascii_file> <out_grid> {INT | FLOAT}. The production of this data is supported by the following Natural Science Foundation Projects: Environmental and Ecological Science Data Center of West China (90502010), Land Data Assimilation System of West China (90202014) and Active and Passive Microwave Radiation Transmission Simulation and Radiation Scattering Characteristics of the Frozen Soil (41071226).
2020-01-09 View Details

This data set includes the daily average data of air temperature, relative humidity, precipitation, wind speed, wind direction, net radiation, air pressure, etc. of Southeast Tibet station from January 1, 2017 to December 31, 2018.
2019-11-22 View Details
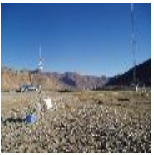
This data set includes the daily average values of air temperature, air pressure, relative humidity, wind speed, precipitation, total radiation, p2.5 concentration, short wave radiation, etc. observed by the comprehensive observation and research station of atmosphere and environment of Everest from 2017 to 2018.
2019-11-22 View Details

This data set includes the daily values of temperature, air pressure, relative humidity, wind speed, precipitation, total radiation, etc. observed at Namuco station from January 1, 2017 to December 31, 2018.
2019-11-21 View Details
Contact Support
Links
National Tibetan Plateau Data CenterFollow Us

A Big Earth Data Platform for Three Poles © 2018-2020 No.05000491 | All Rights Reserved
|  No.11010502040845
Tech Support: westdc.cn