
Brief Introduction:The Tibetan Plateau, known as the " third pole " of the earth, has always been the focus of attention of the international community because it is an important area driving global environmental change research and has a profound regulatory effect on the ecology, environment and climate of the whole earth. Under the background of global warming, the cryosphere elements such as tripolar glaciers, frozen soils, and freeze-thaw lakes have undergone significant changes, with glaciers shrinking rapidly and permafrost active layers thickening. For a long time, China has carried out systematic and multidisciplinary research in the world ' s third pole with the Qinghai-Tibet Plateau as the main body, forming a rich research accumulation.
Publish Datetime:2022-12-13
Number of Datasets:184
This data set contains the results of the calculation of Net Primary Productivity (NPP) on the Tibetan Plateau based on ecological models and remote sensing data from 1982 to 2006. Ecosystem NPP of the Tibetan Plateau was generated based on the remote sensing Advanced Very High Resolution Radiometer (AVHRR) data and the Carnegie-Ames-Stanford Approach (CASA) model(1982-2006), the soil carbon content was generated based on the second soil census data, and the biomass carbon data were generated based on the High Resolution Biosphere Model (HRBM) model. Forest ecosystem NPP of the Tibetan Plateau (1982-2006): npp_forest82.e00,npp_forest83.e00,npp_forest84.e00,npp_forest85.e00,npp_forest86.e00, npp_forest87.e00,npp_forest88.e00,npp_forest89.e00,npp_forest90.e00,npp_forest91.e00, npp_forest92.e00,npp_forest93.e00,npp_forest94.e00,npp_forest95.e00,npp_forest96.e00, npp_forest97.e00,npp_forest98.e00,npp_forest99.e00,npp_forest00.e00,npp_forest01.e00, npp_forest02.e00,npp_forest03.e00,npp_forest04.e00,npp_forest05.e00,npp_forest06.e00 Grassland ecosystem NPP of the Tibetan Plateau(1982-2006): npp_grass82.e00,npp_grass83.e00,npp_grass84.e00,npp_grass85.e00,npp_grass86.e00, npp_grass87.e00,npp_grass88.e00,npp_grass89.e00,npp_grass90.e00,npp_grass91.e00, npp_grass92.e00,npp_grass93.e00,npp_grass94.e00,npp_grass95.e00,npp_grass96.e00, npp_grass97.e00,npp_grass98.e00,npp_grass99.e00,npp_grass00.e00,npp_grass01.e00,npp_grass02.e00,npp_grass03.e00,npp_grass04.e00,npp_grass05.e00,npp_grass06.e00. Biomass carbon and soil carbon of the Tibetan Plateau: Biomass.e00,Socd.e00. The soil carbon content data (Socd) are generated based on data of the second soil census of China and Soil Map of China (1:1,000,000) by soil subclass interpolation. The NPP data are generated from the CASA model and AVHRR data simulation: Potter CS, Randerson JT, Field CB et al. Terrestrial ecosystem production: a process model based on global satellite and surface data. Global Biogeochemical Cycles, 1993, 7: 811–841. The biomass carbon data are generated via HRBM model simulation: McGuire AD, Sitch S, et al. Carbon balance of the terrestrial biosphere in the twentieth century: Analyses of CO2, climate and land use effects with four process-based ecosystem models. Global Biogeochem. Cycles, 2001, 15 (1), 183-206. The raw data are mainly remote sensing data and field observation data with high accuracy; the verification and adjustment of the measured data in the field during the production were undertaken to maintain the error of the simulation results and the field measured data within the acceptable range as much as possible; the verification results of the NPP data and the field measured data show that the error remains within 15%. The spatial resolution is 0.05°×0.05° (longitude×latitude).
2022-04-21 View Details
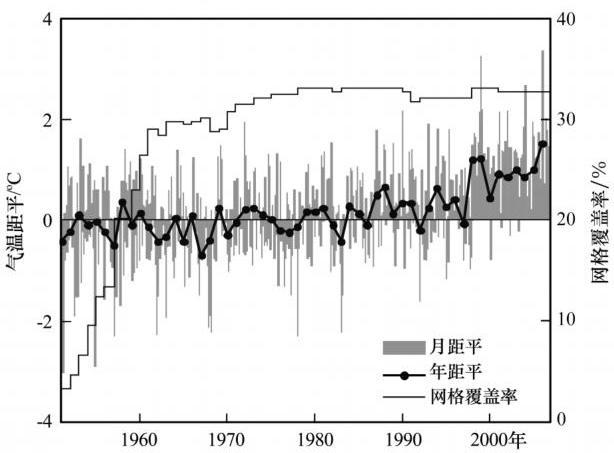
This data set contains the temperature anomaly series for each quarter and month of the years from January, 1951 to December, 2006 on the Tibetan Plateau. Based on the “China Homogenized Historical Temperature Data Set (1951–2004) Version 1.0” and the daily average temperature data from 2005 to 2006, the monthly average temperature of 123 sites on the Tibetan Plateau and its neighboring areas were gridded using the Climate Anomaly Method (CAM). Further, the average monthly temperature anomaly sequences from 1951 to 2006 were established using the area weighting factor method. To maximize the use of the observation data, the method using the data at a nearby reference station to correct the short series of the climatic standard values of the air temperature data is emphatically discussed. Reference: Yu Ren, Xueqin Zhang, Lili Peng. Construction and Analysis of Mean Air Temperature Anomaly Series for the Qinghai-Xizang Plateau during 1951-2006. Plateau Meteorology, 2010. The “China Homogenized Historical Temperature Data Set (1951–2004) Version 1.0” and the daily average temperature data from 2005 to 2006 meet the relevant national standards. There are five fields in the monthly temperature anomaly data table. Field 1: Year Field 2: Month Field 3: Number of grids Number of grids included in the calculation Field 4: Number of sites Number of sites included in the calculation Field 5: Monthly Temperature Anomaly Unit °C There are five fields in the year and quarter temperature anomaly data table. Field 1: Year Field 2: Quarter Field 3: Number of grids Number of grids included in the calculation Field 4: Number of sites Explanation: Number of sites included in the calculation Field 5: Temperature anomaly °C In the quarter field: 1. If it is null, it is the annual temperature anomaly 2. DJF: Winter (Last December to this February) temperature anomaly °C 3. MAM: Spring (March-May) temperature anomaly °C 4. JJA: Summer (June-August) temperature anomaly °C 5. SON: Fall (September-November) temperature anomaly °C Data accuracy: the monthly average temperature anomaly to the third decimal places, the annual and quarterly average temperature anomaly to the second decimal places.
2022-04-19 View Details
The data products of mixed soil moisture of the Tibetan Plateau utilize remote sensing observation, in situ measurement and model simulation techniques. In situ soil moisture (SM) observation combines the classification of the Tibetan Plateau climate zone and is used to generate in situ measurements of SM climatology at plateau scales. The resulting in situ SM climatology of the Tibetan Plateau scale is used to scale the SM data simulated by the model, which are then used to scale the SM satellite observations. The climatological-scale satellites and model-simulated SMs are then objectively mixed by applying triple configuration and least square matching. The final mixed SM can replicate SM dynamics in different climate zones, from subhumid areas to semiarid and arid regions of the Tibetan Plateau. - Time resolution: day, starting from 01/05/2008 - Spatial resolution: 0.25° × 0.25° - Data set size: 61 × 121 × 975 - Unit: cm^3 cm^-3 The data quality is open to assessment.
2022-04-18 View Details
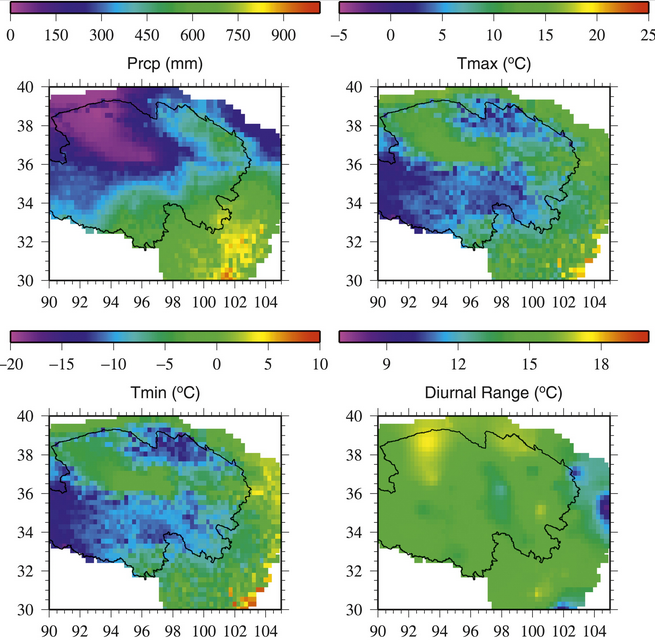
The 0.25 Degree climate data set in the northeastern part of the Tibetan Plateau from 1957 to 2009 contains four meteorological elements, which are precipitation, maximum and minimum temperatures, and wind speed. The time resolution is daily. The data set contains 2400 text files, each with precipitation (the 1st column), highest (the 2nd column) and lowest (the 3rd column) temperatures and wind speed (the 4th column). Each file name contains latitude and longitude. Each file represents the four meteorological element values for the corresponding grid point (0.25*0.25 degrees). These data are formed by gridding the observation data of 81 meteorological stations in the northeast of the plateau, considering the change of meteorological conditions with the elevation. The gridding methods and steps are as follows. Download the original daily maximum and minimum temperatures, precipitation, and wind speed from the China Meteorological Data Network (http://data.cma.cn). Then, perform quality control on the data. The principle used is 1) to remove daily precipitations below 0 and greater than 150 mm, daily temperatures below -50 °C and greater than 50 °C and wind speeds below 0 m / s, 2) draw annual sequence precipitation, temperature and wind speed, check for abnormal year-to-year changes, and conduct quality control through station migration records. For data with abnormal changes but with station migration records, the data are segmented by modifying the station name. For example, at Xining Station (52866), abnormal temperature changes occurred in 1996, which was found through records that Xining Station migrated after 1996. Therefore, the records before 1996 are recorded as virtual station 52867 data, and after 1996, the data are still recorded as 52866 stations. If the data change abnormally but there is no station migration record, the abnormally changed data are eliminated, for example, the data from Delingha Station before 1975. Some stations have migration records, but the data do not change abnormally; then, it is assumed that the stations before and after the migration are still in the same climate environment, so there is no change in station name and data record. Interpolation begins after quality control. The method begins with (1) calculating the changes in daily average temperature, precipitation and wind speed as the altitude changes. It is concluded that the temperature decreases with altitude by 4.3 °C/km, and the coefficient of determination R2 is 0.65. In the warm and humid season (from May to September), the average daily precipitation has an insignificant increase with altitude (0.5 mm/km, R2 is 0.1). The average daily precipitation in the cold dry season (from October to April) does not change with altitude. The wind speed also has an insignificant increase with altitude, with an increase rate of 0.4 m/s/km and R2 of 0.1. (2) The spatial interpolation is performed using the Synographic Mapping System (SYMAP, Shepard, 1984) method. In this method, the distance between stations and the angle between surrounding stations are taken into account in interpolation to indicate the density of stations. The distance and angle are integrated into a weight. In addition, the stations that are close and have a large angle between each other are given a large weight. (3) The latitude and longitude of the station, the meteorological element value, the altitude, the rate of change with the altitude, and the weight are considered simultaneously, and the value of the target grid is interpolated. The maximum search range for interpolation is 55 stations around, and the smallest search range is 4 stations around. (4) Integrate the precipitation in the warm and dry seasons to form a precipitation sequence throughout the period. (5) During the method test period, some stations are set aside to check the gridded data. (6) After the verification is passed, all 81 stations are used in the final gridding process and form this set of data sets. Shepard, D. S., 1984: Computer Mapping: The SYMAP interpolation algorithm. Spatial Statistics and Models, G.Gaile and C. Willmot, Eds., Reidel 133-145.
2022-04-18 View Details
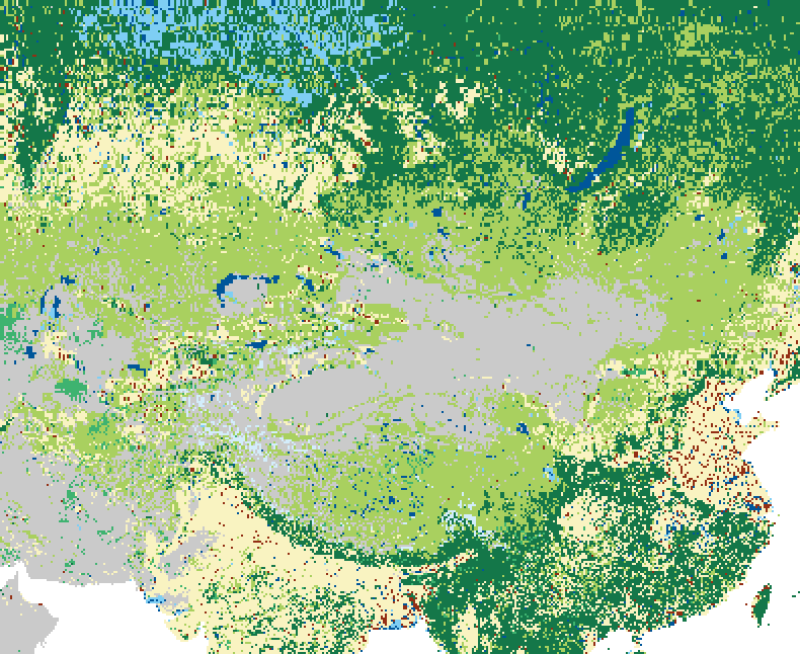
These data contain two data files: GLOBELAND30 TILES (raw data) and TIBET_ GLOBELAND30_MOSAIC (mosaic data). The raw data were downloaded from the Global Land Cover Data website (GlobalLand3) (http://www.globallandcover.com) and cover the Tibetan Plateau and surrounding areas. The raw data were stored in frames, and for the convenience of using the data, we use Erdas software to splice and mosaic the raw data. The Global Land Cover Data (GlobalLand30) is the result of the “Global Land Cover Remote Sensing Mapping and Key Technology Research”, which is a key project of the National 863 Program. Using the American Landsat images (TM5, ETM+) and Chinese Environmental Disaster Reduction Satellite images (HJ-1), the data were extracted by a comprehensive method based on pixel classification-object extraction-knowledge checks. The data include 10 primary land cover types—cultivated land, forest, grassland, shrub, wetland, water body, tundra, man-made cover, bare land, glacier and permanent snow—without extracting secondary types. In terms of accuracy assessment, nine types and more than 150,000 test samples were evaluated. The overall accuracy of the GlobeLand30-2010 data is 80.33%. The Kappa indicator is 0.75. The GlobeLand30 data use the WGS84 coordinate system, UTM projection, and 6-degree banding, and the reference ellipsoid is the WGS 84 ellipsoid. According to different latitudes, the data are organized into two types of framing. In the regions of 60° north and south latitudes, the framing is carried out according to a size of 5° (latitude) × 6° (longitude); in the regions of 60° to 80° north and south latitudes, the framing is carried out according to a size of 5° (latitude) × 12° (longitude). The framing is projected according to the central meridian of the odd 6° band. GLOBELAND30 TILES: The original, unprocessed raw data are retained. TIBET_ GLOBELAND30_MOSAIC: The Erdas software is used to mosaic the raw data. The parameter settings use the default value of the raw data to retain the original, and the accuracy is consistent with that of the downloading site.
2022-04-18 View Details

The data set collected long-term monitoring projects from multiple stations for atmosphere, hydrology and soil in the North Tibetan Plateau. The data set consisted of monitoring data obtained from the automatic weather station (AWS) and the atmospheric boundary layer tower (PBL) in the field. The sensors for temperature, humidity and pressure were provided by Vaisala of Finland; the sensors for wind speed and direction were provided by Met One of America, the radiation sensors were provided by APPLEY of America and EKO of Japan; the gas analyzers were provided by Licor of America; the soil water content instrument, ultrasonic anemometers and data collectors were provided by CAMPBELL of America. The observation system was maintained by professionals regularly (2-3 times a year), the sensors were calibrated and replaced, and the collected data were downloaded and reorganized. The data set was processed by forming a time continuous sequence after the raw data were quality-controlled. It met the accuracy level of the original meteorological observation data of the National Weather Service and the World Meteorological Organization (WMO). The quality control included the elimination of the missing data and the systematic error caused by the failure of the sensor.
2022-04-18 View Details
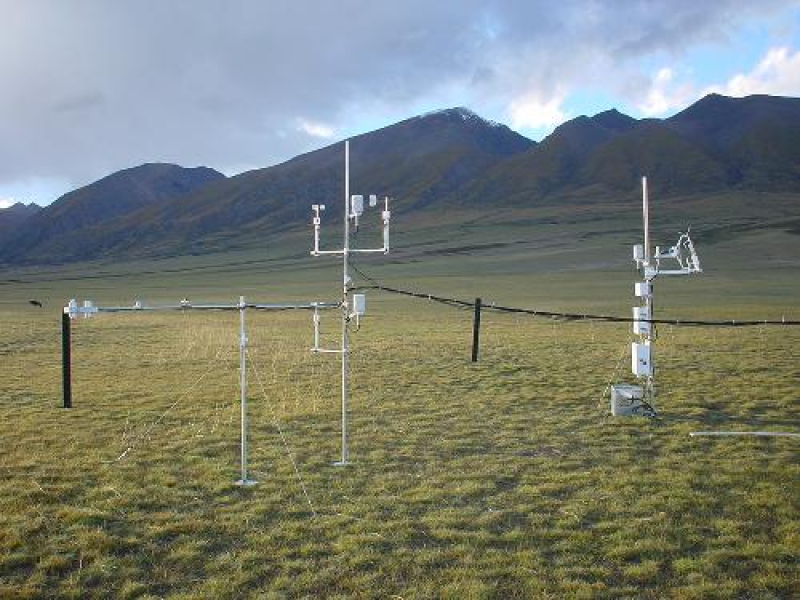
This data set includes meteorological data observed by the carbon flux station in the Guoluo Army Ranch in Qinghai. The temporal coverage is from 2005 to 2009, and the temporal resolution is 1 day. Meteorological and carbon flux data observation methods: vorticity-related observation instruments were used for automatic recording; biomass observation method: harvest method, weighing in a 60-degree oven for 48 hours. Both carbon flux and meteorological data were automatically recorded by the instruments and manually checked. During the data observation process, the operation of the instrument and the selection of the observation objects were in strict accordance with professional requirements, and the data could be applied to plant leaf photosynthetic parameter simulation and productivity estimation. This data contains observation items as follows: Temperature °C Precipitation mm Wind speed m/s Soil temperature at 5 cm depth °C Photosynthetically active radiation µmol/m²s Total radiation W/m²
2022-04-18 View Details
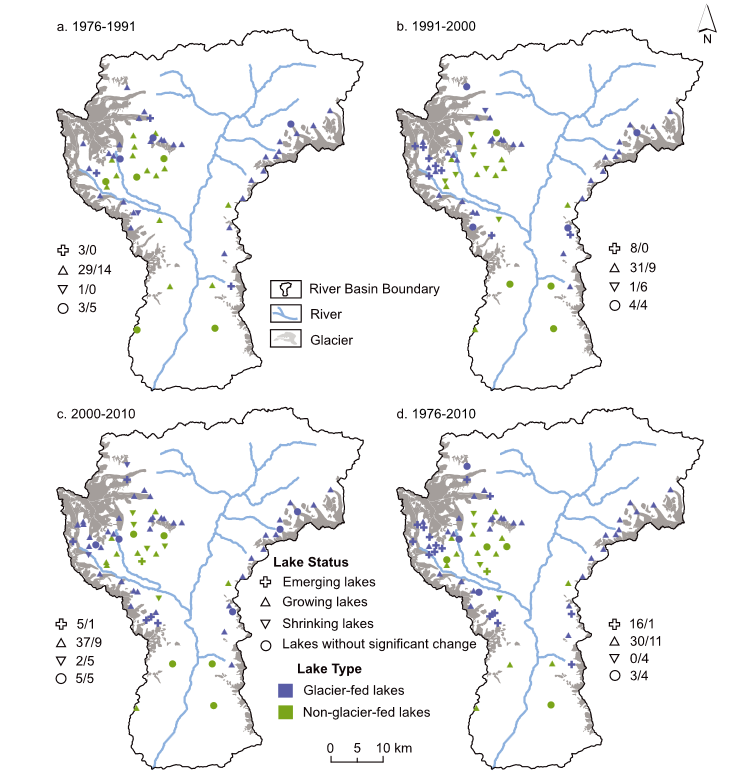
This is the 1976, 1991, 2000, and 2010 vector data set of glaciers and glacial lakes in the Boqu Basin in Central Himalaya based on Landsat satellite images. The data source is from Landsat remote images. 1976: LM21510411975306AAA05, LM21510401976355AAA04 1991: LT41410401991334XXX02, LT41410411991334XXX02 2000: LE71410402000279SGS00, LE71400412000304SGS00, LE71410402000327EDC00, LE71410412000327EDC00 2010: LT51400412009288KHC00, LT51410402009295KHC00, LT51410412009311KHC00, LT51410402011237KHC00. The boundaries of glaciers and glacial lakes are extracted manually from the various remote sensing images. The extraction error of the boundaries of glaciers and glacial lakes is estimated to be 0.5 pixels. Data file: Glacial_1976: Glacier vector data in 1976 Glacial_1991: Glacier vector data in 1991 Glacial_2000: Glacier vector data in 2000 Glacial_2010: Glacier vector data in 2010 Glacial_Lake_1976: Glacial lake vector data in 1976年 Glacial_Lake_1991: Glacial lake vector data in 1991 Glacial_Lake_2000: Glacial lake vector data in 2000 Glacial_Lake_2010: Glacial lake vector data in 2010 The glacial lake vector data fields include Number, name, latitude and longitude, altitude, area, orientation, type of glacial lake, length, width, and distance from the glacier.
2022-04-18 View Details
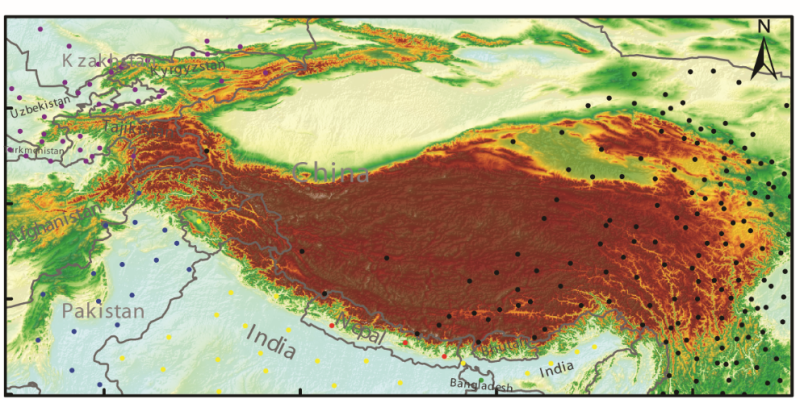
The precipitation dataset of the Third Pole region mainly contains two EXCEL files: (1) Daily precipitation data in China in the Third Pole region, named as China_daily.xlsx. The precipitation data in China were obtained from the China Meteorological Administration-National Meteorological Information Center (http://data.cma.gov.cn/site/index.html). (2) Daily precipitation data in other countries in the Third Pole region, named as Foreign_daily.xlsx. The precipitation data in other countries were obtained from NCDC International Climatic Data Center - NOAA Satellite Information Service Center (http://www7.ncdc.noaa.gov/CDO/country), Pakistan Meteorological Administration, Nepal Meteorological Administration, etc. There are seven variables in these two EXCEL data files: precipitation, corrected precipitation, correction factor, wind-induced loss, evaporation loss, wet loss, and trace precipitation. The detail characteristics of TPE stations were described in an EXCEL file either, named as "TPE station and gauge type.xls". The raw data has been strictly quality controlled by the relevant meteorological departments and has been applied in relevant academic papers.
2022-04-15 View Details
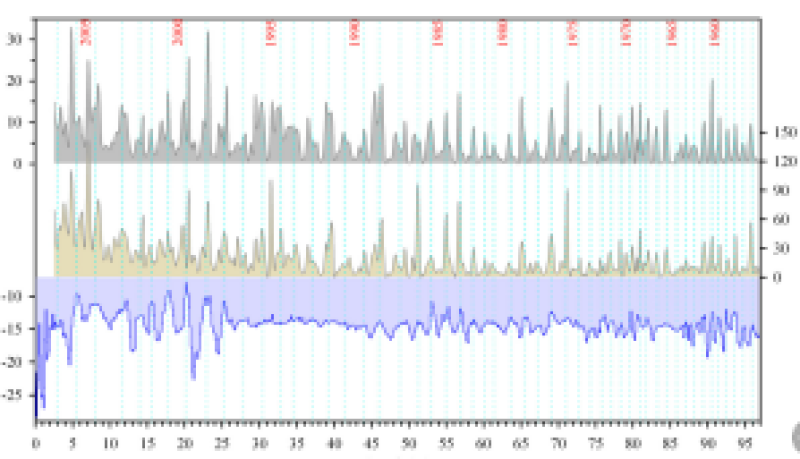
The data set of ice core-snow black carbon content on the Tibetan plateau (1950-2006) contains five (5) tables: 1 Xu et al. 2006 AG, 2 Xu et al. 2009 PNAS_Conc., 3 Xu et al. 2009 PNAS_flux, 4 Xu et al. 2012 ERL, 5 Wang et al. 2015 ACP. The data collection sites include the Meikuang glacier, Dongkemadi, Qiangyong, Kangwure, Naimona’nyi, Muztagata, Rongbuk, Tanggula Mountain, Ningjin Gangsang, Zuoqipu, and Glacier No. 1 at the headwaters of the Ürüqi River. The latitudes and longitudes of the collection locations, elevations and other information are marked in the data. The main indicators of the data are location, time, organic carbon (OC), elemental carbon (EC), black carbon (BC) content and flux. Location: latitude and longitude Time: year or date OC: organic carbon EC: elemental carbon BC: Black carbon Conc.: content, unit: ng g-1 Flux: flux, unit: mg m-2a-1 The data come from the following subjects. 1. National Program on Key Basic Research Project (973 Program):Temporal and Spatial Characteristics and Remote Sensing Modeling of Global Change Sensitive Factors; Person in charge: Baiqing Xu; Unit: Institute of Tibetan Plateau Research, Chinese Academy of Sciences; Supported by the Ministry of Science and Technology. 2. National Key Basic Research Program: The Response of Formation and Evolution on the Tibetan Plateau to Global Changes and Adaptation Strategy; Person in charge: Tandong Yao; Unit: Institute of Tibetan Plateau Research, Chinese Academy of Sciences; Supported by the Ministry of Science and Technology. 3. The General Program of National Natural Science Foundation of China: High-resolution Carbon Black Recording in Snow Ice of the Tibetan Plateau; Person in charge: Baiqing Xu; Unit: Institute of Tibetan Plateau Research, Chinese Academy of Sciences; Supported by the National Natural Science Foundation of China (NSFC). 4. The General Program of the National Natural Science Foundation of China: Extraction of Climate and Environment Information from Ice Core Encapsulated Gas on the Tibetan Plateau; Person in charge: Baiqing Xu; Unit: Institute of Tibetan Plateau Research, Chinese Academy of Sciences; Supported by the National Natural Science Foundation of China (NSFC). 5. National Natural Science Foundation of China for Distinguished Young Scholars: Snow and Ice-Atmospheric Chemistry and Environmental Changes on the Tibetan Plateau; Person in charge: Baiqing Xu; Unit: Institute of Tibetan Plateau Research, Chinese Academy of Sciences; Supported by the National Natural Science Foundation of China (NSFC). 6. National Natural Science Foundation of China for Distinguished Young Scholars: Study on the Changes of Aerosol Emissions and Combustion in Human Activities in South Asia in the Past 100 Years; Person in charge: Mo Wang; Unit: Institute of Tibetan Plateau Research, Chinese Academy of Sciences; Supported by the National Natural Science Foundation of China (NSFC). Observation methods: two-step heating method, thermal/optical carbon analysis method, and single-particle black carbon aerosol photometer.
2022-04-15 View Details
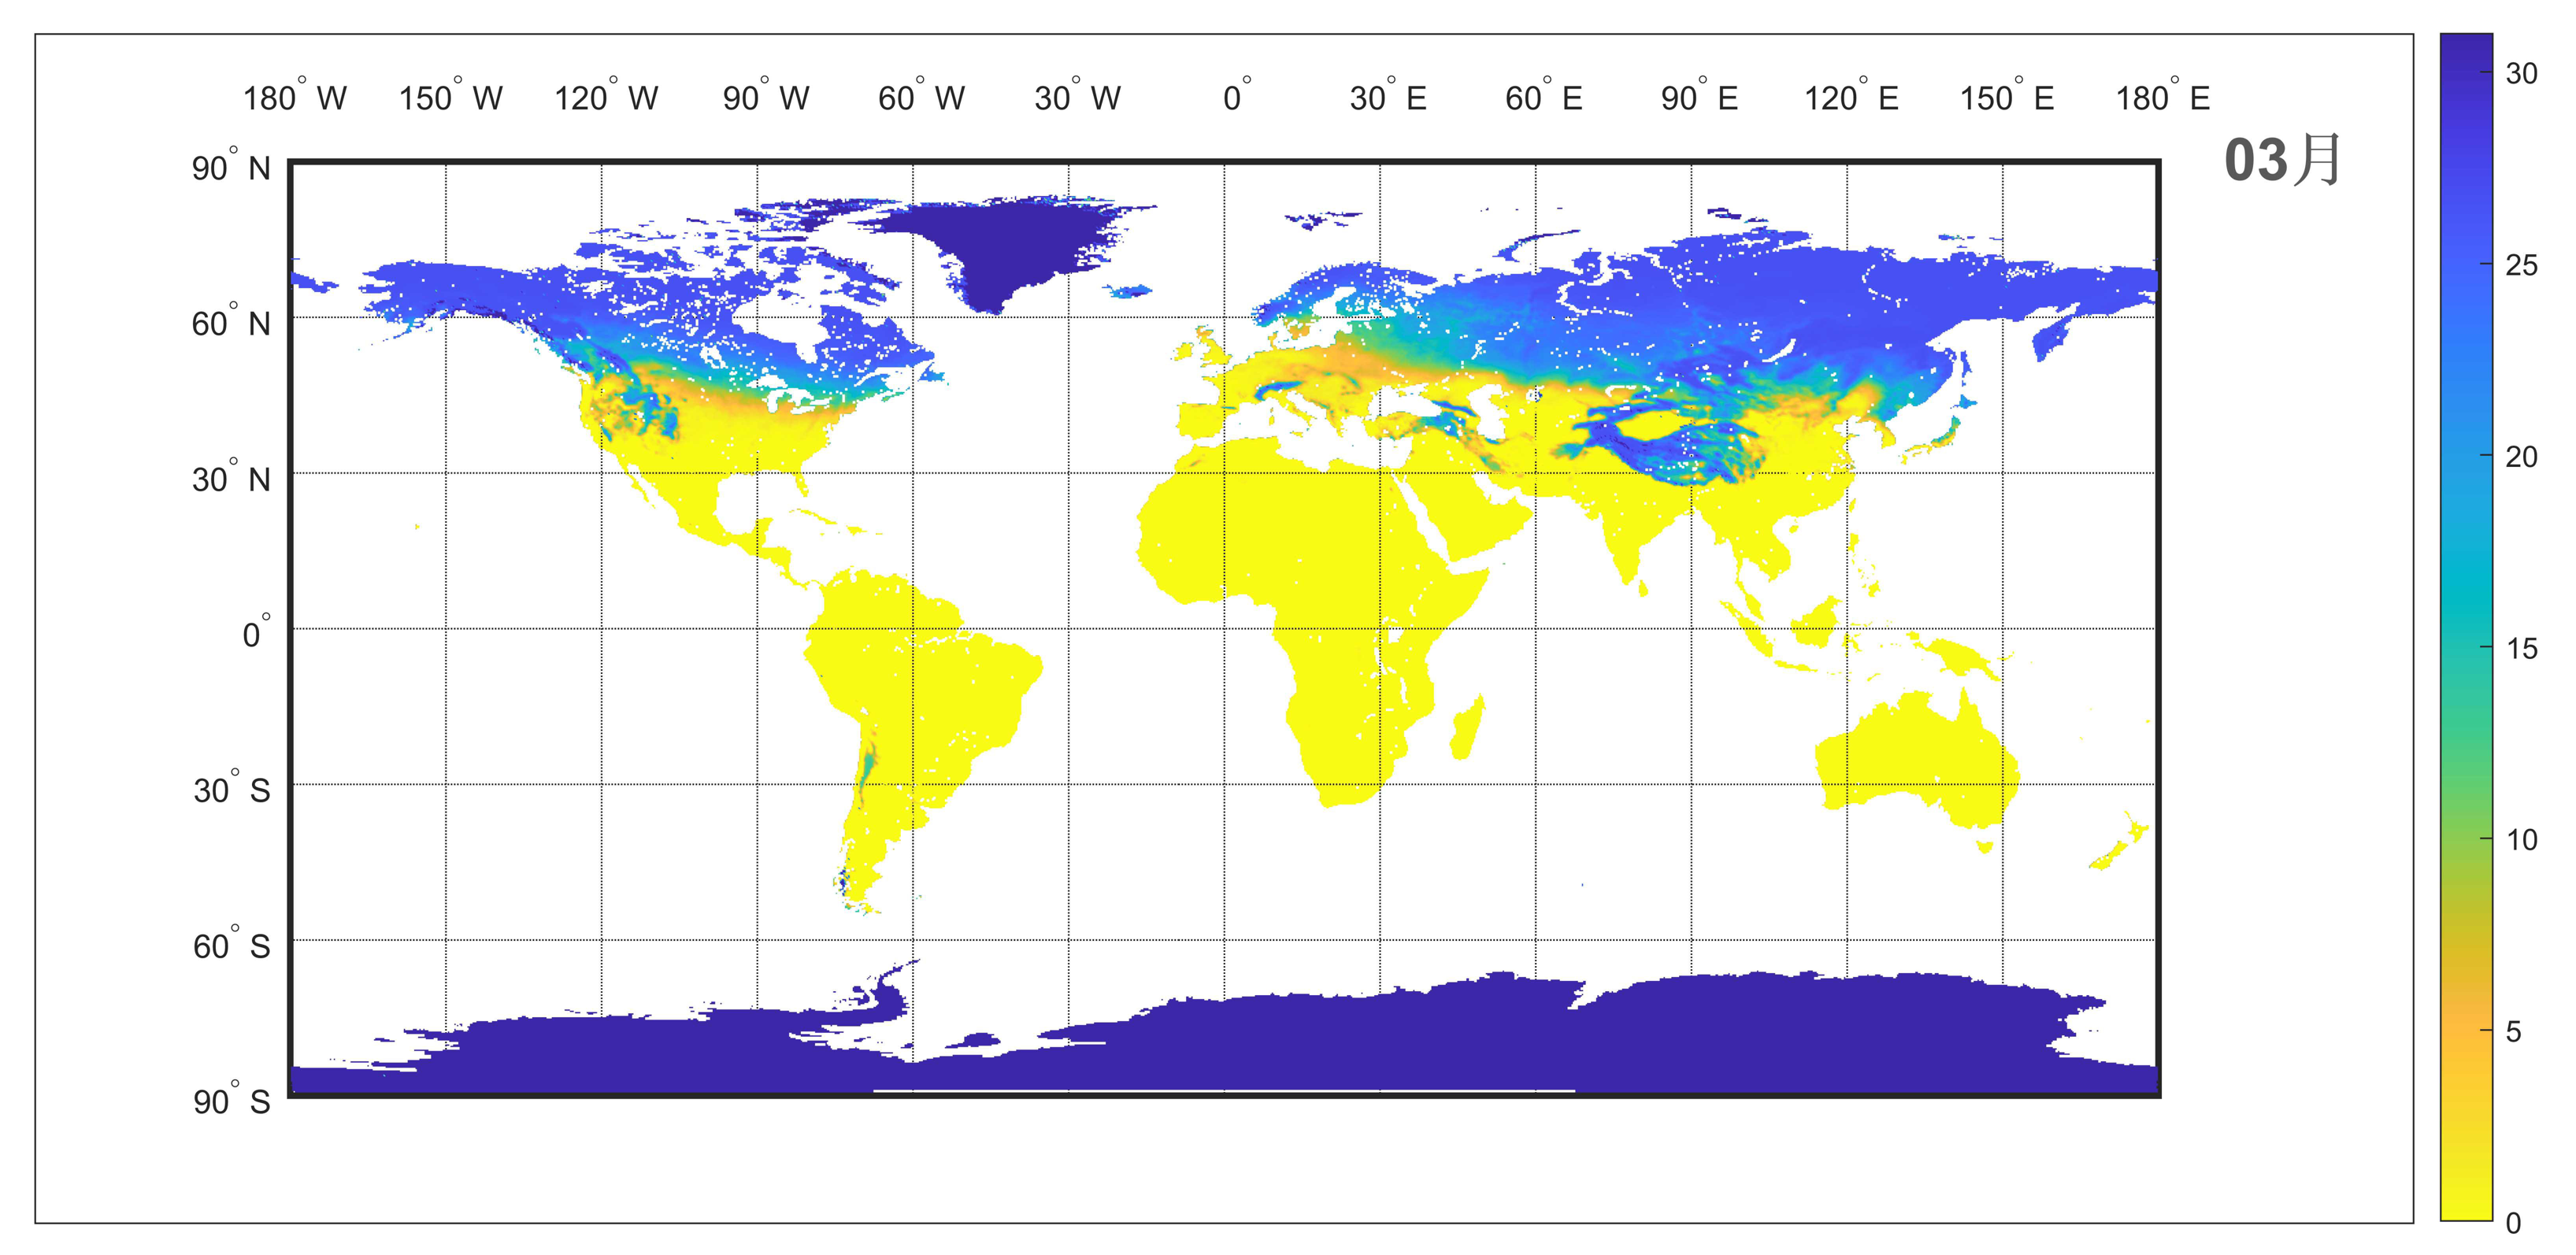
The freeze/thaw status of the near-surface soil is the water-ice phase transition that occurred at the top soil layer. It is an important indicator as a giant on-off “switch” of the land surface processes including water, energy, and carbon exchanges between the land surface and atmosphere. The freeze/thaw status is an essential variable for understanding how the ecosystem responds to and affects global changes. This dataset is based on the AMSR-E and AMSR2 passive microwave brightness temperature data, and the freeze-thaw discriminant function algorithm is used to generate the global near-surface soil freeze-thaw status with a spatial resolution of grids at 0.25° from 2002 to 2019. The dataset can be used for the analysis of the spatial distribution and trend changes of global freeze-thaw cycles, such as the freeze/thaw onset dates and duration. It provides data support for understanding the interaction mechanism between the land surface freeze-thaw cycle and the land-atmosphere exchanges under the context of global changes.
2022-03-30 View Details
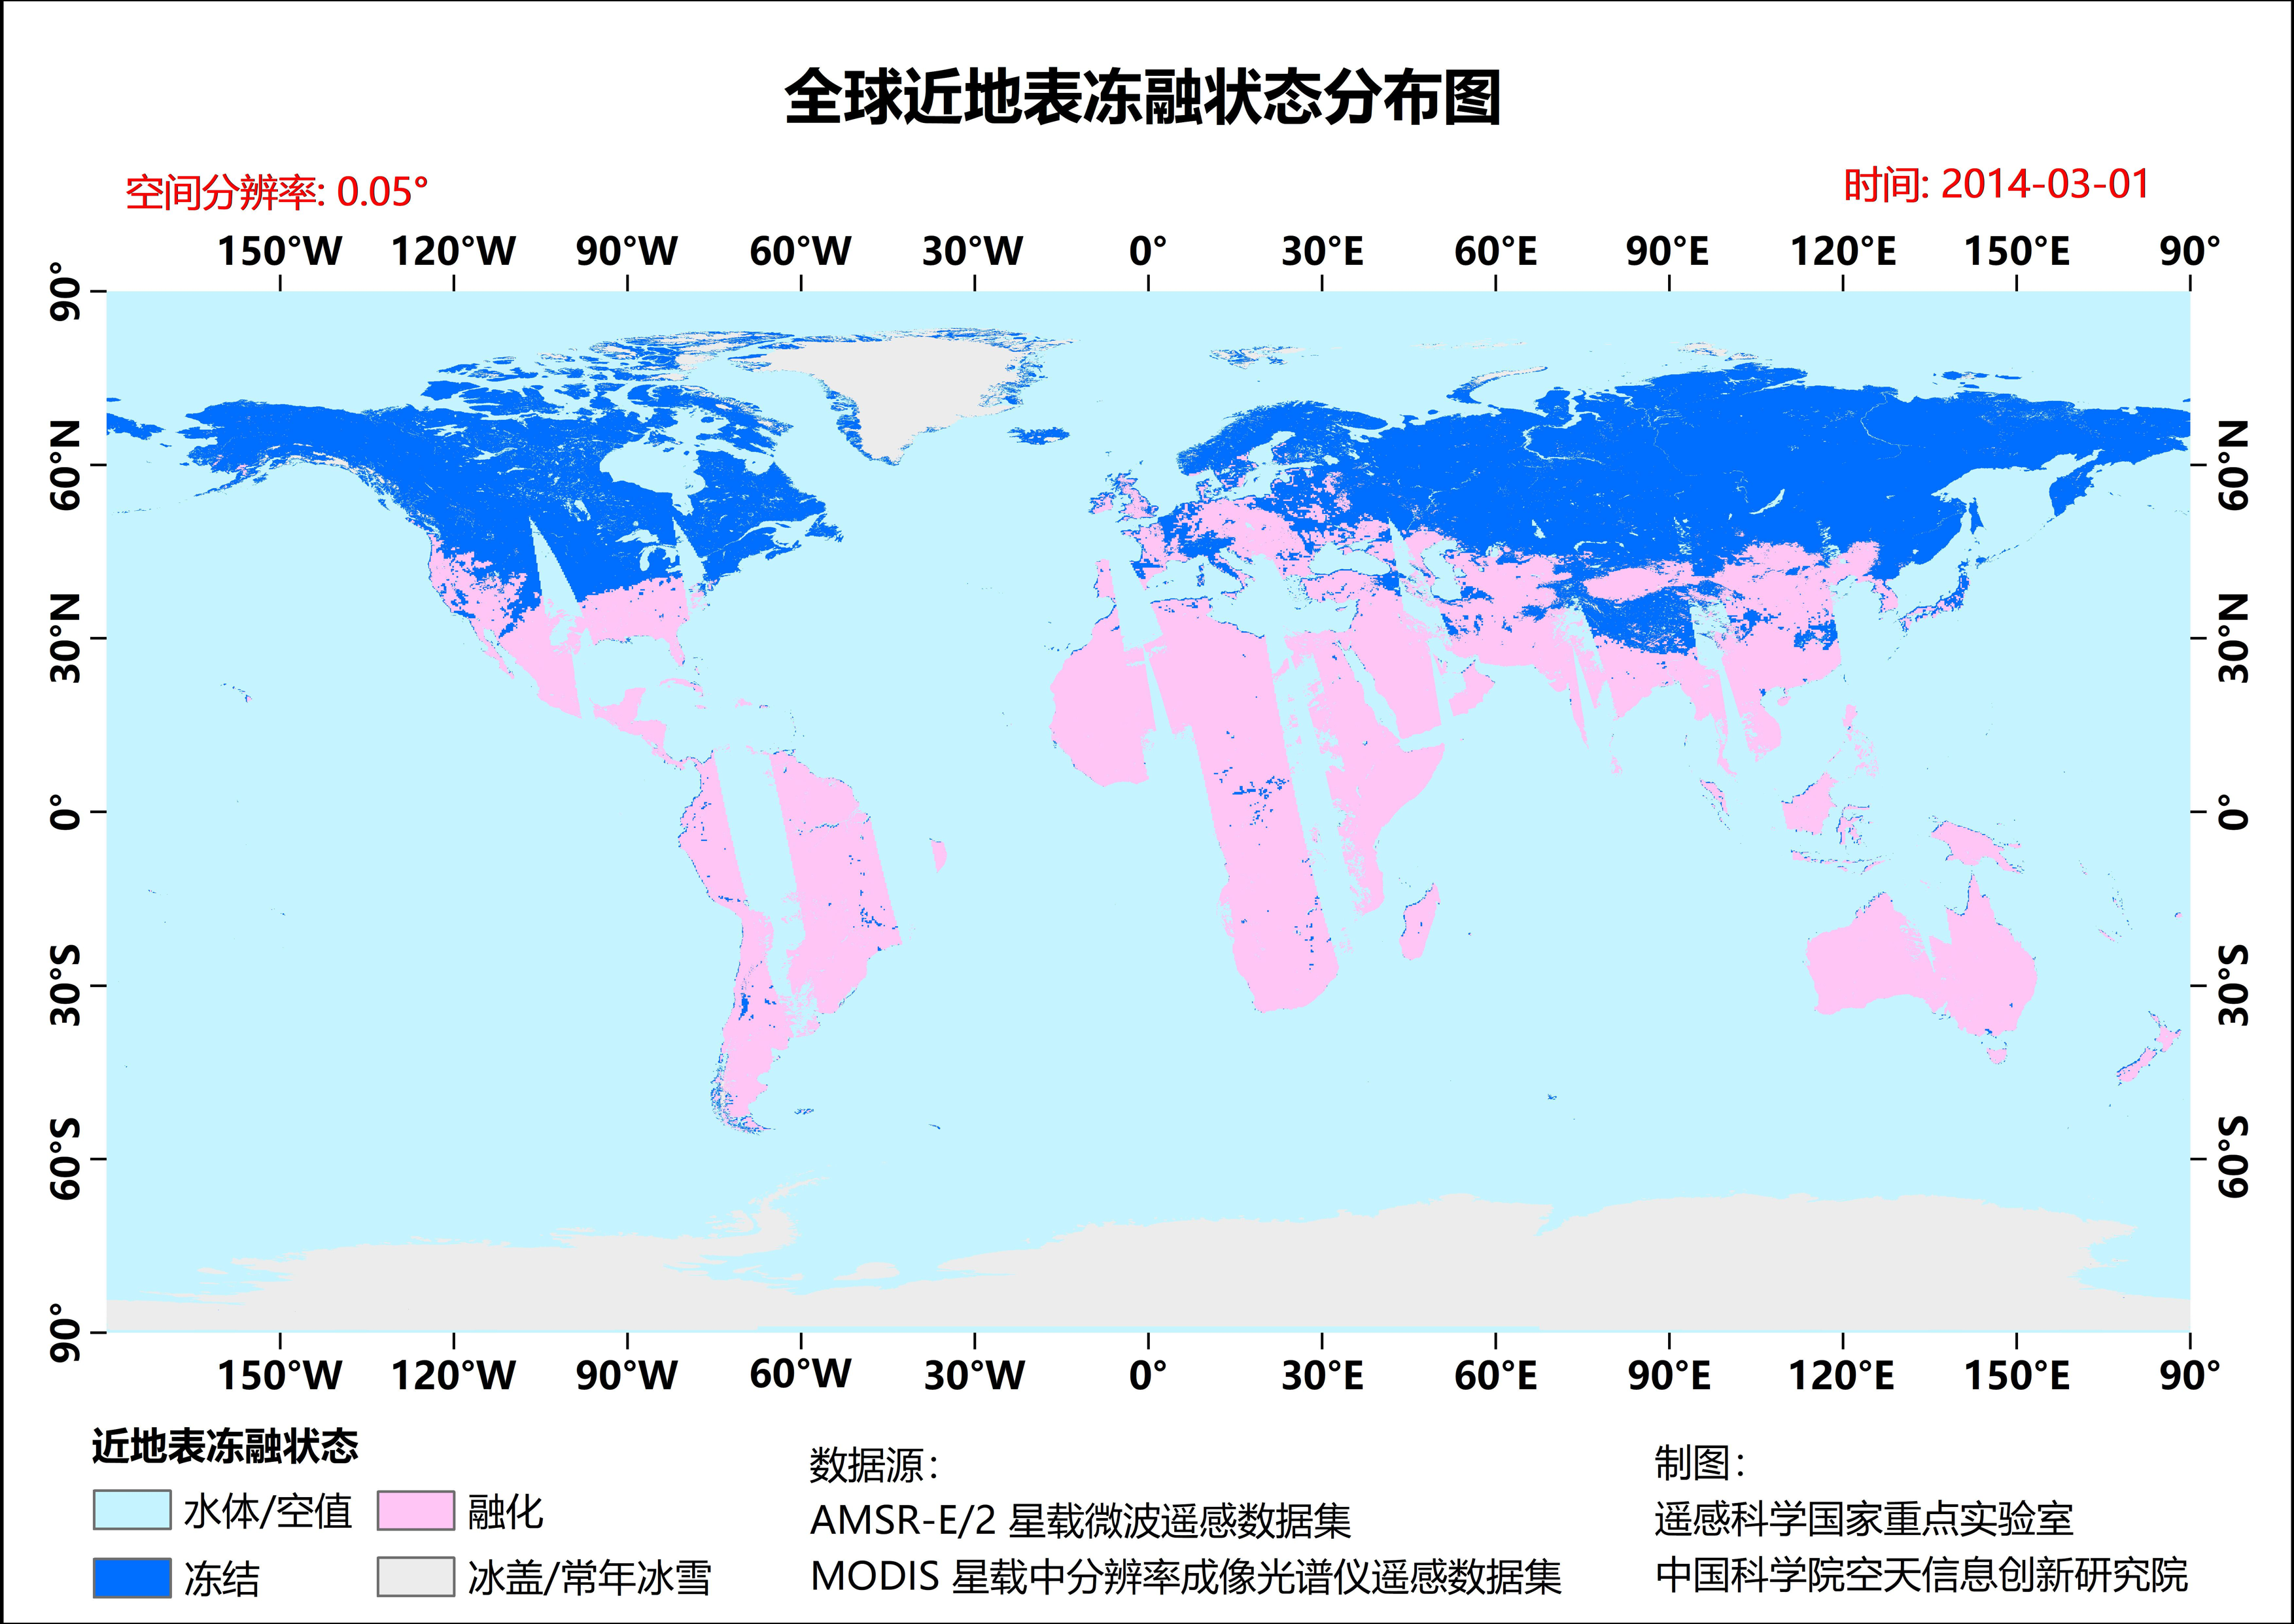
The freeze/thaw status of the near-surface soil is the water-ice phase transition that occurred at the top soil layer. It is an important indicator as a giant on-off “switch” of the land surface processes including water, energy, and carbon exchanges between the land surface and atmosphere. The freeze/thaw status is an essential variable for understanding how the ecosystem responds to and affects global changes. This dataset is based on the AMSR-E, AMSR2 passive microwave brightness temperature data and MODIS optical remote sensing data. The freeze-thaw discriminant function algorithm and downscaling algorithm are used to generate the global near-surface soil freeze-thaw status with a spatial resolution of grids at 0.05° from 2002 to 2017. The dataset can be used for the analysis of the spatial distribution and trend changes of global freeze-thaw cycles, such as the freeze/thaw onset dates and duration. It provides data support for understanding the interaction mechanism between the land surface freeze-thaw cycle and the land-atmosphere exchanges under the context of global changes.
2022-03-28 View Details
This data set includes the daily averages of the temperature, pressure, relative humidity, wind speed, precipitation, global radiation, P2.5 concentration and other meteorological elements observed by the Qomolangma Station for Atmospheric and Environmental Observation and Research from 2005 to 2016. The data are aimed to provide service for students and researchers engaged in meteorological research on the Tibetan Plateau. The precipitation data are observed by artificial rainfall barrel, the evaporation data are observed by Φ20 mm evaporating pan, and all the others are daily averages and ten-day means obtained after half hour observational data are processed. All the data are observed and collected in strict accordance with the Equipment Operating Specifications, and some obvious error data are eliminated when processing the generated data.
2022-03-02 View Details
There are many lakes in the Qinghai Tibet Plateau. The glacial phenology and duration of lakes in this region are very sensitive to regional and global climate change, so they are used as the key indicators of climate change research, especially the comparative study of the three polar environmental changes of the earth. However, due to its poor natural environment and sparse population, there is a lack of conventional field measurement of lake ice phenology. The lake ice was monitored with a resolution of 500 meters by using the normalized difference snow index (NDSI) data of MODIS. The traditional snow map algorithm is used to detect the lake daily ice amount and coverage under the condition of sunny days, and the lake daily ice amount and coverage under the condition of cloud cover are re determined through a series of steps based on the spatiotemporal continuity of the lake surface conditions. Through time series analysis, 308 lakes larger than 3km2 are identified as effective records of lake ice range and coverage, forming a daily lake ice range and coverage data set, including 216 lakes.
2022-01-11 View Details
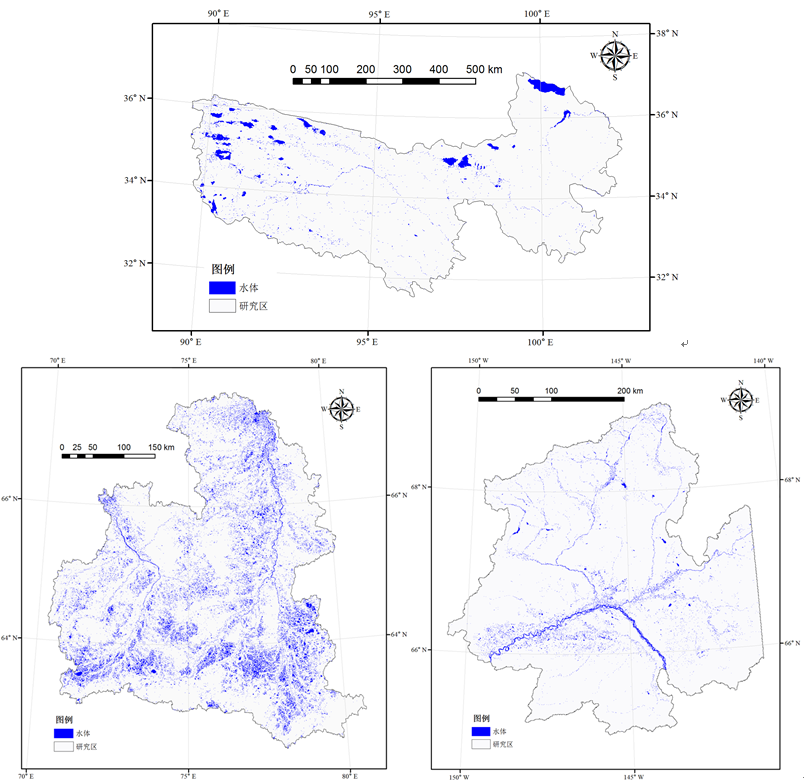
The data of this study is mainly based on Google Earth Engine big data cloud processing platform. Sentinel-2 of The Three River Headwater region, Pul and Yukon River Basins in 2017 is selected as the basic data, STRM-DEM and Global Surface Water are used as auxiliary data. AWEIn,AWEIs,WI2015,MNDWI,NDWI and other index threshold extraction are selected to obtain seasonal water body and permanent water body according to annual water frequency(spatial resolution 10m). This water data product provides effective basic data for high spatial-temporal resolution water body change and permafrost hydrological analysis.
2021-11-05 View Details
By applying Supply-demand Balance Analysis, the water resource supply and demand of the whole river basin and each county or district were calculated and used to evaluate the vulnerability of the water resources system of the basin. The IPAT equation was used to set a future water resource demand scenario to establish the scenario by setting variables such as future population growth rate, economic growth rate, and unit GDP water consumption. By taking 2005 as the base year and using assorted forecasting data of population size and economic scale, the future water demand scenarios of various counties and cities from 2010 to 2050 were predicted. By applying the basic structure of the HBV conceptual hydrological model of the Swedish Hydrometeorological Institute, a model of the variation tendency of the basin under climate change was designed. The glacial melting scenario was used as the model input to construct the runoff scenario under climate change. According to the national regulations of the water resources allocation of the basin, a water distribution plan was set up to calculate the water supply comprehensively. Considering of the supply and demand situation, the water resource system vulnerability was evaluated by the water shortage rate. By calculating the (grain production) land pressure index of the major counties and cities in the basin, the balance of supply and demand of land resources under the climate change, glacial melt and population growth scenarios was analyzed, and the vulnerability of the agricultural system was evaluated. The Miami formula and HANPP model were used to calculate the human appropriation of net primary biomass and primary biomass in the major counties and cities for the future, and the vulnerability of ecosystems from the perspective of supply and demand balance was assessed.
2021-11-05 View Details
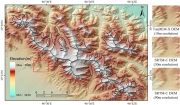
The DEMs of the typical glaciers on the Tibetan Plateau were provided by the bistatic InSAR method. The data were collected on November 21, 2013. It covered Puruogangri and west Qilian Mountains with a spatial resolution of 10 meters, and an elevation accuracy of 0.8 m which met the requirements of national 1:10 000 topographic mapping. Considering the characteristics of the bistatic InSAR in terms of imaging geometry and phase unwrapping, based on the TanDEM-X bistatic InSAR data, and adopting the improved SAR interference processing method, the surface DEMs of the two typical glaciers above were generated with high resolution and precision. The data set was in GeoTIFF format, and each typical glacial DEM was stored in a folder. For details of the data, please refer to the Surface DEMs for typical glaciers on the Tibetan Plateau - Data Description.
2021-10-26 View Details

The Tibetan Plateau is known as “The World’s Third Pole” and “The Water Tower of Asia”. A relatively accurate map of the frozen soil in the Tibetan Plateau is therefore significant for local cold region engineering and environmental construction. Thus, to meet the engineering and environmental needs, a decision tree was established based on multi-source remote sensing data (elevation, MODIS surface temperature, vegetation index and soil moisture) to divide the permafrost and seasonally frozen soil of the Tibetan Plateau. The data are in grid format, DN=1 stands for permafrost, and DN=2 stands for seasonally frozen soil. The elevation data are from the 1 km x 1 km China DEM (digital elevation model) data set (http://westdc.westgis.ac.cn); the surface temperature is the yearly average data based on daily data estimated by Bin Ouyang and others using the Sin-Linear method. The estimation of the daily average surface temperature was based on the application of the Sin-Linear method to MODIS surface products, and to reduce the time difference with existing frozen soil maps, the surface temperature of the study area in 2003 was used as the information source for the classification of frozen soil. Vegetation information was extracted from the 16-day synthetic product data of Aqua and Terra (MYD13A1 and MOD13A1) in 2003. Soil moisture values were obtained from relatively high-quality ascending pass data collected by AMSR-E in May 2003. Therefore, based on the above data, the classification threshold of the decision tree was obtained using the Map of Frozen Soil in the Tibetan Plateau (1:3000000) and Map of the Glaciers, Frozen Soil and Deserts in China (1:4000000) as the a priori information. Based on the prosed method, the frozen soil types on the Tibetan Plateau were classified. The classification results were then verified and compared with the surveyed maps of frozen soil in the West Kunlun Mountains, revised maps, maps of hot springs and other existing frozen soil maps related to the Tibetan Plateau. Based on the Tibetan Plateau frozen soil map generated from the multi-source remote sensing information, the permafrost area accounts for 42.5% (111.3 × 10⁴ km²), and the seasonally frozen soil area accounts for 53.8% (140.9 × 10⁴ km²) of the total area of the Tibetan Plateau. This result is relatively consistent with the prior map (the 1:3000000 Map of Frozen Soil in the Tibetan Plateau). In addition, the overall accuracy and Kappa coefficient of the different frozen soil maps show that the frozen soil maps compiled or simulated by different methods are basically consistent in terms of the spatial distribution pattern, and the inconsistencies are mainly in the boundary areas between permafrost areas and seasonally frozen soil areas.
2021-10-18 View Details
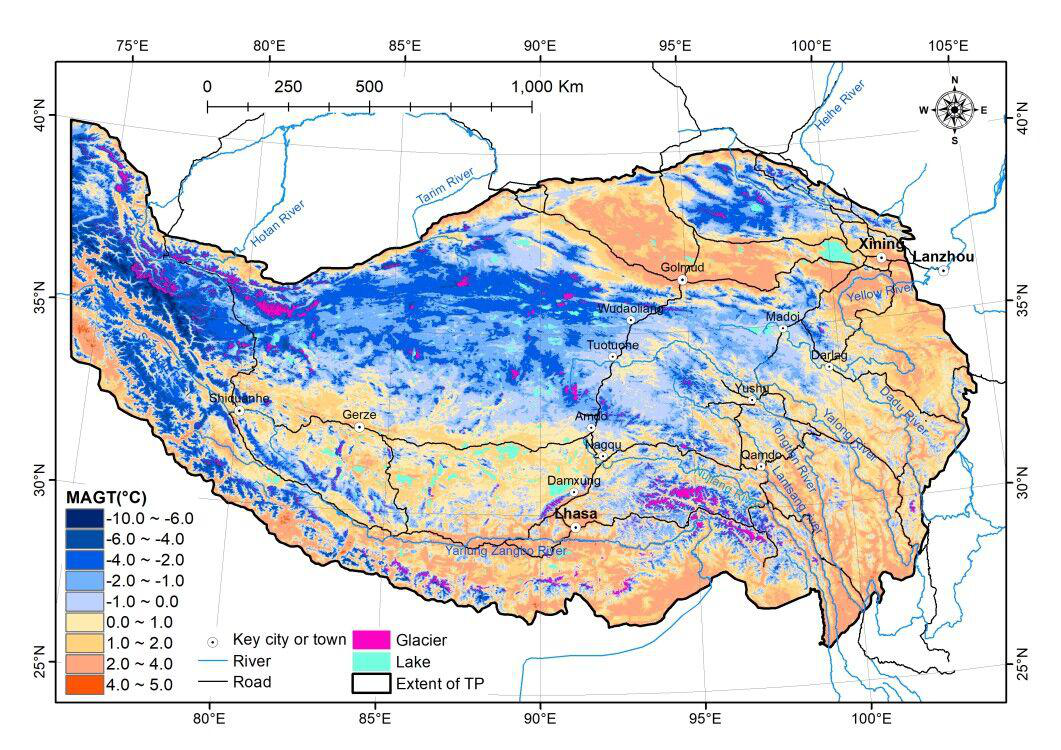
Mean annual ground temperature (MAGT) at a depth of zero annual amplitude and permafrost thermal stability type are fundamental importance for engineering planning and design, ecosystem management in permafrost region. This dataset is produced by integrating remotely sensed freezing degree-days and thawing degree-days, snow cover days, leaf area index, soil bulk density, high-accuracy soil moisture data, and in situ MAGT measurements from 237 boreholes for the 2010s (2005-2015) on the Tibetan Plateau (TP) by using an ensemble learning method that employs a support vector regression (SVR) model based on distance-blocked resampling training data with 200 repetitions. Validation of the new permafrost map indicates that it is probably the most accurate of all available maps at present. The RMSE of MAGT is approximately 0.75 °C and the bias is approximately 0.01 °C. This map shows that the total area of permafrost on the TP is approximately 115.02 (105.47-129.59) *104 km2. The areas corresponding to the very stable, stable, semi-stable, transitional, and unstable types are 0.86*104 km2, 9.62*104 km2, 38.45*104 km2, 42.29*104 km2, and 23.80*104 km2, respectively. This new dataset is available for evaluate the permafrost change in the future on the TP as a baseline. More details can be found in Ran et al., (2020) that published at Science China Earth Sciences.
2021-09-13 View Details
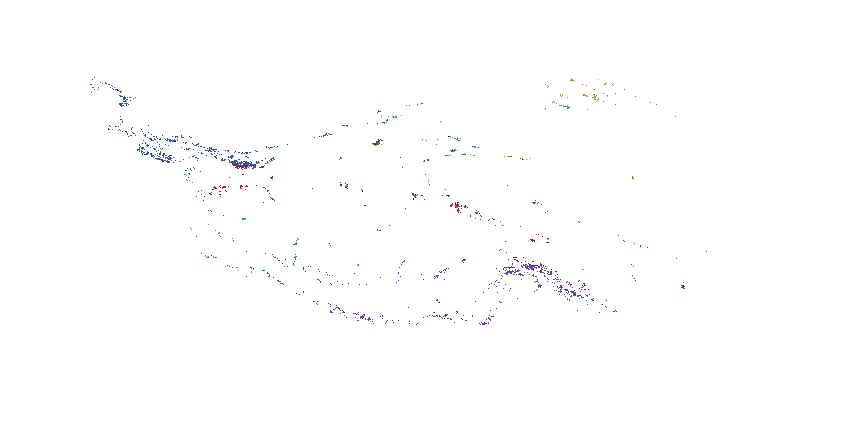
The Tibetan Plateau Glacial Data -TPG1976 is a glacial coverage data on the Tibetan Plateau in the 1970s. It was generated by manual interpretation from Landsat MSS multispectral image data. The temporal coverage was mainly from 1972 to 1979 by 60 m spatial resolution. It involved 205 scenes of Landsat MSS/TM. There were 189 scenes(92% coverage on TP)in 1972-79,including 116 scenes in 1976/77 (61% of all the collected satellite data).As high quality of MSS data is not accessible due to cloud and snow effects in the South-east Tibetan Plateau, earlier Landsat TM data was collected for usage, including 14 scenes of 1980s(1981,1986-89,which covers 6.5% of TP) and 2 scenes in 1994(by 1.5% coverage on TP).Among all satellite data,77% was collected in winter with the minimum effects of cloud and seasonal snow. The most frequent year in this period was defined as the reference year for the mosaic image: i.e. 1976. Glacier outlines were digitized on-screen manually from the 1976 image mosaic, relying on false-colour image composites (MSS: red, green and blue (RGB) represented by bands 321; TM: RGB by bands 543), which allowed us to distinguish ice/snow from cloud. Debris-free ice was distinguished from the debris and debris-covered ice by its higher reflectance. Debris-covered ice was not delineated in this data. The delineated glacier outlines were compared with band-ratio results, and validated by overlapping them onto Google Earth imagery, SRTM DEM, topographic maps and corresponding satellite images. For areas with mountain shadows and snow cover, they were verified by different methods using data from different seasons. For glaciers in deep shadow, Google EarthTM imagery from different dates was used as the reference for manual delineation. Steep slopes or headwalls were also excluded in the TPG1976. Areas that appeared in any of these sources to have the characteristics of exposed ground/basement/bed rock were manually delineated as non-glacier, and were also cross-checked with CGI-1 and CGI-2. Steep hanging glaciers were included in TPG1976 if they were identifiable on images in all three epochs (i.e. TPG1976, TPG2001, and TPG2013). The accuracy of manual digitization was controlled within one half-pixel. All glacier areas were calculated on the WGS84 spheroid in an Albers equal-area map projection centred at (95°E, 30°N) with standard parallels at 15°N and 65°N. Our results showed that the relative deviation of manual interpretation was less than 6.4% due to the 60 m spatial resolution images.
2021-08-30 View Details
Contact Support
Links
National Tibetan Plateau Data CenterFollow Us

A Big Earth Data Platform for Three Poles © 2018-2020 No.05000491 | All Rights Reserved
|  No.11010502040845
Tech Support: westdc.cn