The Regional Estimates of Vegetation Abundance from Large Sites (REVEALS) model was developed by Sugita (2007) to correct for bias due to inter-taxonomic differences in pollen productivity and dispersion and estimate plant cover at a regional spatial scale based on pollen records. We provide the dataset of pollen-based REVEALS reconstruction for temperate and northern sub-tropical China over the Holocene. The REVEALS reconstruction was achieved using 94 selected pollen records from lakes and bogs at a 1˚x1˚ spatial scale and a temporal resolution of 500 years between 11.7 and 0.7 ka BP, and three recent time windows (0.7˗0.35 ka BP, 0.35˗0.1 ka BP, and 0.1 ka BP˗present). The dataset of pollen-based REVEALS reconstruction of Holocene plant cover for the study region includes the REVEALS proportions of plant cover (and related SEs) for 75 1˚x 1˚grid cells and 25 time windows for each grid cell for 27 taxa, two alternatives of aggregation of plant taxa to PFTs: ten PFTs and six PFTs, and three land-cover types. The metadata files providing details on the sites used in the REVEALS reconstruction for each grid cell and each time window. For instance, the original site names, modern vegetation zones, geographical coordinates (latitude and longitude in decimal degrees), elevation in meters above sea level, site types (bog or lake), basin sizes (radius and area), number of 14C radiocarbon dates or other types of dates, approximate temporal extent of the site. The dataset is suitable for palaeoclimate modeling, can be applied also in evaluating simulations of past vegetation from dynamic vegetation models and anthropogenic land cover change (ALCC) scenarios.
LI Furong
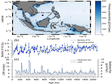
 ratio data from Gonghai Lake over the past ~2000 years")
The data sets contains the content of fungal spores and (Ce+Fa/Po+Fa) ratio data from Gonghai Lake (38°54′N, 112°14′E, altitude 1860 m) in northern China over the past ~2000 years. We calculated pollen (Ce+Fa/Po+Fa) ratio of 321 samples and we identified the fungal spores of 216 sedimentary samples to reconstruct changes in cultivation and grazing intensity over the past ~2,000 years in northern China. Time-series analysis reveals that the arable farming phases had a longer periodicity than the grazing phases, possibly because of the greater resilience of the former to climate change and the attachment of agriculturalists to their land. Our findings potentially help improve our understanding of the impact of land use on soil degradation. The data is stored in Excel format.
HUANG Xiaozhong, ZHANG Jun

Numerical experiments: The climate model used is the fast air sea coupling model (FAMOUS) jointly developed by the British Meteorological Office and British universities The horizontal resolution of the atmospheric model in the FAMOUS model is 5 ° × 7.5 °, 11 layers in vertical direction; The horizontal resolution of the ocean model is 2.5 ° × 3.75 °, 20 layers in vertical direction The atmosphere and ocean are coupled once a day without flux adjustment The tests included the Middle Paleocene (MP,~60Ma BP, test name flat_60ma_1xCO2_sea_3d_ * * 100yr_mean. nc) and the Late Oligocene (LO,~25Ma BP, test name orog_25ma_1xCO2_sea_3d_ * * 100yr_mean. nc) The sea land distribution data is mainly taken from the global coastline basic data set (abbreviated as Gplates, website: http://www.gplates.org/ )Considering that the initial uplift of Cenozoic terrains such as the Qinghai Tibet Plateau started at about 50~55 Ma (Searle et al., 1987), the global terrain height was set to 0 in the MP test to omit the role of plateau terrain. At 25 Ma, Greenland (Zachos et al., 2001) and the Qinghai Tibet Plateau (for example, Wang et al., 2014; Ding et al., 2014; Rowley and Currie, 2006; DeCells et al., 2007; Polisar et al., 2009) were revised The change of ancient latitude is also considered when reconstructing the ancient topography of the Qinghai Tibet Plateau (Besse et al., 1984; Chatterjee et al., 2013; Wei et al., 2013) At the same time, referring to the change of Cenozoic atmospheric CO2 (Beerling and Royer, 2011), the atmospheric CO2 concentration in the two periods of experiments was 280 ppmv (1 ppmv=1 mg L – 1) before the industrial revolution For simplicity, all land vegetation and soil properties are set to globally uniform values, that is, various land surface properties on each land grid point except Antarctica are assigned to the global average value of non glacial land surface before the industrial revolution, which is also convenient for highlighting the impact of land sea distribution and topographic changes In addition, since we mainly discuss the average climate state and its change in the characteristic geological period on the scale of millions of years, we can omit the influence of orbital forcing, that is, the Earth's orbital parameters are set to their modern values in all experiments Output time: All tests were integrated for 1000 years, using the average results of the last 100 years of each test. This data is helpful to explore the formation and evolution mechanism of the Cenozoic monsoon and drought.
LIU Xiaodong

There are 396 temperature-sensitive proxy data for the past millennium over the Northern Hemisphere, including 370 tree rings, 15 ice cores, 9 lake sediments and 2 historical documents; This data is derived from the global temperature proxy dataset released by PAGES2k Consortum in 2017; During the process of temperature assimilation in the past millennium (1000-2000 AD) in the Northern Hemisphere, the data were further screened, and only the data with annual resolution were retained; The proxy data contained in the dataset have passed strict quality inspection and temperature signal verification; The data set can be used to reconstruct the temperature of the Northern Hemisphere at the hemispherical and regional scales for the past millennium.
FANG Miao
 by COSMOS")
The dataset is from the transient experiment TRN40ka in Zhang et al (2021, Nature Geoscience), spanning 40ka-32ka BP with changing orbital parameters. For detailed description of experimental design, please refer to the original paper. Model details: COSMOS (ECHAM5-JSBACH-MPI-OM), a comprehensive fully coupled atmosphere–ocean general circulation model (AOGCM), is used to generate the dataset. The atmospheric model ECHAM5, complemented by the land surface component JSBACH, is used at T31 resolution (∼3.75°), with 19 vertical layers. The ocean model MPI-OM, including sea-ice dynamics that is formulated using viscous-plastic rheology, has a resolution of GR30 (3°×1.8°) in the horizontal, with 40 uneven vertical layers.
ZHANG Xu

Relationship between modern pollen and climate, and its representative to vegetation are the important references in explaining and reconstructing past climate and vegetation qualitatively or quantitatively. To extrct past climate and vegetation signals from fossil pollen spectrum of a lacustrine sediment, a corresponding modern pollen dataset collected from lake-sediment surface is necessary. At present, there are a few modern pollen datasets extracted from lake sediment-surface established on the Tibetan Plateau, however, the geographic gaps (e.g. the central and east Tibetan Plateau) of available sampled lakes influence the correct understanding. To ensure the even distribution of the representative lakes, we collected lake sediment-surface samples (n=117) covering the alpine meadow evenly on the east and central Tibetan Plateau, in July and August 2018. For pollen extraction, approximately 10 g (wet original sediment) per sample were sub-sampled. Pollen sample was processed by the standard acid-alkali-acid procedures followed by 7-μm-mesh sieving. More than 500 terrestrial pollen grains were counted for each sample. Pollen assemblages of the dataset from alpine meadow are dominated by Cyperaceae (mean is 68.4%, maximum is 95.9%), with other herbaceous pollen taxa as commen taxa including Poaceae (mean is 10.3%, maximum is 87.7%), Ranunculaceae (mean is 4.8%, maximum is 33.6%), Artemisia (mean is 3.7%, maximum is 24.5%), Asteraceae (mean is 2.1%, maximum is 33.6%), etc. Salix (mean is 0.4%, maximum is 5.3%) is the major shrub taxon in these pollen assemblages, while arboreal taxa occur with low percentages generally (mean of total arboreal percentages is 0.9% (maximum is 5.8%), including mainly Pinus (mean is 0.3%, maximum is 1.8%), Betula (mean is 0.1%, maximum is 0.9%) and Alnus (mean is 0.1%, maximum is 0.7%). These pollen assemblages represent the plant components well in the alpine meadow communities, although they are influenced slightly by long-distance pollen grain transported by wind or river (such as these arboreal pollen taxa). Together with pollen counts and percentages, we also provided the modern climatic data for the sampled lakes. The China Meteorological Forcing Dataset (CMFD; gridded near-surface meteorological dataset) with a temporal resolution of three hours and a spatial resolution of 0.1° was employed, and the climatic data of the nearest pixel of one sampled lake was defined to represent climatic conditions of the lake. Finally, the mean annual precipitation (Pann), mean annual temperature (Tann) and mean temperature of the coldest month (Mtco) and warmest month (Mtwa) are calculated for each sampled lake.
CAO Xianyong, TIAN Fang, LI Kai, NI Jian
")
1) The data content is the exposure age of the Cosmogenic Nuclide 10Be of the moraine left by the glaciers around the Muztagh Ata peak in the Holocene, including the sampling location, 10Be concentration, calculation results, etc. 2) 10Be concentration data are from published literature. Referring to the latest 10Be yield in the world, three different yield correction methods are used to calculate the exposure age of moraine samples. 3) Compared with the chronological data of the original published literature, this data is more accurate, and the chronological results given by the three methods can be compared with each other, with better concentration within the error range. 4) The data can be used to understand the Holocene change law of glaciers in Pamir region and provide data support for chronological comparison of glacial evolution in the northwest of the plateau.
XU Xiangke, XU Baiqing
")
Karakul lake is the distal proglacial lake of the Muztagh Ata glaciers in Xinjiang, and its material input is mainly affected by glacier changes. The Karakul lake sediment core was drilled in the deepest part of the Karakul Lake (38 ° 26.56 ′ N, 75 ° 03.65 ′ E, water depth of 19m) in June and July, 2013, by the research group of prof. Xubaiqing, Institute of Tibetan Plateau Research. The length of the sediment core was 14.16m. This data set is the geochemical data of the lake sediment core, providing high-resolution (0.2mm) information of geochemical elements' contents. The element data was obtained using the nondestructive X-ray fluorescence (XRF) measurements (Itrax Core Scanner, Sweden). The measurement was performed in the Key Laboratory of Tibetan Environment Changes and Land Surface Processes, Chinese Academy of Sciences. The element content in this data set changes obviously, among which the Zr element, Zr/Rb ratio and Rb/Sr ratio provides the long-term glacier change history in Muztagh Ata region, while Ti element provides the dust change history. These data are of great scientific significance for studying the long-term paleoclimate and environmental change histories in the the westerly-dominated region.
XU Baiqing, ZHANG Xiaolong

(1) Data content: data set of precipitation field of the three poles (Arctic, Antarctic and Qinghai Tibet Plateau) in the past millennium; (2) Data source and processing method: the data is independently produced by the author and is produced by assimilating the precipitation proxy data in the three polar regions through the paleoclimate data assimilation method; (3) Data quality description: there is a high degree of spatial-temporal consistency between the data set and the precipitation data sets measured by multiple instruments (correlation coefficient is above 0.35, P < 0.001; Nash efficiency coefficient is above 0.3). In addition, the correlation coefficient with multiple precipitation data series reconstructed based on proxy data is between 0.2 and 0.6 (P < 0.001); (4) It can be used to study the temporal and spatial changes of precipitation in the past millennium in the three polar regions.
FANG Miao

(1) Data content: Millennial temperature (near-surface air temperature anomaly based on the millinnial mean)datasets over the three poles, e.g., Arctic, Antarctic, and Qinghai-Tibet Plateau; (2) Data sources and processing methods: These datasets were produced by the authors themselves using the paleoclimate data assimilationand approach based on climatic proxies over the three poles; (3) Description of data quality: There are high spatio-temporal consistency between these datasets and several instrumental gridded temperature datasets (correlation coefficient above 0.6, p <0.001; Nash efficiency coefficient above 0.5). In addition, the correlations between these datasets and several proxy-based temperature series are between 0.4 and 0.8 (p <0.001). (4) Data application achievements and prospects: These datasets can be used to investigate the temporal and spatial variations in temperature over the three poles during the past millennium.
FANG Miao

This data is the sediment record of Qingtu Lake in the middle and lower reaches of Shiyang River Basin, including sediment indicators of qth01 and qth02 Lake profiles. Shiyang River Basin is located in 100 ° 57'~ 104 ° 57' e, 37 ° 02'~ 39 ° 17' n, with a total length of more than 300 kilometers and a total area of 4.16 × 10⁴km2。 The basin is located in the transitional zone between the northwest arid region and the eastern monsoon region, and has a unique climate model. Modern climatological research shows that the hydrological changes in this region are intense, the ecosystem is fragile, and it is very sensitive to global climate change. The two profiles qth01 and qth02 involved in this data have geographical coordinates of 39 ° 03 ′ n 103 ° 40 ′ E and an altitude of 1309m. The depth of the profile is 692cm (qth01) and 736cm (qth02) respectively. AMS14C radiocarbon dating was carried out in the dating Laboratory of Peking University and pretreated in the pretreatment Laboratory of Lanzhou University. The dating samples should try to avoid the layers and sand layers with more plant roots. Radiocarbon 14C dates were calibrated using oxcal v4.4.2 and intcal20 atmospheric profiles. The mineral composition of sediment was determined by x'pert Pro MPD, and the particle size of sediment was determined by Mastersizer 2000 laser diffraction particle size analyzer. The above experiments were completed in the key experiment of the Ministry of western environmental education of Lanzhou University. Grain size data qth01 and qth02 profiles are sampled and measured at 2cm intervals, mineral data qth01 is sampled and measured at 10cm intervals, and qth02 is sampled and measured at 20cm intervals. The fluctuation of grain size and mineral content shows the significant climate change since the Holocene in the middle and lower reaches of Shiyang River, and the climate was relatively dry in the early Holocene (11.0 - 7.4 cal. kyr BP); The middle Holocene (7.4 - 4.7 cal. kyr BP) was in a climate suitable period; In the late Holocene (4.7 - 0 cal. kyr BP), the trend of aridity was obvious, and this aridity became intensified after 1.6 cal. kyr BP.
LI Yu
")
1) The data include annual scale oxygen isotope and accumulation records of ice cores from 1900 to 2011, which respectively reflect the temperature and precipitation changes in the study area; 2) For analysis, the ice core samples were first measured using Picaro δ 18O and as per δ The seasonal variation characteristics of 18O determine the age of ice core; The accumulation of ice cores is calculated according to the density of ice cores, the length of ice cores per year and the glacier flow model; 3) Professional laboratory personnel and front-line scientific research personnel operate and maintain the instrument to ensure the reliability of analysis data; 4) The data can be used to analyze the climate and environmental changes in the typical westerly region of the Qinghai Tibet Plateau over the past 100 years, and can be used to explore the evolution of glaciers in this period, providing scientific reference for predicting the future evolution of glaciers, changes in hydrology and water resources and their impact on human activities.
XU Baiqing

The data of Cenozoic plant macrofossils on the Qinghai Tibet Plateau includes leaves, seeds and fruits. It includes Latin and Chinese names of families, genera and species, times, places of origin, morphological descriptions, discussions, specimens and references. The species names are assigned according to the original literature. For fossil records revised by later research, the revised records were chosen; The age of the origin (fossil site) is assigned according to the latest literature. The terms and description paradigm of leaf shape description are referred to the book "Leaf Structure Manual"; The length, angle, and other measurement data in the description are derived from the original literature. The fossil records of the document are sorted alphabetically by Latin initials of families and genera. The data can provide important clues for studying the coupling relationship between the environmental climate changed and the evolution of vegetation and plant diversity in the Cenozoic Qinghai Tibetan Plateau.
ZHOU Zhekun , LIU Jia , CHEN Linlin , ROBERT Spicer , LI Shufeng , HUANG Jian , ZHANG Shitao , HUANG Yongjiang , JIA Linbo , HU Jinjin , SU Tao
")
This data is the plant diversity and distribution data of the chnab005 grid on the Qinghai Tibet Plateau, including the Chinese name, Latin name, latitude and longitude, altitude, collection number, number of molecular materials, number of specimens, administrative division, small place, collector, collection time and creator of the plants in this grid. This data is obtained from e-Science website( http://ekk.kib.ac.cn/web/index/#/ )And partially complete the identification. This data has covered the list of plants in this flora and the specific distribution information. This data can be used not only to study the floristic nature of this region, but also to explore the horizontal and vertical gradient pattern of plants in this region. What is different from last year is that the grid with the most scientific research data this year has changed, which may be affected by the epidemic or the environment.
DENG Tao
")
The Himalayas is the most majestic, tall and young folded mountain system on earth. Before Eocene, the Himalayas were in a long-term sinking shallow sea environment. Under the action of extremely strong Himalayan movement, the Himalayas rose from the sea. By the end of tertiary, it had risen to a high mountain with an average height of more than 3000 meters. Therefore, under the influence of global climate change, Mount Everest has experienced several major Pleistocene glaciations, leaving behind various glacial related sediments and interglacial deposits. In 1960, the scientific investigation team of the Chinese Everest mountaineering team and the scientific investigation team of the Chinese xishabangma mountaineering team in 1964 conducted a more detailed investigation on the glaciers and other Quaternary sediments in the two peaks and their adjacent areas. During the scientific investigation of Mount Qomolangma from 1966 to 1968, on the basis of previous work, the Quaternary glacial deposits characteristic of this area were further investigated, and the research on various deposits in interglacial period and post glacial period was strengthened, so as to find some complete and typical quaternary stratigraphic profiles. This data set comes from the field investigation of the scientific research team in this book. Outline This paper introduces the spatial distribution characteristics of Quaternary sediments, focuses on several main quaternary stratigraphic profiles, preliminarily establishes the sequence of Quaternary strata in this area and discusses the age of strata. It lays a foundation for in-depth discussion of Quaternary glaciation, paleoclimate and the rise of Himalayas in this area.
Tibetan Scientific Expedition of the Chinese Academy of Sciences
")
This data is the runoff data of nalun hydrological station in the upper reaches of the SYR River from 1753 to May to August 2017 reconstructed based on tree ring data. It is obtained from the tree ring hydrological research jointly carried out by Urumqi desert Meteorological Institute of China Meteorological Administration and the Institute of water and Hydropower of the Kyrgyz National Academy of Sciences. The data can be used for scientific research such as water resources assessment and water conservancy projects in mountainous areas of Central Asia, and the observation time is the calibration period, The linear transformation equation of runoff and tree ring data is established to reconstruct the path quantity. Data period: 1753 to 2017. Data element: average runoff from May to August (m3 / s) Station location: 41.43 ° ″ n, 76.02 ° ″ e, 2039m
ZHANG Ruibo

This data includes 50 14C dating data of 5 Lake cores (ANGREN jincuo, Yilong lake, guozhaco, bangdaco and gongzhucuo). The age control of lake sediment cores depends on radiocarbon isotope (14C) dating. The chemical treatment and analysis test of this batch of samples were completed in Miami beta laboratory and Peking University in the United States. The test time was 2018-2022. The test process was carried out in strict accordance with relevant standards. The data sheet includes the lake core sample number, laboratory sample number, dating sample depth, 14C dating results, dating error and corrected results, etc. Good chronological control is the basis of paleoenvironmental reconstruction.
HOU Juzhi, WU Duo

This data includes carbonate oxygen isotope data and core age data of Xingyun Lake sediments. The first column: core depth, the second column: core age frame (CAL yr BP), and the third column: carbonate oxygen isotope data. The core of Xingyun Lake is 745cm long and 14ka old. There are 149 carbonate oxygen isotope data. The summer precipitation records in Xingyun Lake since the past 14 Ka have been reconstructed by using carbonate oxygen isotopes in the sediments of Xingyun Lake. The reconstruction results show that the summer precipitation of mingmingyun Lake Basin in early Holocene is high; Since the middle Holocene, summer precipitation has gradually decreased, which is mainly controlled by summer solar radiation.
WU Duo

1) Data content: The paleomagnetic data can establish the paleomagnetic time frame of huatougou section, and the grain size, magnetic indexes and geochemical indexes can restore the climate change in geological history. 2) Data sources and processing methods Data sources are experimental data. Paleomagnetic data: 2x2x2 cm cylindrical samples were drilled with a small gasoline drill and measured in a magnetic shielding chamber with a cryogenic superconducting magnetometer. Magnetic data: The samples collected in the field were ground into fine particles in a 2x2x2 non-magnetic plastic box with a mortar, and tested with a Kapobridge magnetometer, pulse magnetometer and rotary magnetometer. Grain size data: Analysis of decomposed samples using a Malvern Mastersizer 2000 particle size analyzer. Prior to analysis, organic matter was removed with hot hydrogen peroxide and then carbonate was removed with hydrochloric acid in accordance with standard Procedures of Lanzhou University. Geochemical data: Take a small amount of samples to be pounded with agate mortar and ground into powder, and then sieve with a 200-mesh sieve to ensure that the samples meet test standards. After all the samples were ground and sifted, the samples were placed lightly in the groove of the slide and scraped to be flush with the surrounding slide. A PANalytical X 'Pert Pro MPD Polycrystal X-ray diffractometer was used as the test instrument. 3) Data quality Sample collection and experimental processing were carried out in accordance with strict standards, and the data obtained were of reliable quality. 4) Data application achievements and prospects Two SCI papers were published using these data, one of which was Ni.
NIE Junsheng
Contact Support
Links
National Tibetan Plateau Data CenterFollow Us

A Big Earth Data Platform for Three Poles © 2018-2020 No.05000491 | All Rights Reserved
|  No.11010502040845
Tech Support: westdc.cn