
Brief Introduction:The Tibetan Plateau, known as the " third pole " of the earth, has always been the focus of attention of the international community because it is an important area driving global environmental change research and has a profound regulatory effect on the ecology, environment and climate of the whole earth. Under the background of global warming, the cryosphere elements such as tripolar glaciers, frozen soils, and freeze-thaw lakes have undergone significant changes, with glaciers shrinking rapidly and permafrost active layers thickening. For a long time, China has carried out systematic and multidisciplinary research in the world ' s third pole with the Qinghai-Tibet Plateau as the main body, forming a rich research accumulation.
Publish Datetime:2022-12-13
Number of Datasets:184

The water level observation data set of lakes on the Tibetan Plateau contains the daily variations of water levels for three lakes: Zhari Namco, Bamco and Dawaco. The lake water level was obtained by a HOBO water level gauge (U20-001-01) installed on the lakeshore, then corrected using the barometer installed on the shore or pressure data of nearby weather stations, and then the real water level changes were obtained. The accuracy was less than 0.5 cm. The items of this data set are as follows: Daily variation data of water level in Zhari Namco from 2009 to 2014; Daily variation data of water level in Bamco from 2013 to 2014; Daily variation data of water level in Dawaco from 2013 to 2014. Water level, unit: m.
2022-11-20 View Details
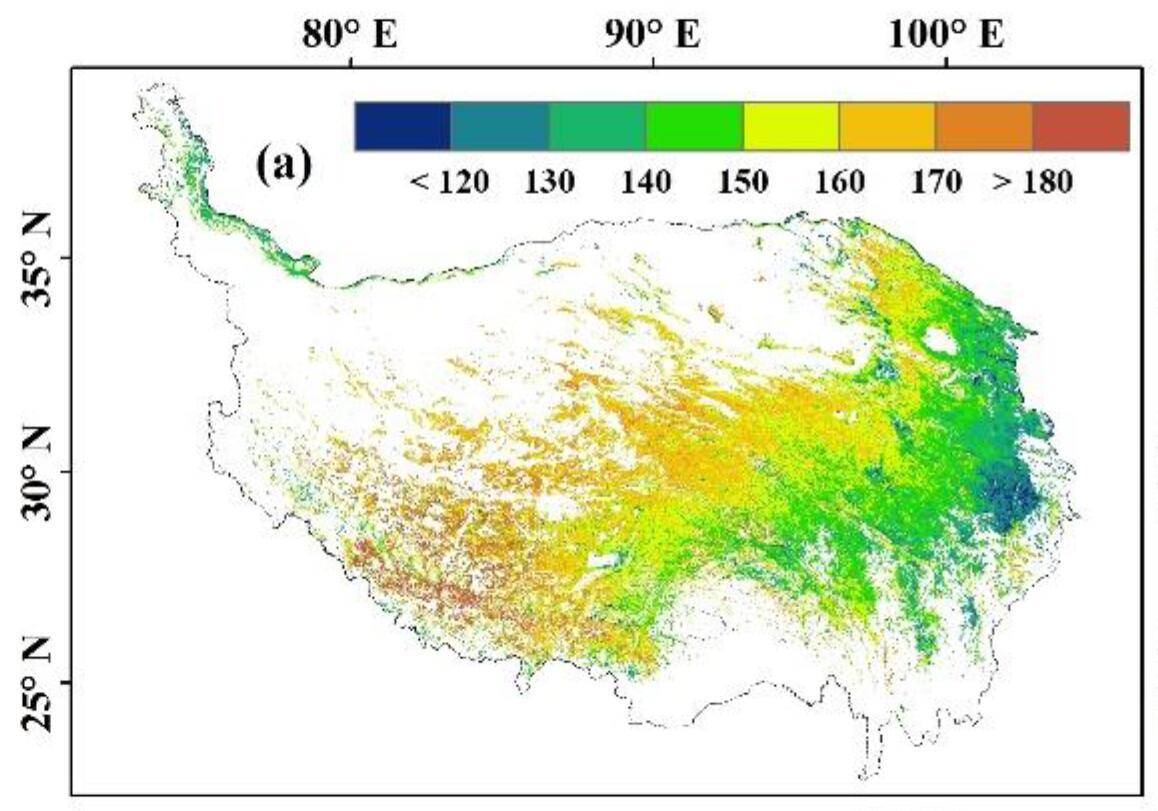
This phenological data is based on the MOD13A2 data of the Qinghai Tibet Plateau from 2000 to 2015 (with a temporal resolution of 16 days and a spatial resolution of 1km). The NDVI curve is fitted using the segmented Gaussian function in the TIMESAT software. The spring phenology, autumn phenology and the length of the growth season are extracted using the dynamic threshold method. The thresholds of spring phenology and autumn phenology are set to 0.2 and 0.7 respectively. The phenological data were masked. Among them, the mask rules are: 1) The maximum value of NDVI must be met between June and September; 2) The average value of NDVI from June to September shall not be less than 0.2; 3) The average NDVI in winter shall not exceed 0.3.
2022-10-24 View Details
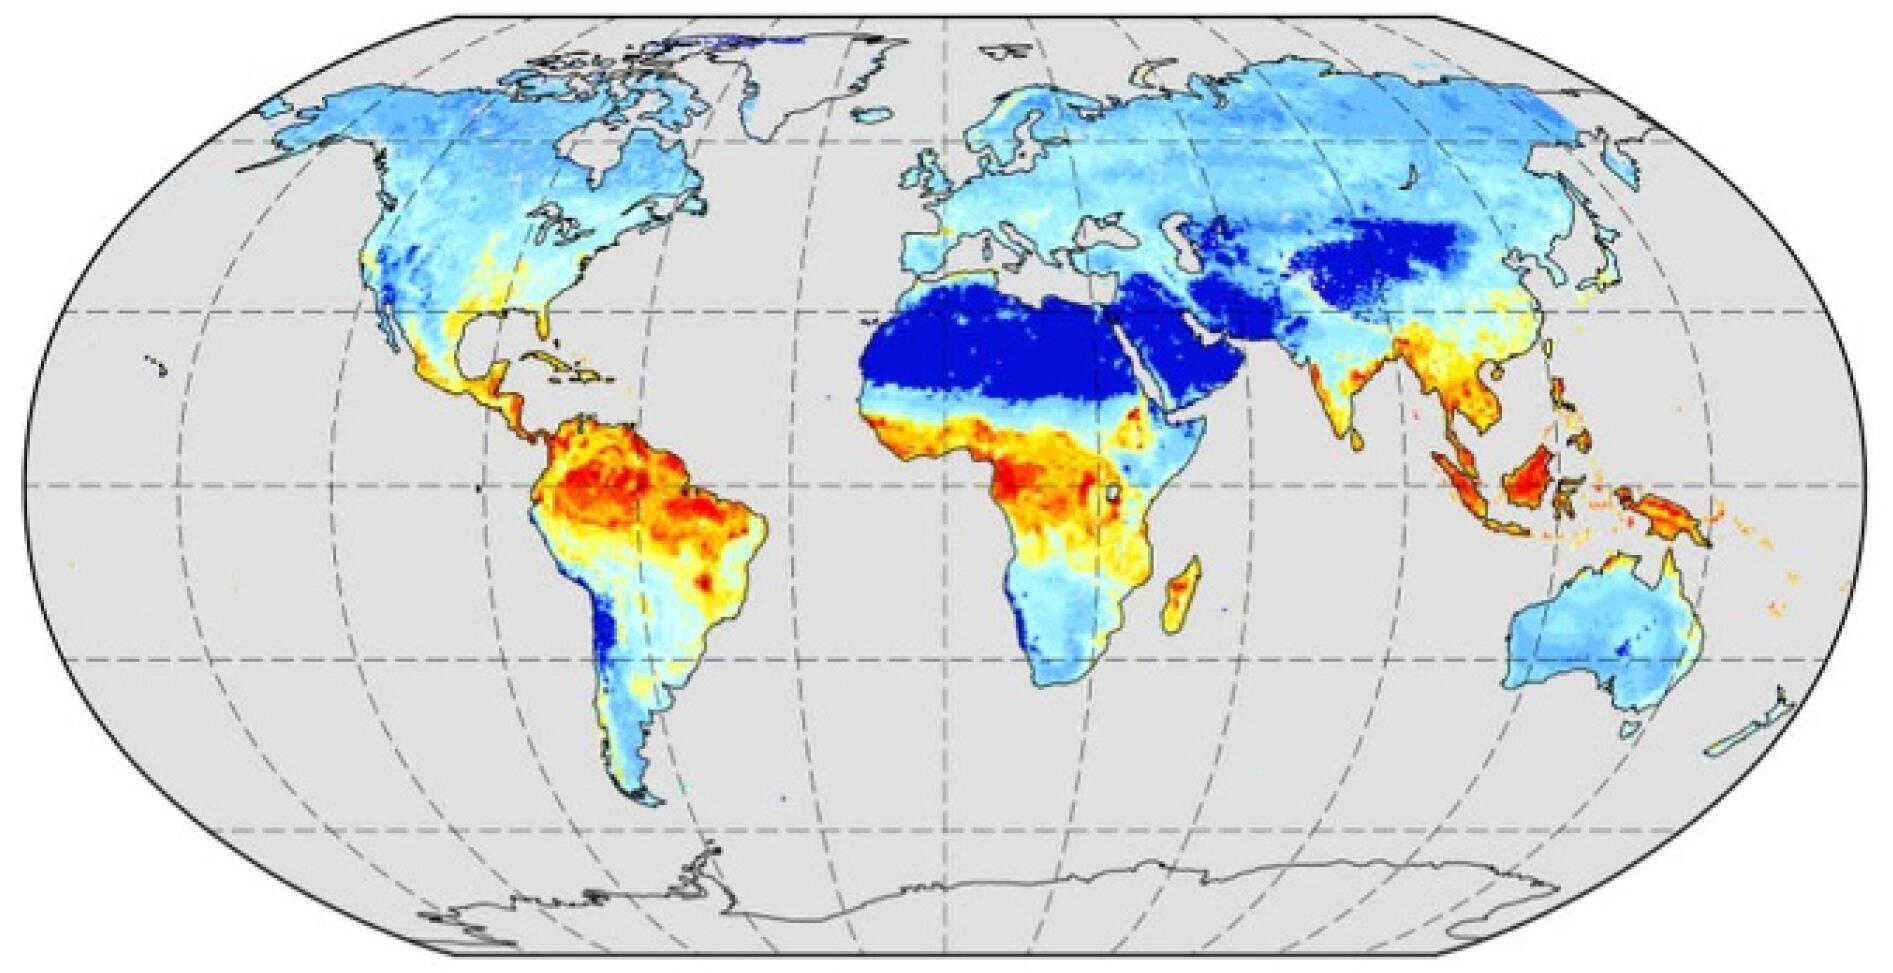
This data set is the global vegetation productivity data, including total primary productivity (GPP), net primary productivity (NPP) and net ecosystem productivity (NEP). It is simulated by BCC-ESM1 model in Phase 6 of the Coupling Model Comparison Plan (CMIP6) under the historical scenario. The data time range is 1850-2014, the time resolution is month, and the spatial resolution is about 2.8125 °. Analog Data Details Visible Link https://www.wdc-climate.de/ui/cmip6?input=CMIP6.CMIP.BCC.BCC -ESM1。
2022-10-24 View Details
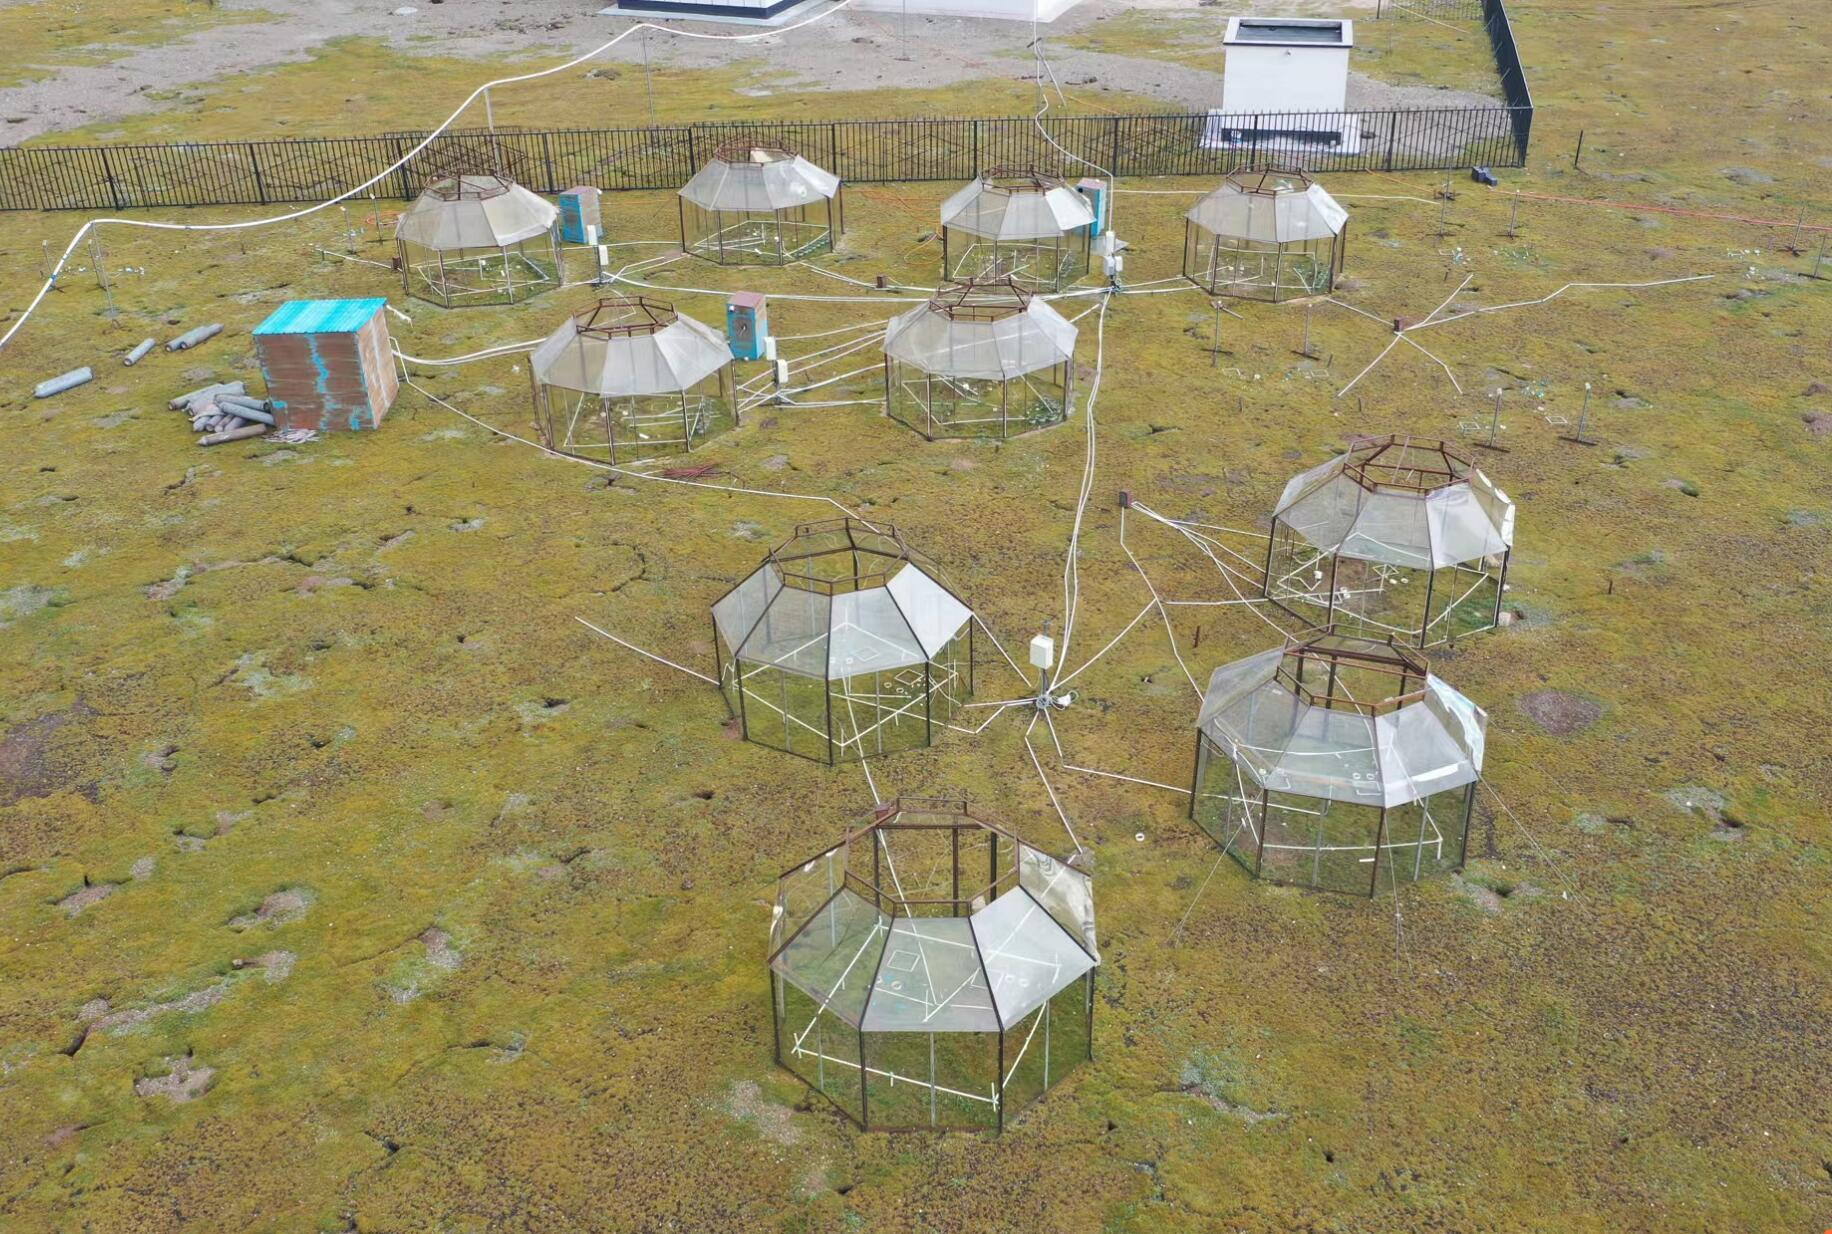
The feedback of the biosphere to the atmosphere is one of the core contents of global change research. When the atmospheric CO2 concentration rises, the behavior of the terrestrial ecosystem is the main uncertainty factor to predict this feedback effect. Elevated CO2 concentration (eCO2) can directly stimulate plant growth and ecosystem C absorption by increasing carboxylation and inhibiting photorespiration rate. Through the impact of CO2 fertilization effect (CFE) on photosynthesis and carbon sequestration, the terrestrial ecosystem can buffer the surge of atmospheric CO2 concentration, thereby slowing down climate change. In order to study the impact of CO2 enrichment on vegetation productivity, CO2 enrichment experiments were conducted at Naqu Grassland Station (31 ° 38 ′ 31 ″ N, 92 ° 00 ′ 54 ″ E, 4600m above sea level) in the north of the Qinghai Tibet Plateau. The test is designed in zones, with CO2 as the main treatment factor and N as the secondary treatment factor; A total of four experimental treatments span two CO2 concentration levels [ambient CO2 (aCO2), increased CO2 (eCO2):+100ppm]. Considering the low vegetation height and windy weather in the study area, octagonal open top chambers (OTCs) are used to control the carbon dioxide concentration, rather than the free FACE system. The design height of OTC is 2.5 meters, the length of each side is 1.5 meters, and each OTC occupies 7.7 square meters.
2022-10-24 View Details
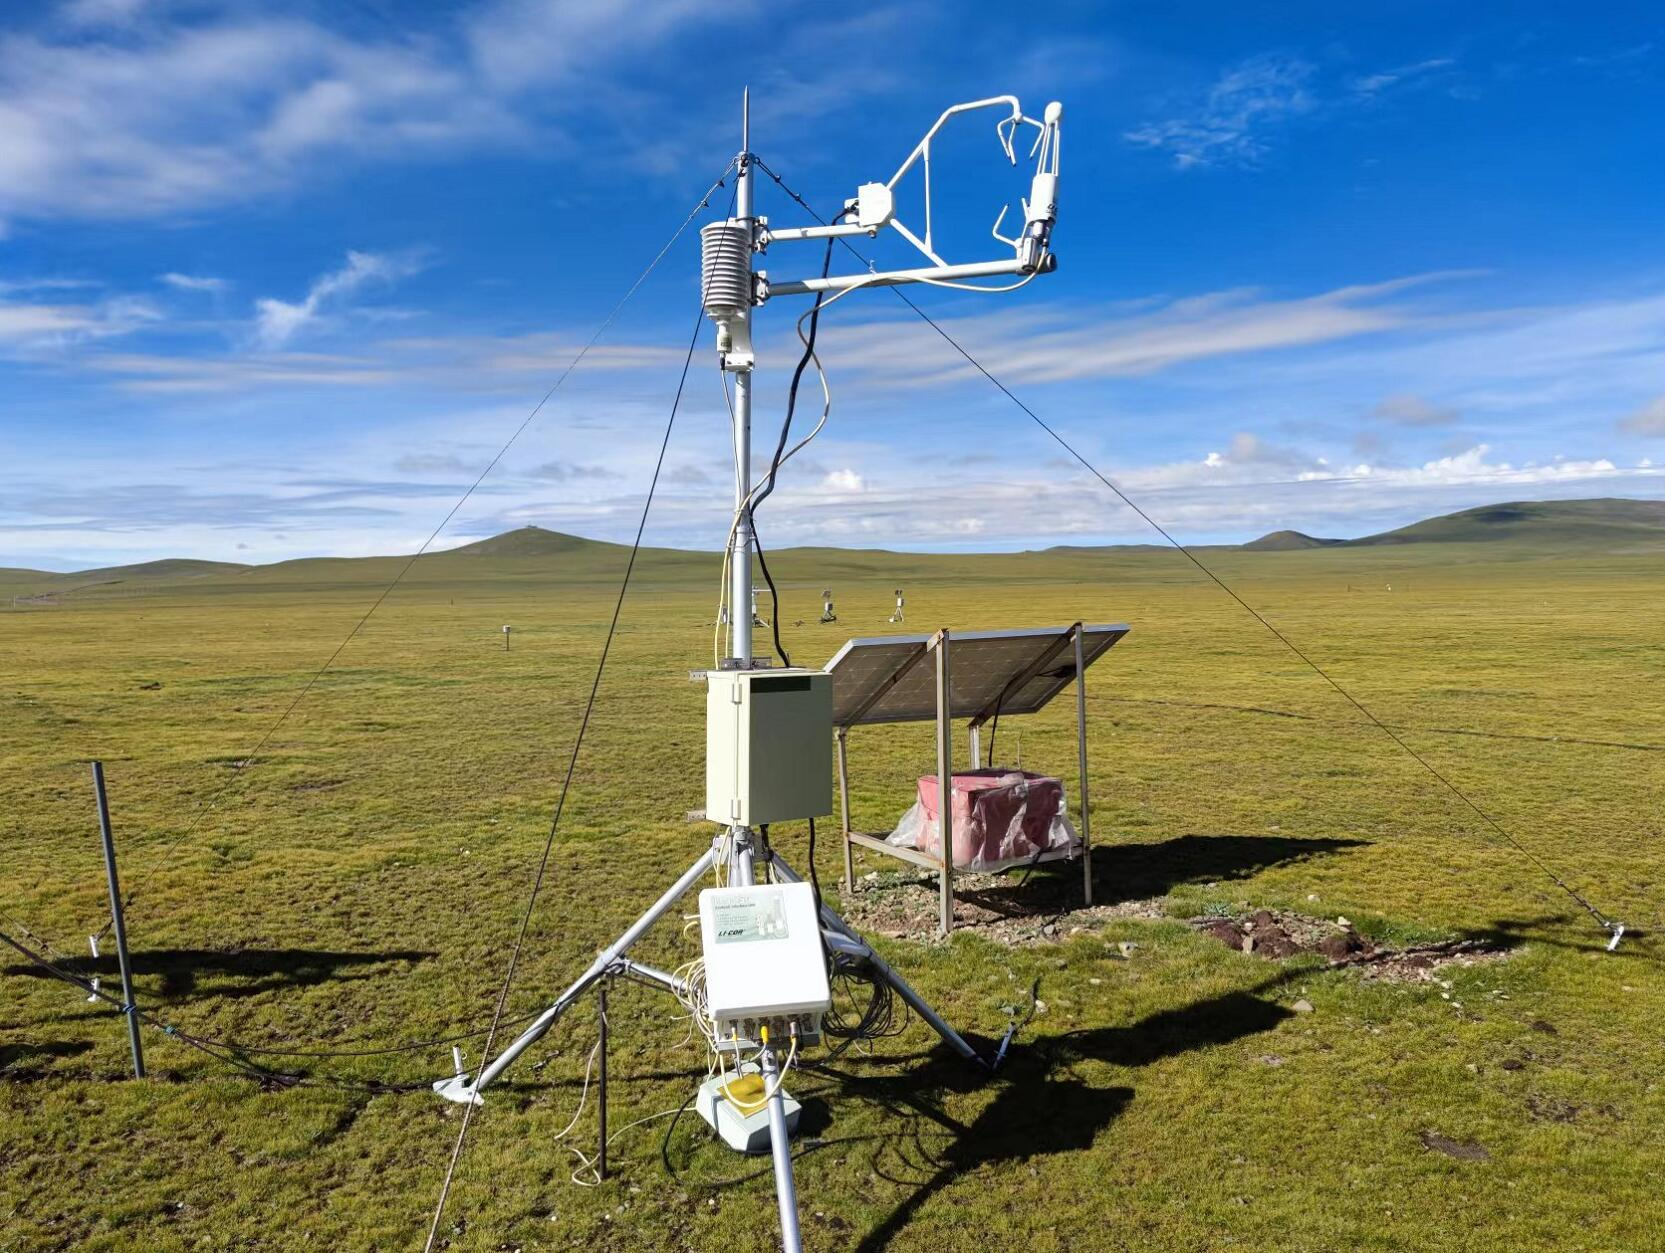
This dataset is the daily vorticity related flux observation data of Naqu flux station (31.64 ° N 92.01 ° E, 4598 m a.s.l.), including net ecosystem productivity (NEP), total primary productivity (GPP), ecosystem respiration (ER), evapotranspiration, latent heat, sensible heat, air temperature, relative humidity, wind speed, soil temperature, soil moisture and other data. The main steps of data pre-processing include wild point removal (± 3 σ)、 Coordinate axis rotation (3D wind rotation), Webb Pearman Leuning correction, outlier elimination, carbon flux interpolation and decomposition, etc. Missing data are interpolated through the nonlinear empirical formula between CO2 flux value (Fc) and environmental factors.
2022-10-21 View Details
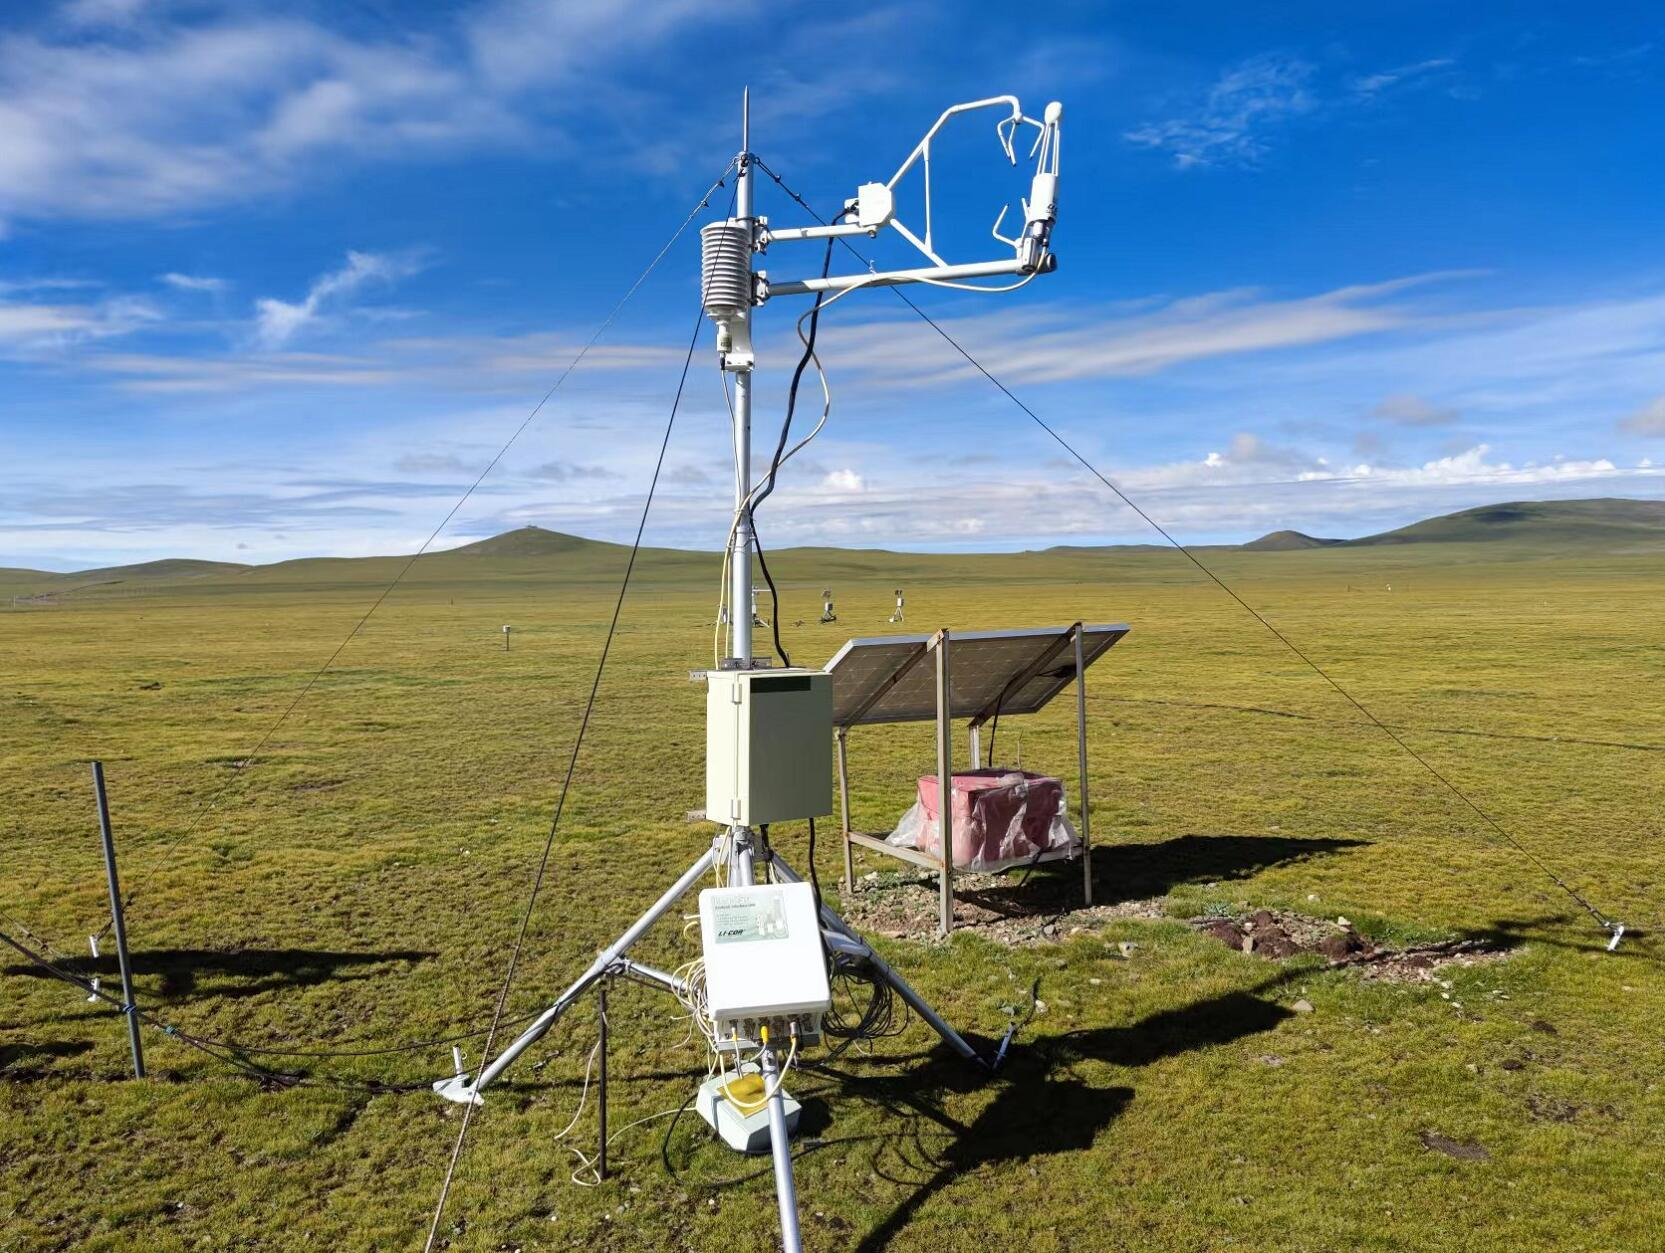
This data set is the daily vorticity related flux observation data of Naqu flux station (31.64 ° N 92.01 ° E, 4598 m a.s.l.), including ecosystem net ecosystem productivity (NEP), total primary productivity (GPP) and ecosystem respiration (ER) data. The main steps of data pre-processing include wild point removal (± 3 σ)、 Coordinate axis rotation (3D wind rotation), Webb Pearman Leuning correction, outlier elimination, carbon flux interpolation and decomposition, etc. Missing data are interpolated through the nonlinear empirical formula between CO2 flux value (Fc) and environmental factors.
2022-10-21 View Details
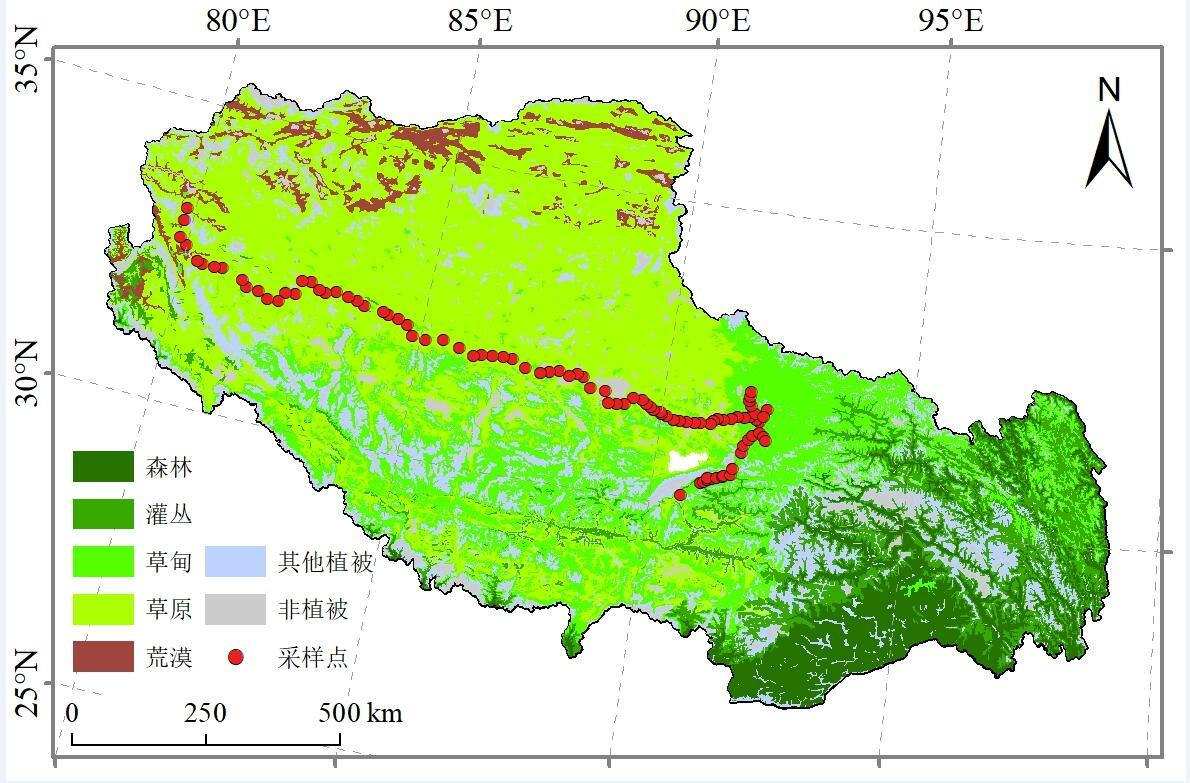
Vegetation survey data is essential for the study of ecosystem structure and function. The Qinghai Tibet Plateau contains a vast grassland ecosystem, mainly including alpine meadow, alpine grassland, and alpine desertification grassland. Due to the unique geographical location and high altitude anoxic environmental conditions, the community survey data in the northern Tibetan Plateau is relatively scarce. This data set includes the aboveground biomass and coverage data of 47 sampling points on the northern Tibet transect in 2019, and the sampling time is from July to August. The sample size is 50cm × 50cm, dry weight of the plant is weighed after drying. This data set can be used for spatial analysis of productivity and calibration of models.
2022-10-21 View Details
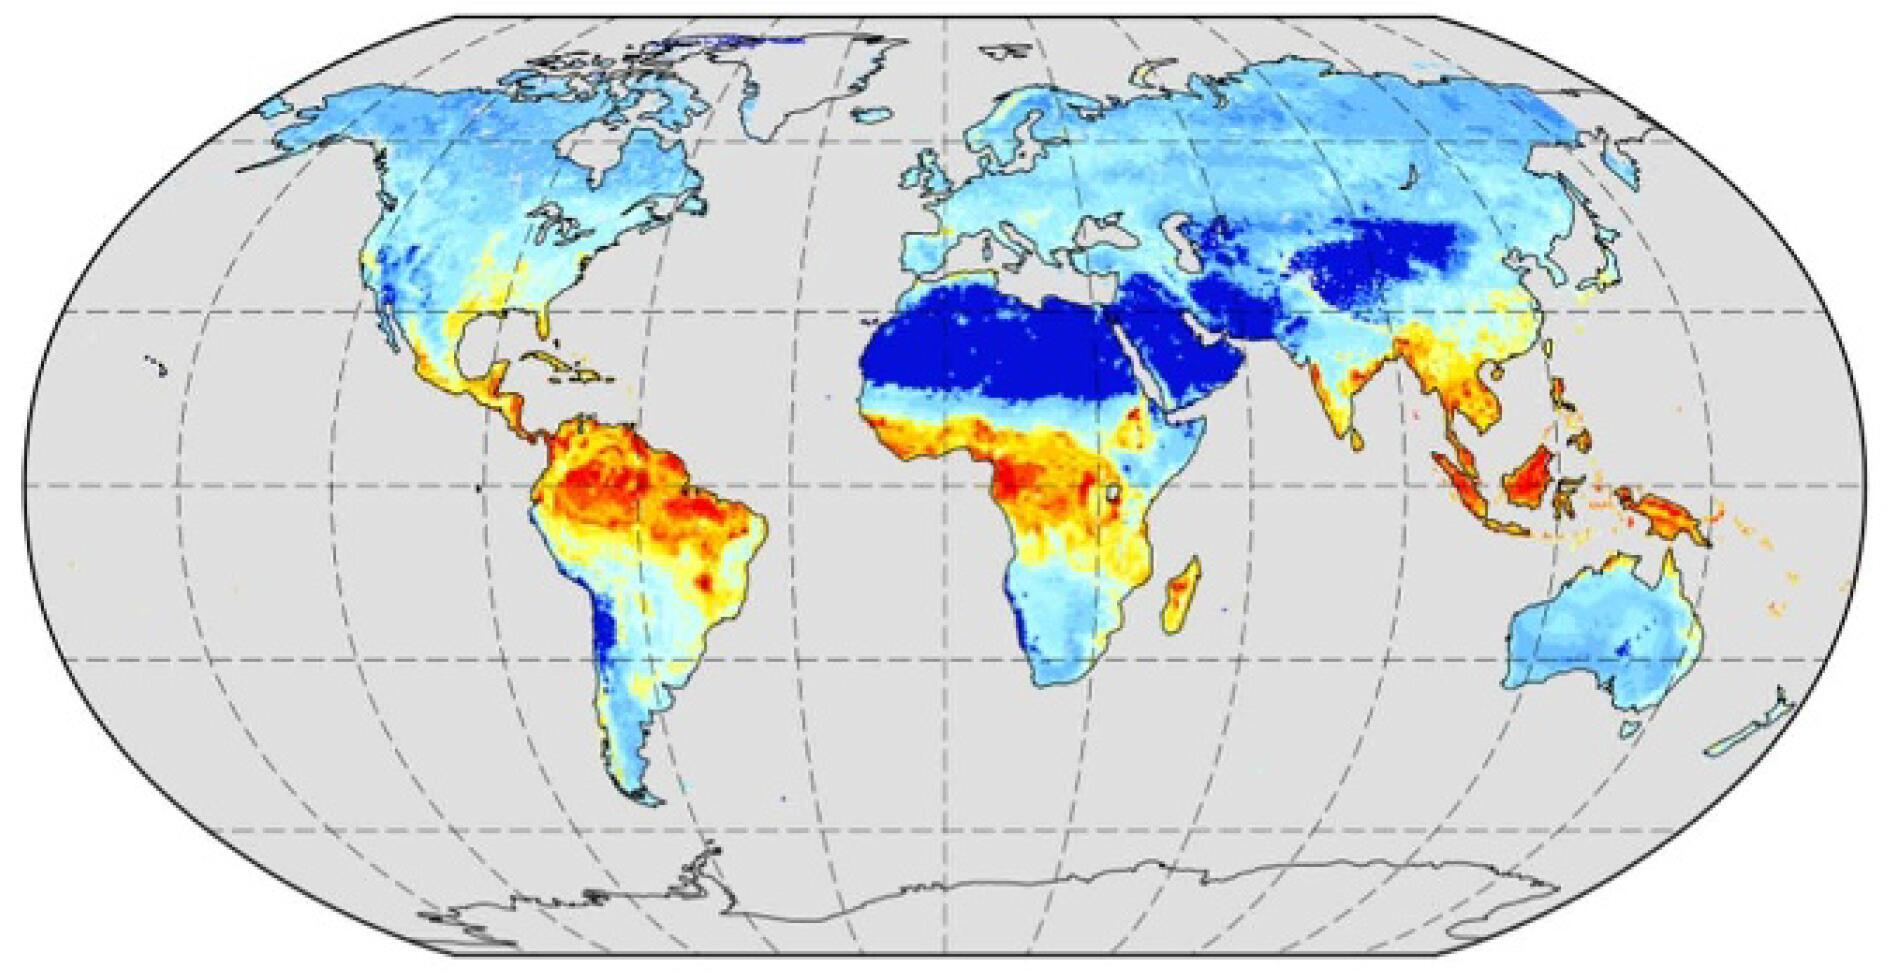
This dataset is global respiration data, including autotrophic respiration (ra) and heterotrophic respiration (rh). It is simulated by TaiESM1 model in Phase 6 of the Coupling Model Comparison Plan (CMIP6) under historical scenarios. The data time range is 1850-2014, the time resolution is month, and the spatial resolution is about 0.9 ° x1.25 °. Analog Data Details Visible Link https://www.wdc-climate.de/ui/cmip6?input=CMIP6.CMIP.AS -RCEC.TaiESM1.historical。
2022-10-20 View Details
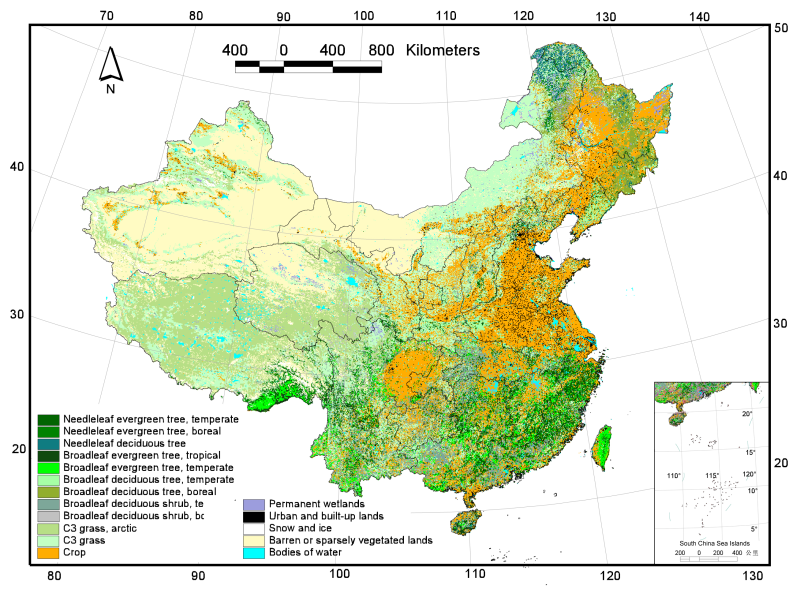
Plant functional types (PFT) is a combination of large plant species according to the ecosystem function and resource utilization mode of plant species. Each planting functional type shares similar plant attributes, which simplifies the diversity of plant species into the diversity of plant function and structure.The concept of plant-functional has been advocated by ecologists especially ecosystem modelers.The basic assumption is that globally important ecosystem dynamics can be expressed and simulated through limited plant functional types.At present, vegetation-functional model has been widely used in biogeographic model, biogeochemical model, land surface process model and global dynamic vegetation model. For example, the land surface process model of the national center for atmospheric research (NCAR) in the United States has changed the original land cover information into the applied plant-functional map (Bonan et al., 2002).Functional plant has been used in the dynamic global vegetation model (DGVM) to predict the changes of ecosystem structure and function under the global change scenario. 1. Functional classification system of Plant 1 Needleleaf evergreen tree, temperate 2 Needleleaf evergreen tree, boreal 3 Needleleaf deciduous tree 4 Broadleaf evergreen tree, tropical 5 Broadleaf evergreen tree, temperate 6 Broadleaf deciduous tree, tropical 7 Broadleaf deciduous tree, temperate 8 Broadleaf deciduous tree, boreal 9 Broadleaf evergreen shrub, temperate 10 Broadleaf deciduous shrub, temperate 11 Broadleaf deciduous shrub, boreal 12 C3 grass, arctic 13 C3 grass 14 C4 grass 15 Crop 16 Permanent wetlands 17 Urban and built-up lands 18 Snow and ice 19 Barren or sparsely vegetated lands 20 Bodies of water 2. Drawing method China's 1km plant function map is based on the climate rules of land cover and plant function conversion proposed by Bonan et al. (Bonan et al., 2002).Ran et al., 2012).MICLCover land cover map is a blend of 1:100000 data of land use in China in 2000, the Chinese atlas (1:10 00000) the type of vegetation, China 1:100000 glacier map, China 1:10 00000 marshes and MODIS land cover 2001 products (MOD12Q1) released the latest land cover data, using IGBP land cover classification system.The evaluation shows that it may be the most accurate land cover map on the scale of 1km in China.Climate data is China's atmospheric driven data with spatial resolution of 0.1 and temporal resolution of 3 hours from 1981 to 2008 developed by he jie et al. (2010).The data incorporates Princeton land-surface model driven data (Sheffield et al., 2006), gewex-srb radiation data (Pinker et al., 2003), TRMM 3B42 and APHRODITE precipitation data, and observations from 740 meteorological stations and stations under the China meteorological administration.According to the evaluation results of RanYouhua et al. (2010), GLC2000 has a relatively high accuracy in the current global land cover data set, and there is no mixed forest in its classification system. Therefore, the mixed forest in the MICLCover land cover diagram USES GLC2000 (Bartholome and Belward, 2005).The information in xu wenting et al., 2005) was replaced.The data can be used in land surface process model and other related researches.
2022-10-17 View Details
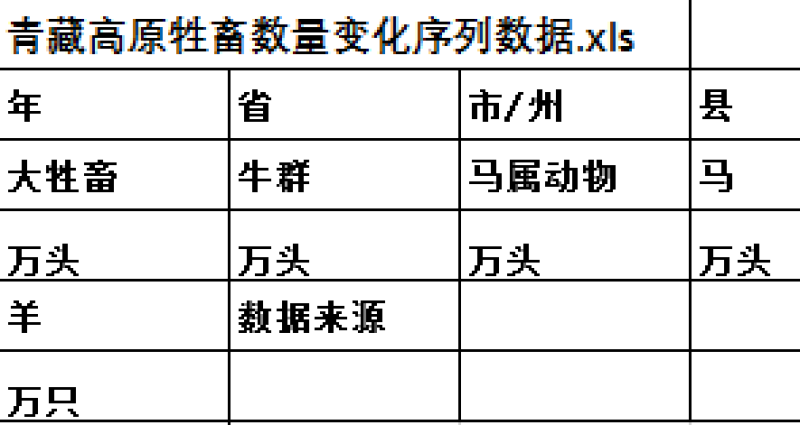
This data set contains sequence data of the number variation of livestock in the major cities and counties of the Tibetan Plateau from 1970 to 2006. It is used to study the social and economic changes of the Tibetan Plateau. The table has ten fields. Field 1: Year Interpretation: Year of the data Field 2: Province Interpretation: The province from which the data were obtained Field 3: City/Prefecture Interpretation: The city or prefecture from which the data were obtained Field 4: County Interpretation: The name of the county Field 5: Large livestock (10,000) Interpretation: The number of large livestock such as cattle, horses, mules, donkeys, and camels. Field 6: Cattle herd (10,000) Interpretation: Number of cattle Field 7: Equine animals(10,000) Interpretation: The number of equine animals such as horses, mules and donkeys. Field 8: Horses (10,000) Interpretation: The number of horses Field 9: Sheep (10,000) Interpretation: The number of sheep Field 10: Data Sources Interpretation: Source of Data The data come from the statistical yearbook and county annals. Some are listed as follows. [1] Gansu Yearbook Editorial Committee. Gansu Yearbook [J]. Beijing: China Statistics Press, 1984, 1988-2009 [2] Statistical Bureau of Yunnan Province. Yunnan Statistical Yearbook [J]. Beijing: China Statistics Press, 1988-2009 [3] Statistical Bureau of Sichuan Province, Sichuan Survey Team. Sichuan Statistical Yearbook [J]. Beijing: China Statistics Press, 1987-1991, 1996-2009 [4] Statistical Bureau of Xinjiang Uighur Autonomous Region . Xinjiang Statistical Yearbook [J]. Beijing: China Statistics Press, 1989-1996, 1998-2009 [5] Statistical Bureau of Tibetan Autonomous Region. Tibet Statistical Yearbook [J]. Beijing: China Statistics Press, 1986-2009 [6] Statistical Bureau of Qinghai Province. Qinghai Statistical Yearbook [J]. Beijing: China Statistics Press, 1986-1994, 1996-2008. [7] County Annals Editorial Committee of Huzhu Tu Autonomous County. County Annals of Huzhu Tu Autonomous County [J]. Qinghai: Qinghai People's Publishing House, 1993 [8] Haiyan County Annals Editorial Committee. Haiyan County Annals[J]. Gansu: Gansu Cultural Publishing House, 1994 [9] Menyuan County Annals Editorial Committee. Menyuan County Annals[J]. Gansu: Gansu People's Publishing House, 1993 [10] Guinan County Annals Editorial Committee. Guinan County Annals [J]. Shanxi: Shanxi People's Publishing House, 1996 [11] Guide County Annals Editorial Committee. Guide County Annals[J]. Shanxi: Shanxi People's Publishing House, 1995 [12] Jianzha County Annals Editorial Committee. Jianzha County Annals [J]. Gansu: Gansu People's Publishing House, 2003 [13] Dari County Annals Editorial Committee. Dari County Annals [J]. Shanxi: Shanxi People's Publishing House, 1993 [14] Golmud City Annals Editorial Committee. Golmud City Annals [J]. Beijing: Fangzhi Publishing House, 2005 [15] Delingha City Annals Editorial Committee. Delingha City Annals [J]. Beijing: Fangzhi Publishing House, 2004 [16] Tianjun County Annals Editorial Committee. Tianjun County Annals [J]. Gansu: Gansu Cultural Publishing House, 1995 [17] Naidong County Annals Editorial Committee. Naidong County Annals [J]. Beijing: China Tibetology Press, 2006 [18] Gulang County Annals Editorial Committee. Gulang County Annals [J]. Gansu: Gansu People's Publishing House, 1996 [19] County Annals Editorial Committee of Akesai Kazak Autonomous County. County Annals of Akesai Kazakh Autonomous County [J]. Gansu: Gansu People's Publishing House, 1993 [20] Minxian County Annals Editorial Committee. Minxian County Annals [J]. Gansu: Gansu People's Publishing House, 1995 [21] Dangchang County Annals Editorial Committee. Dangchang County Annals [J]. Gansu: Gansu Cultural Publishing House, 1995 [22] Dangchang County Annals Editorial Committee. Dangchang County Annals(Sequel) (1985-2005) [J]. Gansu: Gansu Cultural Publishing House, 2006 [23] Wenxian County Annals Editorial Committee. Wenxian County Annals[J]. Gansu: Gansu Cultural Publishing House, 1997 [24] Kangle County Annals Editorial Committee. Kangle County Annals [J]. Shanghai: Sanlian Bookstore. 1995 [25] County Annals Editorial Committee of Jishishan (Baoan, Dongxiang, Sala) Autonomous County. County Annals of Jishishan (Baoan, Dongxiang, Sala) Autonomous County[J], Gansu: Gansu Cultural Publishing House, 1998 [26] Luqu County Annals Editorial Committee. Luqu County Annals [J]. Gansu: Gansu People's Publishing House, 2006 [27] Zhouqu County Annals Editorial Committee. Zhouqu County Annals [J]. Shanghai: Sanlian Bookstore. 1996 [28] Xiahe County Annals Editorial Committee. Xiahe County Annals [J]. Gansu: Gansu Cultural Publishing House, 1999 [29] Zhuoni County Annals Editorial Committee. Zhuoni County Annals [J]. Gansu: Gansu Nationality Publishing House, 1994 [30] Diebu County Annals Editorial Committee. Diebu County Annals [J]. Gansu: Lanzhou University Press, 1998 [31] Pengxian County Annals Editorial Committee. Pengxian County Annals [J]. Sichuan: Sichuan People's Publishing House, 1989 [32] Guanxian County Annals Editorial Committee. Guanxian County Annals [J]. Sichuan: Sichuan People's Publishing House, 1991 [33] Wenjiang County Annals Editorial Committee. Wenjiang County Annals [J]. Sichuan: Sichuan People's Publishing House, 1990 [34] Shifang County Annals Editorial Committee. Shifang County Annals [J]. Sichuan: Sichuan University Press, 1988 [35] Tianquan County Annals Editorial Committee. Tianquan County Annals [J]. Sichuan: Sichuan Science and Technology Press, 1997 [36] Shimian County Annals Editorial Committee. Shimian County Annals [J]. Sichuan: Sichuan Cishu Publishing House, 1999 [37] Lushan County Annals Editorial Committee. Lushan County Annals [J]. Sichuan: Fangzhi Publishing House, 2000 [38] Hongyuan County Annals Editorial Committee. Hongyuan County Annals [J]. Sichuan: Sichuan People's Publishing House, 1996 [39] Wenchuan County Annals Editorial Committee. Wenchuan County Annals [J]. Sichuan: Bayu Shushe, 2007 [40] Derong County Annals Editorial Committee. Derong County Annals [J]. Sichuan: Sichuan University, 2000 [41] Baiyu County Annals Editorial Committee. Baiyu County Annals [J]. Sichuan: Sichuan University Press, 1996 [42] Batang County Annals Editorial Committee. Batang County Annals [J]. Sichuan: Sichuan Nationality Publishing House, 1993 [43] Jiulong County Annals Editorial Committee. Jiulong County Annals(Sequel) (1986-2000) [J]. Sichuan: Sichuan Science and Technology Press, 2007 [44] County Annals Editorial Committee of Derung-Nu Autonomous County Gongshan. County Annals of Derung-Nu Autonomous County Gongshan [J]. Beijing: Nationality Publishing House, 2006 [45] Lushui County Annals Editorial Committee. Lushui County Annals [J]. Yunnan: Yunnan People's Publishing House, 1995 [46] Deqin County Annals Editorial Committee. Deqin County Annals [J]. Yunnan: Yunnan Nationality Publishing House, 1997 [47] Yutian County Annals Editorial Committee. Yutian County Annals [J]. Xinjiang: Xinjiang People's Publishing House, 2006 [48] Cele County Annals Editorial Committee. Cele County Annals [J]. Xinjiang: Xinjiang People's Publishing House, 2005 [49] Hetian County Annals Editorial Committee. Hetian County Annals [J]. Xinjiang: Xinjiang People's Publishing House, 2006 [50] Qiemo County Local Chronicles Editorial Committee. Qiemo County Annals [J]. Xinjiang: Xinjiang People's Publishing House, 1996 [51] Shache County Annals Editorial Committee. Shache County Annals [J]. Xinjiang: Xinjiang People's Publishing House, 1996 [52] Yecheng County Annals Editorial Committee. Yecheng County Annals [J]. Xinjiang: Xinjiang People's Publishing House, 1999 [53] Akto County Local Chronicles Editorial Committee. Akto County Annals [J]. Xinjiang: Xinjiang People's Publishing House, 1996 [54] Wuqia County Local Chronicles Editorial Committee. Wuqia County Annals [J]. Xinjiang: Xinjiang People's Publishing House, 1995
2022-10-10 View Details

This dataset contains the annual variation of runoff from the major hydrological stations in the Yarlung Zangbo River (annual average runoff volume, annual extremum ratio, coefficient of variation, etc.). It can be used to study the hydrological characteristics of the Yarlung Zangbo River. The original data are the national hydrological station data, and the quality requirements are the same as the national standards. Spatial Coverage: 4 hydrological stations in the main streams of the Yarlung Zangbo River basin, which are Lazi, Nugesha, Yangcun and Nuxia. This data sheet has five fields. Field 1: Station Name Field 2: Annual average runoff volume Field 3: Annual Extreme Ratio Field 4: Coefficient of variation Field 5: Data Series Length
2022-09-19 View Details
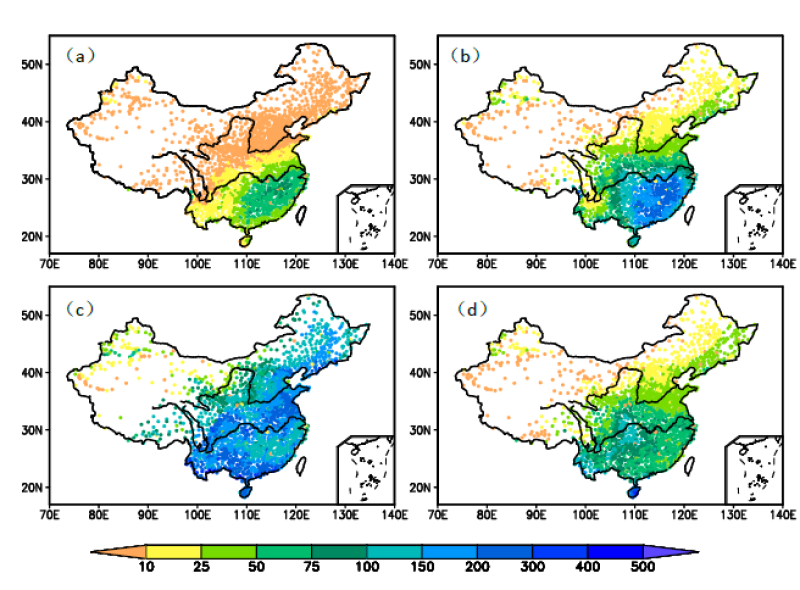
The National Meteorological Information Center Meteorological Data Room has detected, controlled and corrected the quality of 2474 national-level ground stations' basic meteorological data and formed a set of high-quality, national and provincial ground-based basic data files. On the basis of the basic ground data of the precipitation data files, the thin-plate spline method is used, introducing the digital elevation data to eliminate the influence of the elevation on the precipitation precision under the unique terrain conditions in China. A dataset of 0.5°×0.5° grid values for the surface precipitation in China since 1961 is established. It provides a data basis for accurately describing the trends and magnitudes of precipitation changes in China. One of two data sources for the development of “Dataset of Gridded Daily Precipitation in China (Version 2.0)” was 1) the monthly and daily precipitation data of 2474 national-level stations in the country archived by the Meteorological Data Room for nearly 50 years. The information comes from the monthly information of the “Monthly Report of the Surface Meteorological Record” reported by the climate data processing departments of all the provinces, municipalities and autonomous regions. That information is collected, organized and strictly checked and reviewed by the National Meteorological Information Center. Since the establishment of the station, many stations in the country have undergone historical changes such as business reform and station migration. In 1961, the total number of stations had stabilized above 2,000, and the number of backstage stations in the late 1970s reached 2,400. 2) The second data source was a Chinese range of 0.5°×0.5° digital elevation model data DEMs generated by GTOP030 data (resolution 30′′×30′′) resampling. For the quantitative analysis and evaluation of the data, please see the Dataset of Gridded Daily Precipitation in China - Data Specification.
2022-09-13 View Details
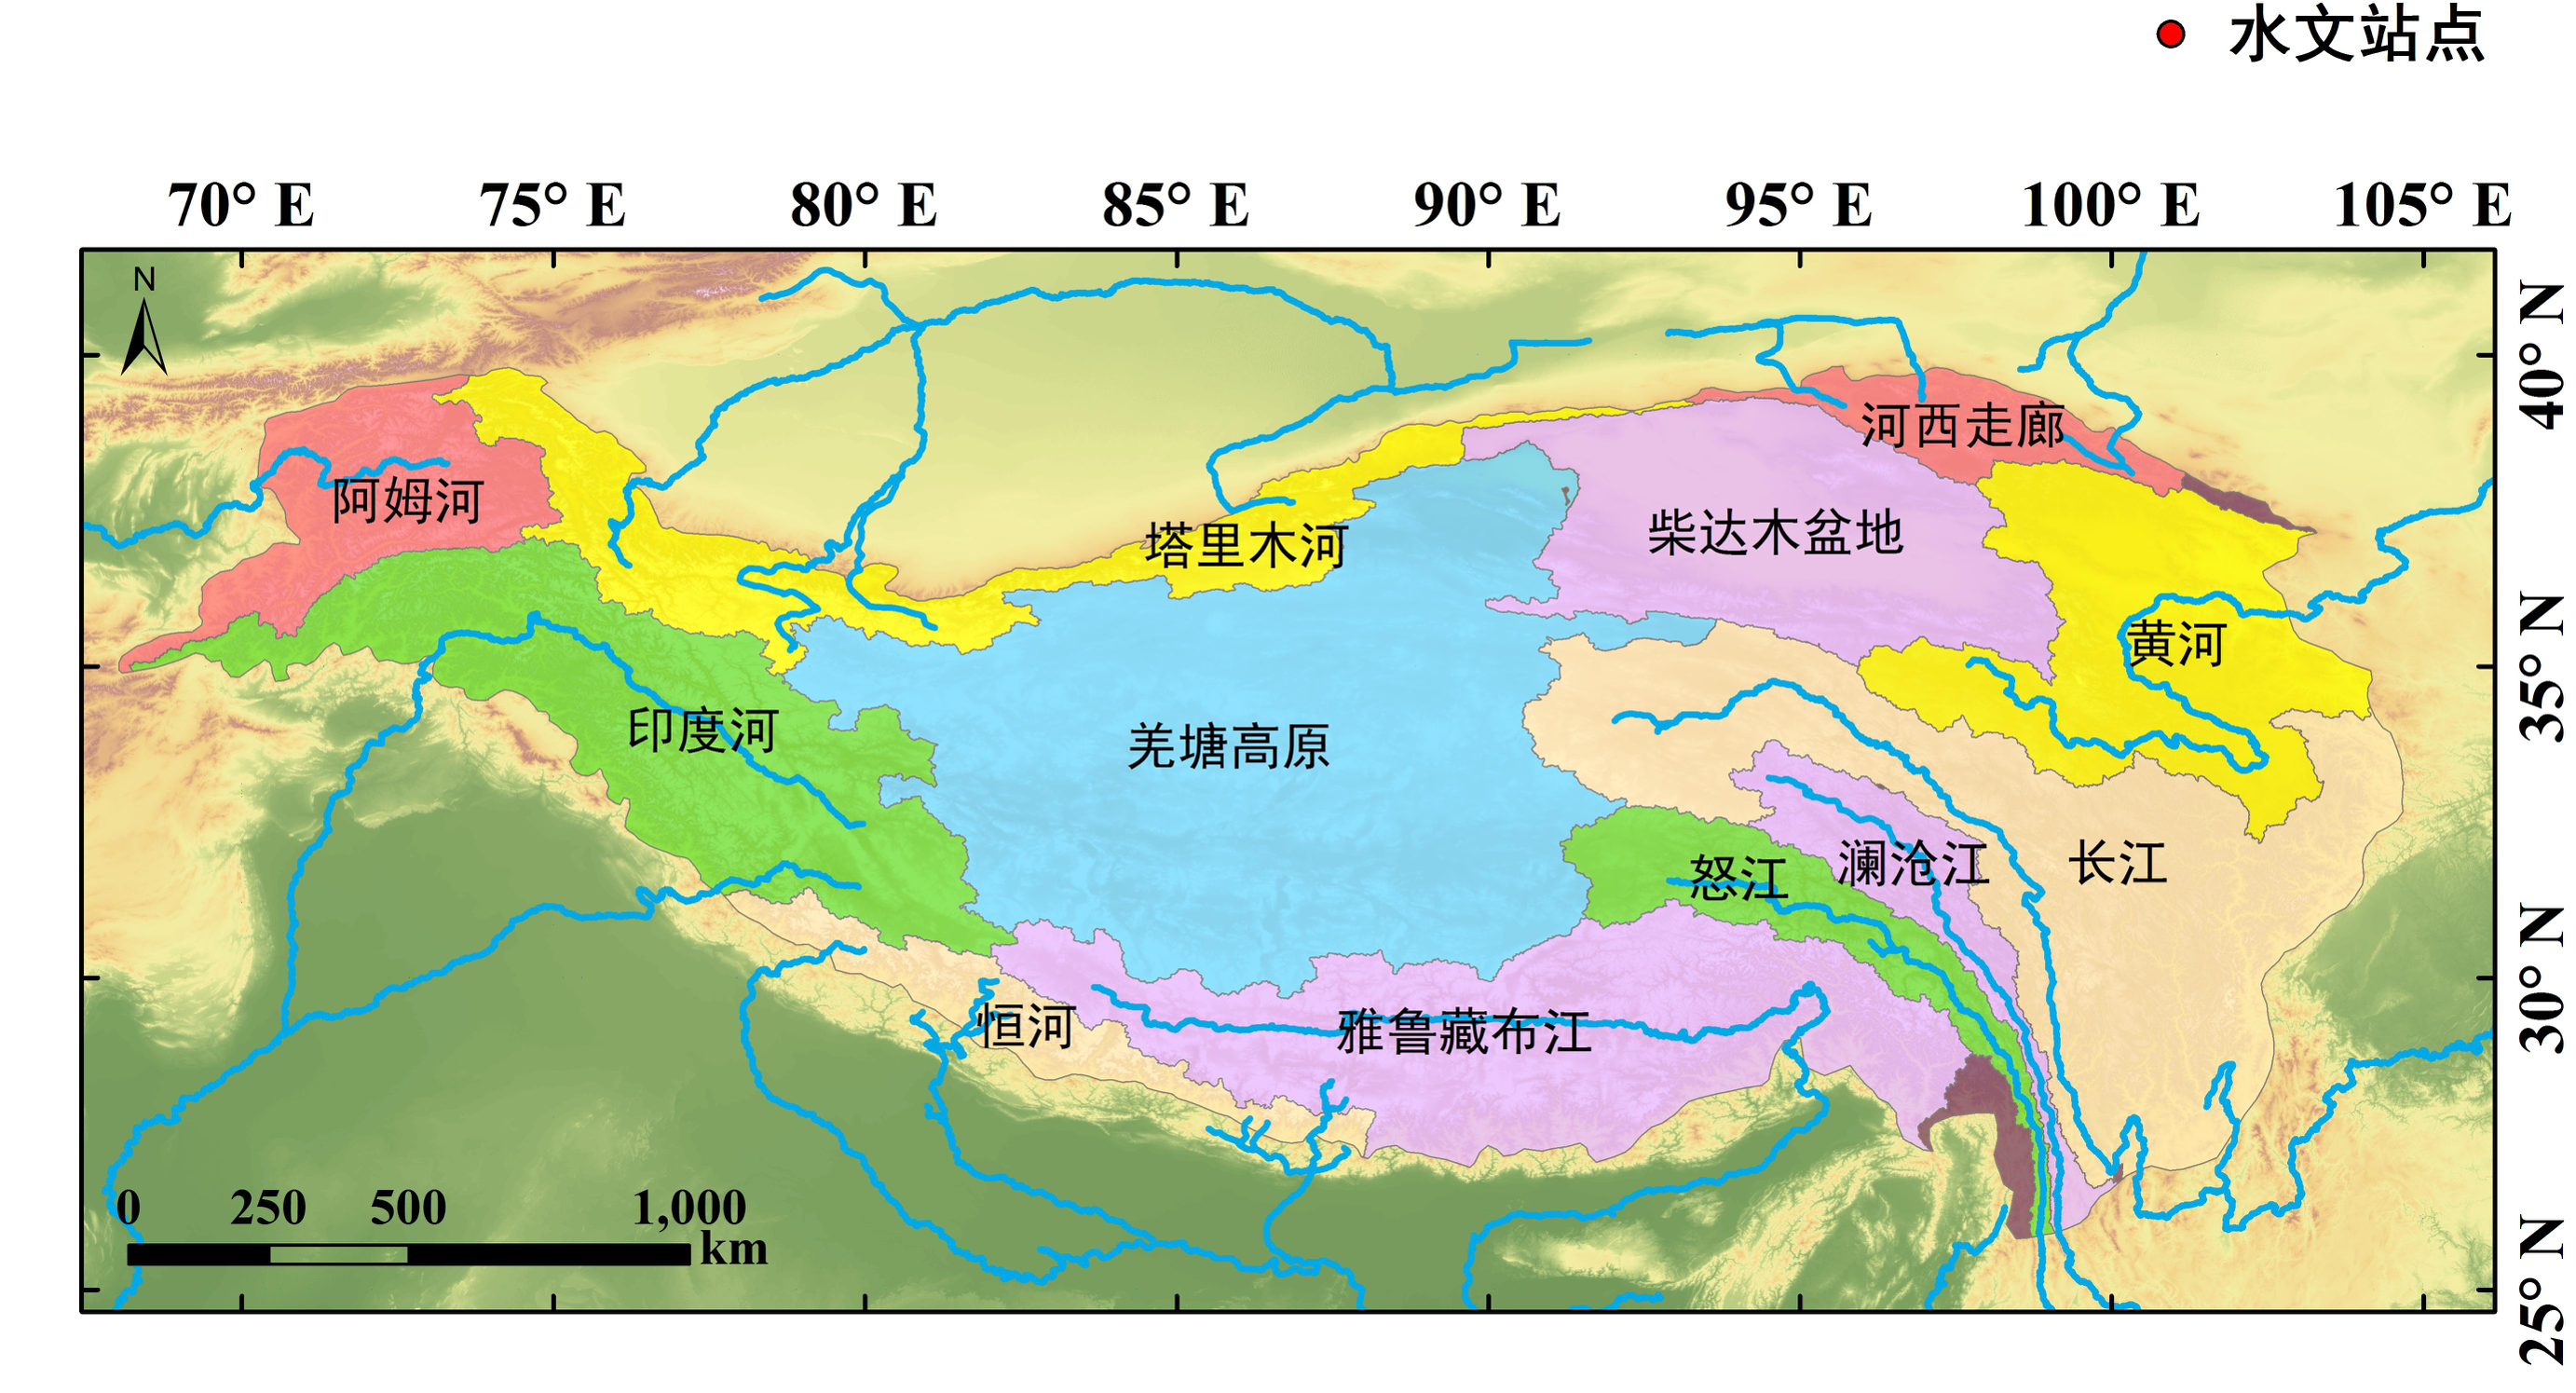
This data is a simulated output data set of 5km monthly hydrological data obtained by establishing the WEB-DHM distributed hydrological model of the source regions of Yangtze River and Yellow River, using temperature, precipitation and pressure as input data, and GAME-TIBET data as verification data. The dataset includes grid runoff and evaporation (if the evaporation is less than 0, it means deposition; if the runoff is less than 0, it means that the precipitation in the month is less than evaporation). This data is a model based on the WEB-DHM distributed hydrological model, and established by using temperature, and precipitation (from itp-forcing and CMA) as input data, GLASS, MODIA, AVHRR as vegetation data, and SOILGRID and FAO as soil parameters. And by the calibration and verification of runoff,soil temperature and soil humidity, the 5 km monthly grid runoff and evaporation in the source regions of Yangtze River and Yellow River from 1998 to 2017 was obtained. If asc can't open normally in arcmap, please delete the blacks space of the top 5 lines of the asc file.
2022-09-09 View Details
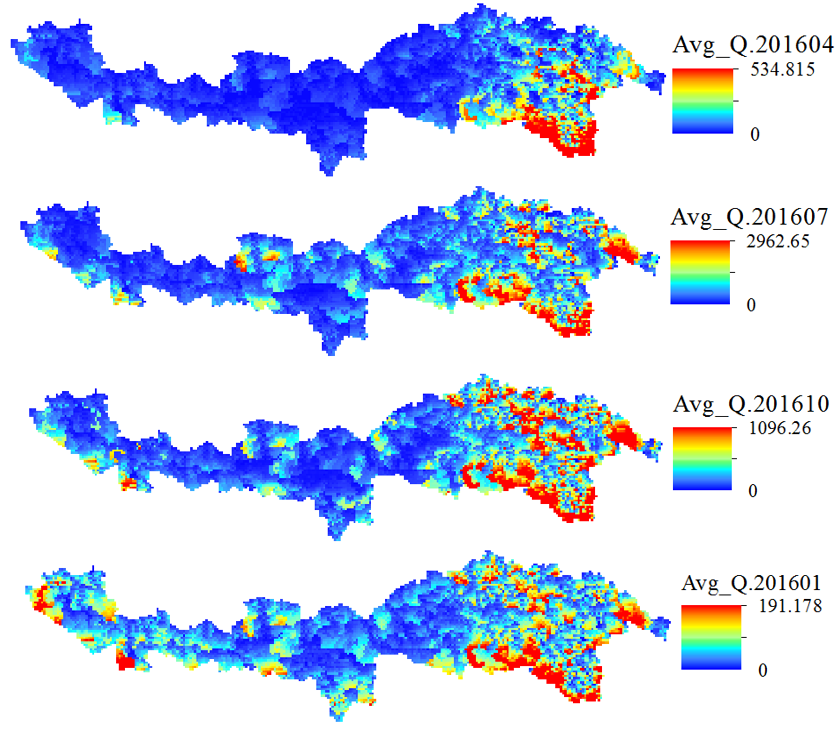
This data is a 5km monthly hydrological data set, including grid runoff and evaporation (if evaporation is less than 0, it means condensation; if runoff is less than 0, it means precipitation is less than evaporation). This data is a 5km monthly hydrological data set, including grid runoff and evaporation (if evaporation is less than 0, it means condensation; if runoff is less than 0, it means precipitation is less than evaporation).
2022-09-09 View Details

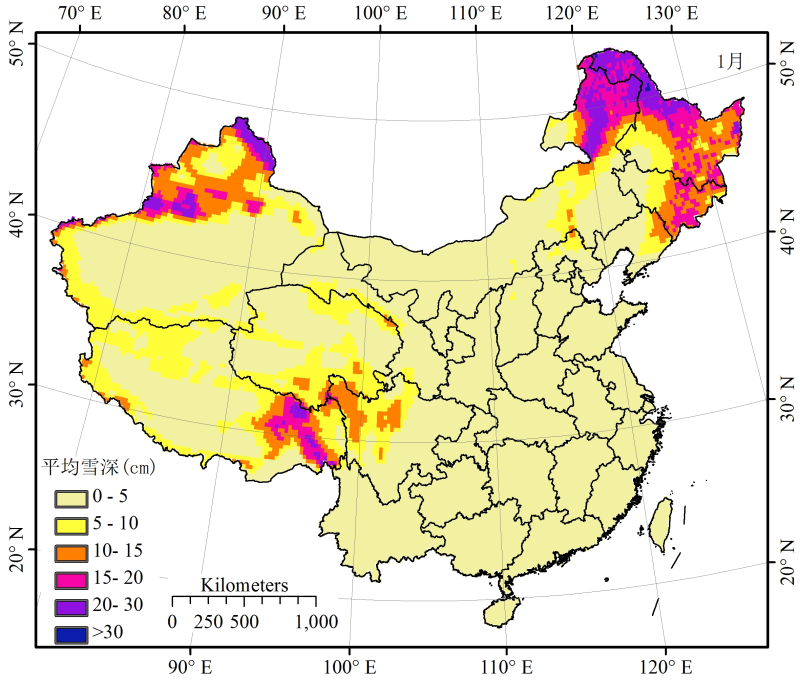
Snow water equivalent (the product of snow depth and density) is an important factor reflecting the change in snow cover on the ground surface, and it is also an important parameter in surface hydrological models and climatic models. As the “Headwaters of Asia”, the Tibetan Plateau is the source of several major rivers, which are fed with glacier and snow meltwater. Based on the sensitivity of passive microwave radiation to snow, these monitoring data enable long-term inversion of snow water equivalents in the High Asia region. The data set includes daily snow water equivalent, monthly snow water equivalent and five-day snow water equivalent, and these data can be applied in analyses of local hydrology, animal husbandry production and other fields.
2022-06-24 View Details
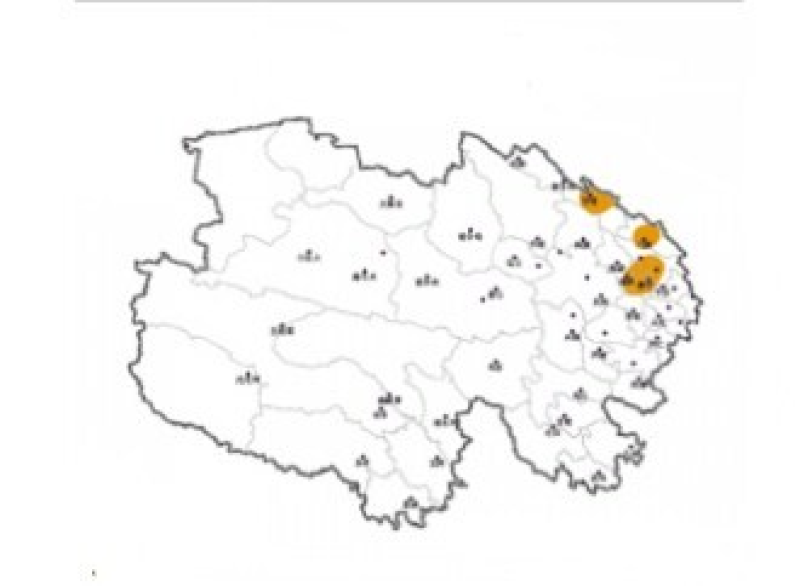
This data set contains information on natural disasters in Qinghai over nearly 50 years, including the times, places and the consequences of natural disasters such as droughts, floods, hail, continuous rain, snow disasters, cold waves and strong temperature drops, low temperature freezing injuries, gales and sandstorms, pest plagues, rats, and geological disasters. Qinghai Province is located in the northeastern part of the Tibetan Plateau and has a total area of 720,000 square kilometers. Numerous rivers, glaciers and lakes lie in the province. Because two mother rivers of the Chinese nation, the Yangtze River and the Yellow River, and the famous international river—the Lancang River—originated here, it is known as the "Chinese Water Tower"; there are 335,000 square meters of available grasslands in the province, and the natural pasture area ranks fourth in the country after those of Inner Mongolia, Tibet and Xinjiang. There are various types of grasslands, abundant grassland resources, and 113 families, 564 genera and 2100 species of vascular plants, which grow and develop under the unique climatic condition of the Tibetan Plateau and strongly represent the characteristics of the plateau ecological environment. As the main part of the Tibetan Plateau, Qinghai Province is one of the centers of the formation and evolution of biological species in China. It is also a sensitive area and fragile zone for the study of climate and ecological environment in the international field of sciences and technology. The terrain and land-forms in Qinghai are complex, with interlaced mountains, valleys and basins, widely distributed snow and glaciers, the Gobi and other deserts and grassland. Complex terrain conditions, high altitudes and harsh climatic conditions make Qinghai a province with frequent meteorological disasters. The main meteorological disasters include droughts, floods, hail, continuous rain, snow disasters, cold waves and strong temperature drops, low temperature freezing injuries, gales and sandstorms. The data are extracted from the Qinghai Volume of Chinese Meteorological Disaster Dictionary, with manual entry, summarizing and proofreading.
2022-06-21 View Details
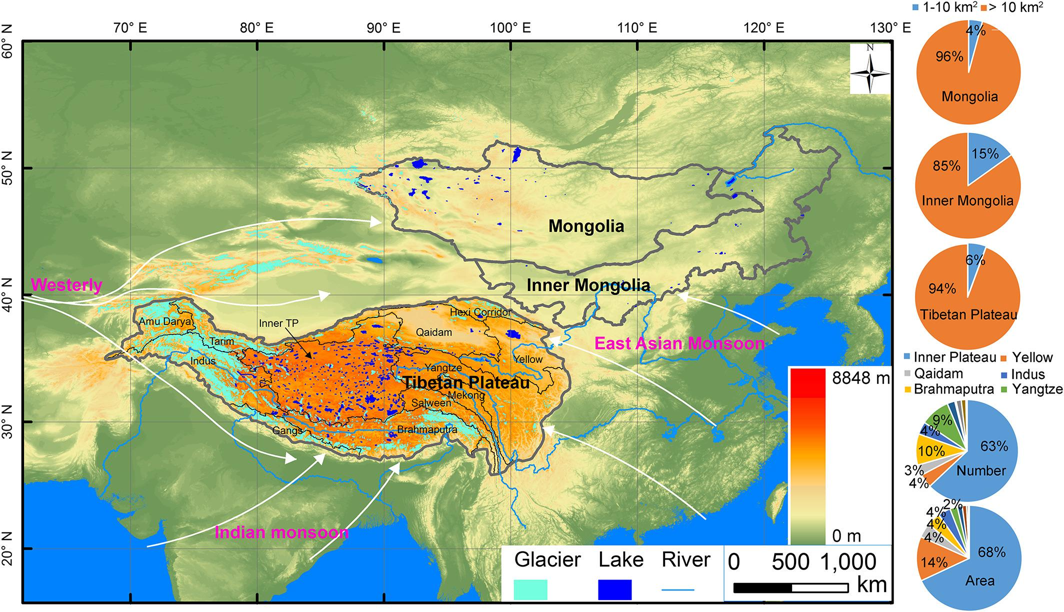
The long-term sequence data set of lake areas on the Tibetan Plateau contains area data of 364 lakes with areas greater than 10 square kilometers from 1970s to 2013. Based on Landsat images, Landsat data in October are mainly used, and one data is taken every three years to reduce seasonal variation and make the available data reach the maximum. The data set is extracted by the NDWI Water Index, and each lake undergoes manual visual inspection and edition. The data set can be used to study lake change, lake water balance and climate change on the Tibetan Plateau. Data type: Vector data. Projection: WGS84.
2022-05-24 View Details

This data set includes the microwave brightness temperatures obtained by the spaceborne microwave radiometer SSM/I carried by the US Defense Meteorological Satellite Program (DMSP) satellite. It contains the twice daily (ascending and descending) brightness temperatures of seven channels, which are 19H, 19V, 22V, 37H, 37V, 85H, and 85V. The Specialized Microwave Imager (SSM/I) was developed by the Hughes Corporation of the United States. In 1987, it was first carried into the space on the Block 5D-/F8 satellite of the US Defense Meteorological Satellite Program (DMSP) to perform a detection mission. In the 10 years from when the DMSP soared to orbit in 1987 to when the TRMM soared to orbit in 1997, the SSM/I was the world's most advanced spaceborne passive microwave remote sensing detection instrument, having the highest spatial resolution in the world. The DMSP satellite is in a near-polar circular solar synchronous orbit; the elevation is approximately 833 km, the inclination is 98.8 degrees, and the orbital period is 102.2 minutes. It passes through the equator at approximately 6:00 local time and covers the whole world once every 24 hours. The SSM/I consists of seven channels set at four frequencies, and the center frequencies are 19.35, 22.24, 37.05, and 85.50 GHz. The instrument actually comprises seven independent, total-power, balanced-mixing, superheterodyne passive microwave radiometer systems, and it can simultaneously measure microwave radiation from Earth and the atmospheric systems. Except for the 22.24 GHz frequency, all the frequencies have both horizontal and vertical polarization states. Some Eigenvalues of SSM/I Channel Frequency (GHz) Polarization Mode (V/H) Spatial Resolution (km * km) Footprint Size (km) 19V 19.35 V 25×25 56 19H 19.35 H 25×25 56 22V 22.24 V 25×25 45 37V 37.05 V 25×25 33 37H 37.05 H 25×25 33 85V 85.50 V 12.5×12.5 14 85H 85.50 H 12.5×12.5 14 1. File Format and Naming: Each group of data consists of remote sensing data files, .JPG image files and .met auxiliary information files as well as .TIM time information files and the corresponding .met time information auxiliary files. The data file names and naming rules for each group in the SSMI_Grid_China directory are as follows: China-EASE-Fnn-ML/HaaaabbbA/D.ccH/V (remote sensing data); China-EASE-Fnn -ML/HaaaabbbA/D.ccH/V.jpg (image file); China-EASE-Fnn-ML/HaaaabbbA/D.ccH/V.met (auxiliary information document); China-EASE-Fnn-ML/HaaaabbbA/D.TIM (time information file); and China-EASE- Fnn -ML/HaaaabbbA/D.TIM.met (time information auxiliary file). Among them, EASE stands for EASE-Grid projection mode; Fnn represents carrier satellite number (F08, F11, and F13); ML/H represents multichannel low resolution and multichannel high resolution; A/D stands for ascending (A) and descending (D); aaaa represents the year; bbb represents the Julian day of the year; cc represents the channel number (19H, 19V, 22V, 37H, 37V, 85H, and 85V); and H/V represents horizontal polarization (H) and vertical polarization (V). 2. Coordinate System and Projection: The projection method is an equal-area secant cylindrical projection, and the double standard latitude is 30 degrees north and south. For more information on EASE-GRID, please refer to http://www.ncgia.ucsb.edu/globalgrids-book/ease_grid/. If you need to convert the EASE-Grid projection method into a geographic projection method, please refer to the ease2geo.prj file, which reads as follows. Input Projection cylindrical Units meters Parameters 6371228 6371228 1 /* Enter projection type (1, 2, or 3) 0 00 00 /* Longitude of central meridian 30 00 00 /* Latitude of standard parallel Output Projection GEOGRAPHIC Spheroid KRASovsky Units dd Parameters End 3. Data Format: Stored as binary integers, Row number: 308 *166,each datum occupies 2 bytes. The data that are actually stored in this data set are the brightness temperatures *10, and after reading the data, they need to be divided by 10 to obtain true brightness temperature. 4. Data Resolution: Spatial resolution: 25 km, 12.5 km (SSM/I 85 GHz); Time resolution: day by day, from 1978 to 2007. 5. The Spatial Coverage: Longitude: 60°-140° east longitude; Latitude: 15°-55° north latitude. 6. Data Reading: Each group of data includes remote sensing image data files, .JPG image files and .met auxiliary information files. The JPG files can be opened with Windows image and fax viewers. The .met auxiliary information files can be opened with notepad, and the remote sensing image data files can be opened in ENVI and ERDAS software.
2022-05-05 View Details

The meteorological elements distribution map of the plateau, which is based on the data from the Tibetan Plateau National Weather Station, was generated by PRISM model interpolation. It includes temperature and precipitation. Monthly average temperature distribution map of the Tibetan Plateau from 1961 to 1990 (30-year average values): t1960-90_1.e00,t1960-90_2.e00,t1960-90_3.e00,t1960-90_4.e00,t1960-90_5.e00, t1960-90_6.e00,t1960-90_7.e00,t1960-90_8.e00,t1960-90_9.e00,t1960-90_10.e00, t1960-90_11.e00,t1960-90_12.e00 Monthly average temperature distribution map of the Tibetan Plateau from 1991 to 2020 (30-year average values): t1991-20_1.e00,t1991-20_2.e00,t1991-20_3.e00,t1991-20_4.e00,t1991-20_5.e00, t1991-20_6.e00,t1991-20_7.e00,t1991-20_8.e00,t1991-20_9.e00,t1991-20_10.e00, t1991-20_11.e00,t1991-20_12.e00, Precipitation distribution map of the Tibetan Plateau from 1961 to 1990 (30-year average values): p1960-90_1.e00,p1960-90_2.e00,p1960-90_3.e00,p1960-90_4.e00,p1960-90_5.e00, p1960-90_6.e00,p1960-90_7.e00,p1960-90_8.e00,p1960-90_9.e00,p1960-90_10.e00, p1960-90_11.e00,p1960-90_12.e00 Precipitation distribution map of the Tibetan Plateau from 1991 to 2020 (30-year average values): p1991-20_1.e00,p1991-20_2.e00,p1991-20_3.e00,p1991-20_4.e00,p1991-20_5.e00, p1991-20_6.e00,p1991-20_7.e00,p1991-20_8.e00,p1991-20_9.e00,p1991-20_10.e00, p1991-20_11.e00,p1991-20_12.e00, The temporal coverage of the data is from 1961 to 1990 and from 1991 to 2020. The spatial coverage of the data is 73°~104.95° east longitude, 26.5°~44.95° north latitude, and the spatial resolution is 0.05 degrees×0.05 degrees (longitude×latitude), and it uses the geodetic coordinate projection. Name interpretation: Monthly average temperature: The average value of daily average temperature in a month. Monthly precipitation: The total precipitation in a month. Dimensions: The file format of the data is E00, and the DN value is the average value of monthly average temperature (×0.01°C) and the average monthly precipitation (×0.01 mm) from January to December. Data type: integer Data accuracy: 0.05 degrees × 0.05 degrees (longitude × latitude). The original sources of these data are two data sets of 1) monthly mean temperature and monthly precipitation observation data from 128 stations on the Tibetan Plateau and the surrounding areas from the establishing times of the stations to 2000 and 2) HadRM3 regional climate scenario simulation data of 50×50 km grids on the Tibetan Plateau, that is, the monthly average temperature and monthly precipitation simulation values from 1991 to 2020. From 1961 to 1990, the PRISM (Parameter elevation Regressions on Independent Slopes Model) interpolation method was used to generate grid data, and the interpolation model was adjusted and verified based on the site data. From 1991 to 2020, the regional climate scenario simulation data were downscaled to generate grid data by the terrain trend surface interpolation method. Part of the source data came from the results of the GCM model simulation; the GCM model used the Hadley Centre climate model HadCM2-SUL. a) Mitchell JFB, Johns TC, Gregory JM, Tett SFB (1995) Climate response to increasing levels of greenhouse gases and sulphate aerosols. Nature, 376, 501-504. b) Johns TC, Carnell RE, Crossley JF et al. (1997) The second Hadley Centre coupled ocean-atmosphere GCM: model description, spinup and validation. Climate Dynamics, 13, 103-134. The spatial interpolation of meteorological data adopted the PRISM (Parameter-elevation Regressions on Independent Slopes Model) method: Daly, C., R.P. Neilson, and D.L. Phillips, 1994: A statistical-topographic model for mapping climatological precipitation over mountainous terrain. J. Appl. Meteor., 33, 140~158. Due to the difficult observational conditions in the plateau area and the lack of basic research data, there were deletions of meteorological data in some areas. After adjustment and verification, the accuracy of the data was only good enough to be used as a reference for macroscale climate research. The average relative error rate of the monthly average temperature distribution of the Tibetan Plateau from 1961 to 1990 was 8.9%, and that from 1991 to 2020 was 9.7%. The average relative error rate of precipitation data on the Tibetan Plateau from 1961 to 1990 was 20.9%, and that from 1991 to 2020 was 22.7%. The area of missing data was interpolated, and the values of obvious errors were corrected.
2022-05-05 View Details
Contact Support
Links
National Tibetan Plateau Data CenterFollow Us

A Big Earth Data Platform for Three Poles © 2018-2020 No.05000491 | All Rights Reserved
|  No.11010502040845
Tech Support: westdc.cn