
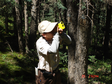
The dataset of water content of forest canopy components (the twig and the leaf) measurements was obtained at the super site (100m×100m) around the Dayekou Guantan forest station on Jun. 5, 2008. The sample tree was selected according to different diameters at breast height. 5 diameter classes were divided and in each class, 10 trees were selected and altogether 30 trees were selected as sampling trees. Branches in different parts were picked by the tree pruner and the twig and the leaf were separated manually, whose green weight was measured by the scales on the scene and dry weight by oven drying in the lab. Those provide reliable data for the reconstruction of the 3D structure of the forest scene, and for modelling active and passive remote sensing mechanisms and the simulation of remote sensing images.
BAI Lina, TIAN Xin, WANG Bengyu, CHEN Erxue

The dataset combined with crop phrenology data and field management data which were investigated near the 13 eddy covariance (EC) stations. 1.1 Objective of investigation Objectives of investigation is to supply assistant information for experiment on EC, meteorology, and biophysics parameter. 1.2 Investigation spots and items Investigation spots include Jiu She of Shiqiao village (EC3), Xiaoman southern road (EC16), Wu She of Five stars village (EC13), Wu She of Xiaoman village (EC14), Er She of Shiqiao village (EC5), Liu She of Zhonghua village (EC11), Liu She of Shiqiao village (EC2), Wu She of JinCheng village (EC7), EC6, Liu She of Jincheng village (EC8), Yi She of Kangning village (EC9), Er She of Kangning village (EC10), and Si She of Jingcheng village (EC12). Investigation items comprise crop type, crop name, seed time, seed type, plant span, row span, field area, germination time, three leaves period, seven leaves period, farming way, farming time, irrigation time, irrigation water volume, fertilization time, fertilization type, and fertilization rate. The time used in this dataset is in UTC+8 Time. 1.3 Data collection Data was collected by using ask-reply approach according to investigation tables.
GE Yingchun, Ma Chunfeng, LI Xin

The dataset of ground truth measurement synchronizing with Landsat TM was obtained in the A'rou foci experimental area from Jul. 10 to Jul. 12, 2008. The stellera and the whin coverage were mainly measured. Photos were taken in No. 2 quadrate of A'rou and an optional stellera land for coverage mesurement from Jul. 10 to 11, shooting straight downwards at the height of 1.5 m. The fisheye camera was Nikon D80 with a lens of Sigma 8mm F3.5 EX DG CIRCULAR FISHEYE. The vegetation height was measured on Jul. 12. One grid of 5m×5m was chosen in each of the eight quadrates (60m×60m or 120m×120m) and compartmentalized into 2.5m×2.5m, in which GPS positions by GARMIN GPS 76, species, the plant number and height were measured. Four files were included, the quadrates coordinates, stellera observations in No. 2 quadrate, the stellera quadrat investigation and TM quadrate investigation.
BAI Yanfen, Qian Jinbo, GAO Song, HAO Xiaohua, SHU Lele

The dataset of ground truth measurement synchronizing with MODIS was obtained in the Linze grassland foci experimental area on Jun. 22, 2008. Simultaneous east-west ground measurements on the canopy temperature, the half-height temperature and the land surface radiative temperature were carried out by the hand-held infrared thermometer at intervals of 125m in 8 quadrates (2km×2km), No.1 quadrate (H01-H08) on Jun. 22, No.2 quadrate (H09-H16) on Jun. 23,No.3 quadrate (H17-H24) on Jun. 22, No.4 quadrat (H25-H32) on Jun. 23, No.5 quadrate (H33-H40) on Jun. 22, No.6 quadrate (H41-H48) on Jun. 23, No,7 quadrate (H49-H56) and No.8 quadrate (H57-H64) on Jun. 23. Data were archived in Excel format. See WATER: Dataset of setting of the sampling plots and stripes in the foci experimental area of Linze station for more information.
CHAO Zhenhua, NIAN Yanyun, WANG Xufeng, LIANG Wenguang

LAI observation was carried out for the typical underlying surface in the lower reaches of Heihe River Basin during the aviation flight experiment in 2014. The observation started on 24 July, 2014 and finished on 1 August, 2014. 1. Observation time On days of 24 July, 27 July, 30 July, 31 July and 1 August, 2014 2. Samples and observation methods Large areas with homogeneous vegetation (greater than 100 m * 100 m) were chosen as the observation samples. And forty field samples were selected according to the characteristics of vegetation distribution in the downstream. The land-use types including the cantaloupe, the Tamarix chinensis, the reeds, the weeds, the Karelinia caspica, the Sophora alopecuroides and so on. LAI data were calculated according to the transmittance derived from an A value (above-canopy readings) and four B values (below readings). More than two LAI values were obtained for each sample. At the same time, the heights of the vegetation in each sample were measured. 3. Observation instrument LAI 2200 4. Data storage The observation recorded data were stored in excel and the original LAI data were stored in txt files.
SONG Yi, Li Yimeng
")
This dataset is land surface phenology estimated from 16 days composite MODIS NDVI product (MOD13Q1 collection6) in the Three-River-Source National Park from 2001 to 2020. The spatial resolution is 250m. The variables include Start of Season (SOS) and End of Season (EOS). Two phenology estimating methods were used to MOD13Q1, polynomial fitting based threshold method and double logistic function based inflection method. There are 4 folders in the dataset. CJYYQ_phen is data folder for source region of the Yangtze River in the national park. HHYYQ_phen is data folder for source region of Yellow River in the national park. LCJYYQ_phen is data folder for source region of Lancang River in the national park. SJY_phen is data folder for the whole Three-River-Source region. Data format is geotif. Arcmap or Python+GDAL are recommended to open and process the data.
WANG Xufeng

The dataset of evapotranspiration observed by the micro-lysimeter (d:25cm; h:24cm) was obtained in the Yingke oasis foci experimental area at 6:30am and 8:00pm from Jun. 14 to Jul. 13, 2008. The weather condition of the day was also recorded. Data were archived as Excel files. Observations on Jun. 25 and 26 discontinued.
GE Yingchun, MA Mingguo, SHU Lele, WANG Jianhua, XU Zhen, SU Gaoli, LIANG Wenguang, YU Fan, Wang Jing, LI Xiaoyu
-dataset of flux observation matrix (thermal dissipation sap flow velocity Probe) from Jun to Sep, 2012")
This dataset includes observational data of sap flow from 14 June to 21 September, 2012. The study area was located in the irrigation area within the middle reaches of the Heihe River Basin, China. Sample trees were selected for installing TDP (thermal dissipation sap flow velocity probe) instruments according to their height and diameter at breast height (DBH); only Popolusgansuensis trees were selected in this study. The TDP instrument is made in China; the model type was TDP30. There were 3 TDP observation sites, i.e., TDP-1, TDP-2 and TDP-3, which were located near the LAS4_S, EC6 and EC8 sites, respectively. The order of tree heights was TDP-2 > TDP-1 > TDP-3, and the order of DBH was TDP-2 > TDP-3 > TDP-1. At each site, 3 representative trees were selected to measure the sap flow. Three TDPs were mounted on the stem of each tree, one each for the southeast, southwest and north directions; the mounting height is 1.3 meters. Each TDP had two probes. The raw TDP data included the temperature difference between the two probes at a frequency of 30 s. The released data include the 10 minute-averaged sap flow rate (cm/h), sap flow flux (cm^3/h), and daily transpiration (mm/d). The sap flow rate and the sap flow flux were calculated according to the temperature difference between the two probes; the shelter-forest transpiration per unit area (Q) was calculated based on the area of shelterbelts and density of Popolusgansuensis trees at each site. The data preprocessing steps included the following. (1) Unphysical data were excluded. (2) Missing data were filled with -6999. (3) Suspicious data, which were most likely caused by probe failure, were marked in red; confirmed bad data were excluded. For more information, please refer to Liu et al. (2016) (for multi-scale observation experiment or sites information), Qiao et al. (2015) (for data processing) in the Citation section.
LIU Shaomin, LI Xin

The dataset of ground truth measurement synchronizing with the airborne WiDAS mission and Envisat ASAR was obtained in the Linze station foci experimental area on Jul. 11, 2008. WiDAS, composed of four CCD cameras, one mid-infrared thermal imager (AGEMA 550), and one infrared thermal imager (S60), can acquire CCD, MIR and TIR band data. The data were in AP mode and VV/VH polarization combinations, and the overpass time was approximately at 11:26 BJT. The simultaneous ground data included the following items: (1) soil moisture (0-5cm) measured once by the cutting ring method at the corner points of the 40 subplots of the west-east desert transit zone strip , once by the cutting ring method in the nine subplots of the north-south desert transit zone, nine times in the LY06 and LY07 strips quadrates,and once by the cutting ring and once by ML2X Soil Moisture Tachometer in the Wulidun farmland. The preprocessed soil volumetric moisture data were archived as Excel files. (2) the surface radiative temperature measured by three handheld infrared thermometer (5# and 6# from Cold and Arid Regions Environmental and Engineering Research Institute, and one from Institute of Geographic Sciences and Natural Resources, which were all calibrated) in LY06 and LY07 strips (49 points and repeated three times), and Wulidun farmland quadrates (various points and repeated three times). Data were archived as Excel files. (3) spectrum of maize, soil and soil with known moisture measured by ASD Spectroradiometer (350~2 500 nm) from BNU and the reference board (40% before Jun. 15 and 20% hereafter) in Wulidun farmland. Raw spectral data were binary files , which were recorded daily in detail, and pre-processed data on reflectance (by ViewSpecPro) were archived as Excel files. (4) maize BRDF measured by ASD Spectroradiometer (350~2 500 nm) from BNU, the reference board (40% before Jun. 15 and 20% hereafter), two observation platforms of BNU make and one of Institute of Remote Sensing Applications make in Wulidun farmland. Raw spectral data were archived as binary files, which were recorded daily in detail, and pre-processed data on reflectance and transmittivity were archived as text files (.txt). (5) LAI measured in the maize quadrate, poplar quadrate and desert scrub quadrate in Wulidun farmland, the desert transit zone strips and the poplar forest quadrate by the fisheye camera (CANON EOS40D with a lens of EF15/28), shooting straight downwards, with exceptions of higher plants, which were shot upwards. Data included original photos (.JPG) and those processed by can_eye5.0 (in excel). (6) LAI of maize measured by LAI2000 in Linze station quadrates and Wulidun farmland quadrates. Data educed from LAI2000 periodically were archived as text files (.txt) and marked with one ID. Raw data (table of word and txt) and processed data (Excel) were included. Besides, observation time, the observation method and the repetition were all archived. (7) LAI measured by the ruler and the set square in B2 and B3 of Linze station quadrates. Data were archived as Excel files. See the metadata record “WATER: Dataset of setting of the sampling plots and stripes in the Linze station foci experimental area” for more information of the quadrate locations.
YU Yingjie, DING Songchuang, SONG Yi, WANG Yang, YAN Qiaodi, ZHU Shijie, XIE Tingting, JIANG Hao, LI Shihua, LIU Jun

The dataset of ground truth measurements synchronizing with Envisat ASAR was obtained in the Linze grassland foci experimental area on Jul. 11, 2008. The data were in AP mode and VV/VH polarization combinations, and the overpass time was approximately at 11:26 BJT. Observations were carried out in the reed plot A, the saline plots B and C, the alfalfa plot D and the barley plot E, which were divided into 6×6 subsites, with each one spanning a 120×120 m2 plot. Soil gravimetric moisture, volumetric moisture, and soil bulk density after drying by using the cutting ring, the mean soil temperature from 0-5cm by the probe thermometer, and the canopy temperature and the land surface temperature by the hand-held infrared thermometer were measured in A, B and C; the soil temperature, soil moisture, the loss tangent, soil conductivity, the real part and the imaginary part of soil complex permittivity by the POGO soil sensor, the mean soil temperature from 0-5cm by the probe thermometer, the canopy temperature and the land surface temperature by the hand-held infrared thermometer in D and E. Data were archived in Excel file. See WATER: Dataset of setting of the sampling plots and stripes in the foci experimental area of Linze station for more information.
CAO Yongpan, CHAO Zhenhua, GE Chunmei, HU Xiaoli, HUANG Chunlin, LIU Chao, WU Yueru, SHEN Xinyi

The dataset of ground truth measurements synchronizing with the airborne WiDAS mission was obtained in the Linze station foci experimental area on May 30, 2008. WiDAS, composed of four CCD cameras, one mid-infrared thermal imager (AGEMA 550), and one infrared thermal imager (S60), can acquire CCD, MIR and TIR band data. The simultaneous ground data included: (1) soil moisture (0-5cm) measured nine times by the cutting ring method (50cm^3) along LY07 and LY08 quadrates, and once by the cutting ring method and once by ML2X Soil Moisture Tachometer in the six points of Wulidun farmland quadrates. The preprocessed soil volumetric moisture data were archived as Excel files. (2) surface radiative temperature measured by two handheld infrared thermometer (5# and 6# from Cold and Arid Regions Environmental and Engineering Research Institute which were both calibrated) in the LY07 and LY08 quadrates (98 sample points and repeated three times) and the Wulidun farmland quadrates (various points and repeated three times). Data were archived as Excel files. (3) spectrum of maize, soil and soil with known moisture measured by ASD Spectroradiometer (350~2 500 nm) from BNU,and the 40% reference board in Wulidun farmland quadrate and the desert transit zone strips. Raw spectral data were archived as binary files, which were recorded daily in detail, and pre-processed data on reflectance were archived as Excel files. (4) maize BRDF measured by ASD Spectroradiometer (350~2 500 nm) from BNU, the 40% reference board, two observation platforms of BNU make and one of Institute of Remote Sensing Applications make in Wulidun farmland quadrate and the desert transit zone strips. Raw spectral data were archived as binary files , which were recorded daily in detail, and pre-processed data on reflectance and transmittivity (read by ViewSpecPro) were archived as text files (.txt). (5) LAI of maize, poplar and the desert scrub measured by the fisheye camera (CANON EOS40D with a lens of EF15/28), shooting straight downwards, with exceptions of higher plants, which were shot upwards in Wulidun farmland quadrate I, the desert transit zone and the poplar forest. Data included original photos (.JPG) and those processed by can_eye5.0 (in excel). (6) LAI measured by the ruler and the set square in D and H quadrates of the Wulidun farmland. Part of the samples were also measured by LI-3100 and compared with those by manual work for further correction. Data were archived as Excel files. See the metadata record “WATER: Dataset of setting of the sampling plots and stripes in the Linze station foci experimental area” for more information of the quadrate locations.
LI Jing, Li Xiangyun, Qu Yonghua, SUN Qingsong, GAO Song, HAO Xiaohua, PAN Xiaoduo, Qian Jinbo, SONG Yi, WANG Yang, ZHU Shijie, GONG Hao, ZHU Man

The data set include crop biomass observed at four sample regions, that is the soil moisture control experimental field at Daman county, and the EC plots, the super station, and Shiqiao sample plots at Wuxing village in Zhangye city. 1) Objective Crop biomass, a key biophysical parameter, was observed for calibration and validation of crop growth model and the retrieval of other biophysical parameters as well as the application in eco-hydrological models. 2) Measurement instrument: Electronic balance (±0.1g) and oven. 3) Measurement site a. the soil moisture control experimental field at Daman county, Twelve soil water treatments are set. The wheat biomass for each treatment is measured on 17, 23 and 29 May, and 3, 9, 14 and 24 June, and 5 and 12 July. b. the EC site Maize biomass at 14 EC site (EC-2,EC-3,EC-5,EC-6,EC-7,EC-8,EC-9, EC-10, EC-11, EC-12, EC-13, EC-14, EC-15, EC-16) are measured on 14, 21, 25 and 31 May, 7, 13, 23 and 28 June, 3, 13, 18 and 23 July, 3, 12 and 28 August. c. the super station Maize biomass at the super station is measured on 22 and 28 May, 5, 11, 18, and 25 June, and 1, 8, 15, 22 and 31 July, 9, 15 and 22 August, and 3 and 11 September. d. the Shiqiao sample site Maize biomass at the Shiqiao village is measured on 17, 22 and 28 May, 4, 11, 17 and 25 June, 1, 8, 15, 22, and 30 July, 8, 16 and 27 August, and 9 September. 4) Data processing The observational data was recorded in the sheets and reorganized in the EXCEL sheets.
Xu Fengying, Wang Jing, Ma Chunfeng, Huang Yongsheng, LI Xin, MA Mingguo
")
The dataset includes the fractional vegetation cover data generated from the stations of crop land, wetland, Gebi desert and desert steppe in Yingke Oasis and biomass data generated from the stations of crop land (corn) and wetland. The observations lasted for a vegetation growth cycle from 19 May, 2012 to 15 September, 2012. 1. Fractional vegetation cover observation 1.1 Observation time 1.1.1 Station of the crop land: The observations lasted from 20 May, 2012 to 15 September, 2012, and in five-day periods for each observation before 31 July and in ten-day periods for each observation after 31 July. The observation time for the station of crop land (corn) are 2013-5-20, 2013-5-25, 2013-5-30, 2013-6-5, 2013-6-10, 2013-6-16, 2013-6-22, 2013-6-27, 2013-7-2, 2013-7-7, 2013-7-12, 2013-7-17, 2013-7-27, 2013-8-3, 2013-8-13, 2013-8-25, 2013-9-5 and 2013-9-15. 1.1.2 The other four stations: The observations lasted from 20 May, 2012 to 15 September, 2012 and in ten-day periods for each observation. The observation time for the crop land are 2013-5-20, 2013-6-5, 2013-6-16, 2013-6-27, 2013-7-7, 2013-7-17, 2013-7-27, 2013-8-3, 2013-8-13, 2013-8-25, 2013-9-5 and 2013-9-15. 1.2 method 1.2.1 Instruments and measurement method Digital photography measurement is implemented to measure the FVC. Plot positions, photographic method and data processing method are dedicatedly designed. In field measurements, a long stick with the camera mounted on one end is beneficial to conveniently measure various species of vegetation, enabling a larger area to be photographed with a smaller field of view. The stick can be used to change the camera height; a fixed-focus camera can be placed at the end of the instrument platform at the front end of the support bar, and the camera can be operated by remote control. 1.2.2 Design of the samples Three and two plots with the area of 10×10 m^2 were measured for the station of the crop land and wetland, respectively. One plot with the area of 10×10 m^2 was measured for the other three stations. Shoot 9 times along two perpendicularly crossed rectangular-belt transects. The picture generated of each time is used to calculate a FVC value. “True FVC” of the plot is then acquired as the average of these 9 FVC values. 1.2.3 Photographic method The photographic method used depends on the species of vegetation and planting pattern. A long stick with the camera mounted on one end is used for the stations of crop land and wetland. For the station of the crop land, rows of more than two cycles should be included in the field of view (<30), and the side length of the image should be parallel to the row. If there are no more than two complete cycles, then information regarding row spacing and plant spacing are required. The FVC of the entire cycle, that is, the FVC of the quadrat, can be obtained from the number of rows included in the field of view. For other three stations, the photos of FVC were obtained by directly photographing for the lower heights of the vegetation. 1.2.4 Method for calculating the FVC The FVC calculation was implemented by the Beijing Normal University. The detail method can be found in the reference below. Many methods are available to extract the FVC from digital images, and the degree of automation and the precision of identification are important factors that affect the efficiency of field measurements. This method, which is proposed by the authors, has the advantages of a simple algorithm, a high degree of automation and high precision, as well as ease of operation (see the reference). 2. Biomass observation 2.1. Observation time 2.1.1 Station of the crop land: The observations lasted from 20 May 2012 to 15 September 2012, and in five-day periods for each observation before 31 July and in ten-day periods for each observation after 31 July. The observation time for the crop land are 2013-5-25, 2013-5-30, 2013-6-5, 2013-6-10, 2013-6-16, 2013-6-22, 2013-6-27, 2013-7-2, 2013-7-7, 2013-7-12, 2013-7-17, 2013-7-27, 2013-8-3, 2013-8-13, 2013-8-25, 2013-9-5 and 2013-9-15. 2.1.2 The station of wetland: The observations lasted from 20 May 2012 to 15 September 2012, and in ten-day periods for each observation. The observation time for the crop land are 2013-6-5, 2013-6-16, 2013-6-27, 2013-7-7, 2013-7-17, 2013-7-27, 2013-8-3, 2013-8-13, 2013-8-25, 2013-9-5 and 2013-9-15. 2.2. Method Station of the crop land: Three plots were selected and three strains of corn for each observation were random selected for each plot to measure the fresh weight (the aboveground biomass and underground biomass) and dry weight. Per unit biomass can be obtained according to the planting structure. Station of the wetland: Two plots of reed with the area of 0.5 m × 0.5 m were random selected for each observation. The reed of the two plots was cut to measure the fresh weight (the aboveground biomass) and dry weight. 2.3. Instruments Balance (accuracy 0.01 g); drying oven 3. Data storage All observation data were stored in excel. Other data including plant spacing, row spacing, seeding time, irrigation time, the time of cutting male parent and the harvest time of the corn for the station of cropland were also stored in the excel.
GENG Liying, Jia Shuzhen, Li Yimeng, MA Mingguo
 mission in the Linze grassland foci experimental area (Jul. 4, 2008)")
The dataset of ground truth measurements synchronizing with the airborne microwave radiometers (L&K bands) mission was obtained in the Linze grassland foci experimental area on Jul. 4, 2008. Simultaneous ground observations on the land surface radiative temperature, the soil temperature and soil moisture were carried out along sampling stripes of newL1-newL12 (each has five points). At each point, soil gravimetric moisture, volumetric moisture, and soil bulk density after drying by the cutting ring, the mean soil temperature from 0-5cm by the probe thermometer, the canopy temperature and the land surface temperature by the hand-held infrared thermometer were measured. See WATER: Dataset of setting of the sampling plots and stripes in the foci experimental area of Linze station for more information.
GE Chunmei, HU Xiaoli, HUANG Chunlin, LI Hongxing, WANG Xufeng, ZHU Shijie, Wang Jing
")
The main contents of this data set are forest, shrub and grassland sample plot survey data.The fixed samples are located in the drainage ditch valley of qilian mountain and the dayaokou valley where the hydrology observation and test site of the water source conservation forest research institute of gansu province is located. The information of the sample is as follows: Number elevation quadrat size longitude latitude surface type G1 2715 20 × 20 100 ° 17 '12 "38 ° 33' 29" qinghai spruce forest G2 2800 20×36 100°17 '07 "38°33' 27" moss spruce forest G3 2840 20×20 100°17 '37 "38°33' 05" moss spruce forest G4 2952 20 × 20 100 ° 17 '59 "38 ° 32' 47" qinghai spruce forest G5 3015 20 × 20 100 ° 18 '06 "38 ° 32' 42" qinghai spruce forest G6 3100 20 × 20 100 ° 18 '13 "38 ° 32' 31" thicket qinghai spruce forest G7 3300 23.5 × 20 thickets qinghai spruce forest G8 2800 20×20 100°13 '30 "38°33' 29" moss spruce forest B1 2700 12.8×25 moss spruce forest B2 2800 20×20 100°17 '38 "38°32' 59" moss spruce forest B3 2900 20×20 100°17 '59 "38°32' 51" grass spruce forest B4 3028 20×20 100°17 '59 "38°32' 39" moss spruce forest B5 3097 20×20 100°18 '02 "38°32' 32" moss spruce forest B6 3195 20 × 20 100 ° 18 '06 "38 ° 32' 25" qinghai spruce forest B7 2762 20 × 20 100 ° 17 '08 "38 ° 33' 21" qinghai spruce forest B8 2730 20×20 100°17 '06 "38°33' 27" moss spruce forest GM1 3690 5×5 100°18 '02 "38°32' 02" caragana scrub (middle) GM2 3690 5×5 100°18 '02 "38°32' 02" caragana scrub (rare) GM3 3700 5×5 100°18 '03 "38°32' 03" caragana + jilaliu shrub (dense) GM4 3600 5×5 100°18 '10 "38°32' 06" caragana + jila willow thicket (middle) GM5 3600 5×5 100°18 '10 "38°32' 06" caragana + jila willow shrub (sparse) GM6 3600 5×5 100°18 '10 "38°32' 06" caragana + jila willow thicket (dense) GM7 3500 5×5 100°18 '14 "38°32' 08" caragana + jila willow thicket (middle) GM8 3500 5×5 100°18 '14 "38°32' 08" caragana + jila willow thicket (dense) GM9 3500 5×5 100°18 '14 "38°32' 08" caragana + jila willow thicket (rare) GM10 3400 5×5 100°18 '18 "38°32' 12" golden pheasant scrub (rare) GM11 3400 5×5 100°18 '18 "38°32' 12" golden pheasant + golden raspberry shrub (dense) GM12 3400 5×5 100°18 '18 "38°32' 12" golden pheasant scrub (rare) GM13 3300 5 × 5 100 ° 18 '21 "38 ° 32' 21" giraliu thicket GM14 3300 5 × 5 100 ° 18 '21 "38 ° 32' 21" caragana + jila shrub GM15 3300 5 × 5 100 ° 18 '21 "38 ° 32' 21" caragana + jila shrub YC3 2700 1×1 100°17 '14 "38°33' 33" needle thatch field YC4 2750 1×1 100°17 '18 "38°33' 32" needle thatch field YC5 2800 1×1 100°17 '21 "38°33' 33" needle thatch field YC6 2850 1×1 100°17 '25 "38°33' 33" needle thatch field YC7 2900 1×1 100°17 '31 "38°33' 32" aster + needle thatch field YC8 2950 1×1 100°17 '44 "38°33' 23" needle thatch field YC9 2980 1×1 100°17 '48 "38°33' 25" needle thatch field The sample geodesic tree data were surveyed from July to August 2007.The survey included: 1. Basic survey of sample plots in drainage ditch basin: A) sample land setting: sample land number, elevation, slope direction, slope position, slope, soil layer thickness, sample land size, longitude and latitude, community type, soil type, operation status, age B) survey of each wood in the sample plots: sample plot number, tree number, tree species, tree classification, chest diameter, tree height, undershoot height, crown radius 2. Soil profile survey record sheet Including forest/vegetation status, major tree species, forest age, soil name, surface soil erosion, parent rock and material, drainage conditions, land use history, soil profile (soil layer, moisture, color, texture, structure, root system, gravel content) 3. Standard ground cover factor Standard land area, dominant tree species, stand/vegetation origin, elevation, slope direction, slope position, slope, cutting and utilization method, afforestation land preparation type, survey method, canopy coverage, living ground cover, dead cover cover, litter thickness (undivided strata, semi-decomposed layer, decomposed layer) 4. Canopy survey: 5. Draft quadrat (1m×1m) survey record sheet Including species name, number, coverage, average height 6. Results of determination of soil physical properties in source forest of qilian mountain (land sample survey) Contains the soil physical properties measurement process (+ wet mud weight aluminum box, aluminum box, soil moisture content, suddenly bulk density, etc.), bringing biomass measurement (total fresh weight of shrub and herb, fresh weight of sample, sample dry weight, etc.), litter dry weight (including mosses) layer and the largest capacity calculation process (of moss and litter thickness, total fresh weight, fresh weight of samples, the dry weight of the sample, soaking for 24 h after heavy, maximum water holding capacity, the largest water depth, the biggest hold water rate, maximum moisture capacity) 7. Bush sample survey: Including species name, number, coverage, average height 8. Standard sample land setting and questionnaire for each wooden inspection ruler Including tree species, tree classification, age, chest diameter, number of height, undershoot height, crown radius 9. Litter layer survey record sheet Including litter (decomposed layer, semi-decomposed layer, decomposed layer) thickness 10. Update survey records: Including tree species, natural regeneration (height <30cm, height 31-50cm, height >51cm), artificial regeneration (height <30cm, height 31-50cm, height >51cm) This data set can provide ground measured data for remote sensing inversion of forest structure parameters.
WANG Shunli, LUO Longfa, WANG Rongxin, CHE Zongxi, JING Wenmao

The dataset of diurnal FPAR change observations was obtained by the quantum light meter (3415 series) in the Linze station foci experimental area. Each observation lasted from 9am to 5pm at intervals of 10 minutes, in the maize field and the sunflower field on Jun. 16, and in Wulidun farmland quadrates on Jul. 1, 2008. Located 15cm above the canopy, the quantum light meter was used to measure PARci and PARcr (at 0°, 30°, 45°, 60° and 90°); located 15cm above the ground, for PARgi and PARgr. And then PAR= (PARci- PARcr)- ( PARgi- PARgr); Fpar =PAR/ PARci. Data were archived as Excel files.
SONG Yi, BAI Yanfen, HAO Xiaohua, PAN Xiaoduo, SHU Lele, SONG Yi, WANG Yang, XU Zhen, ZHU Shijie
202024test test data 202024test test data 202024Test test data 202024test test data 202024test test data 202024test test data 202024test test data 202024test test data 202024test test data 202024test test data 202024test test data 202024test test data 202024test test data
MA Mingguo, DING Songchuang, GAO Song, Qian Jinbo, BAI Yunjie, WANG Xufeng, TAN Junlei, WANG Shuguo, GU Juan, WANG Shunli, LUO Longfa, WANG Rongxin, CHE Zongxi, JING Wenmao

The dataset of ground truth measurement synchronizing with MODIS was obtained in the Linze grassland foci experimental area on Jun. 2, 2008. Measurements were carried out twice at intervals of 125m in four quadrates (2km×2km), which were H01-H08, H09-H16, H17-H24 and H25-H32 respectively. Simultaneous ground data were mainly the canopy temperature, the half-height temperature, the land surface radiative temperature and the soil temperature (0-5cm) by the probe thermometer. For soil moisture, the soil temperature, soil moisture, the loss tangent, soil conductivity, and the real part and the imaginary part of soil complex permittivity were acquired by the POGO soil sensor, and soil gravimetric moisture, volumetric moisture, and soil bulk density after drying by the cutting ring inNo.1 quadrats (H01-H08), No.2 (H09-H16) and No.3 (H17-H24); and in No.4 quadrat 4 (H25-H32), soil moisture, soil conductivity, the soil temperature, the real part of soil complex permittivity were acquired by WET, soil gravimetric moisture, volumetric moisture, and soil bulk density after drying by the cutting ring. Complementary measurements were carried out on Jun. 3, 2008. The soil temperature, soil moisture, the loss tangent, soil conductivity, the real part and the imaginary part of soil complex permittivity were acquired by the POGO soil sensor, and soil gravimetric moisture, volumetric moisture, and soil bulk density after drying by the cutting ring in H41-H48, H49-H56 and H57-H64; and in H33-H40, soil moisture, soil conductivity, the soil temperature, and the real part of soil complex permittivity were acquired by WET, soil gravimetric moisture, volumetric moisture, and soil bulk density after drying by the cutting ring. Data were archived in Excel format. See WATER: Dataset of setting of the sampling plots and stripes in the Linze station foci experimental area for more information.
CHAO Zhenhua, NIAN Yanyun, WANG Xufeng, LIANG Wenguang
")
The fixed forest sample plot is located in the drainage ditch of Dayekou, Qilian Mountain, where the hydrological observation field of Gansu Water Conservation Forest Research Institute is located. From July 2003 to August 2003 and from July 2007 to August 2007, the tree survey of the sample plot was completed by technicians from Gansu Water Conservation Forest Research Institute and Institute of environment and Engineering in cold and dry areas of Chinese Academy of Sciences. A total of 17 fixed forest samples were observed, including the survey of sample plot factors and the survey of each tree. The observation factors of sample plots mainly include forest farm, longitude and latitude coordinates, slope direction, slope position, slope, soil thickness, canopy density of arbor layer, leaf area index, etc. The main instruments used in the measurement are tape, DBH, flower pole, tree measuring instrument, compass and fish eye camera. The measurement factors of each tree include DBH, height of tree, height under branch, crown width in cross slope direction, crown width along slope direction, growth status of single tree, etc. For details, please refer to the metadata of "Heihe River Integrated Remote Sensing joint test: fixed sample plot tree survey data set (2003)" and "Heihe River Integrated Remote Sensing joint test: fixed sample plot tree survey data set (2007)". The Lai in this data set is the supplementary measurement data during the joint remote sensing experiment of Heihe River in 2008. That is to say, the supplementary measurement of Lai has been done in these fixed plots. The supplementary observation time of Lai was from June 1 to 13, 2008. 15 of the 17 fixed plots were investigated. Four instruments were used to observe each plot. In addition to the commercial instruments such as hemiview fish eye camera, LAI-2000 and trac, these instruments also use the canopy analysis instrument made by Beijing Normal University. In each 20 m × 20 m plot, trac measures along two parallel routes perpendicular to the direction of sunlight incidence, which can basically represent the entire quadrat; hemiview fisheye camera and LAI-2000 measure the same points, that is, take three points on the trac line, plus the center point of the quadrat, a total of 7 measuring points. This set of data set can provide ground data for the study of remote sensing inversion method of forest structure parameters.
SONG Jinling, FU Zhuo, LI Shihua, ZOU Jie, ZHANG Xuelong, WANG Shunli, ZHAO Ming, LEI Jun, NIU Yun, LUO Longfa, LING Feilong, HE Qisheng, CHEN Erxue

The dataset of spectral reflectance observations was obtained in the Linze grassland foci experimental area. Spectral reflectance of the cement floor, reed, the saline field, alfalfa, barley and the pool in the reed plot A, the saline plot B, the alfalfa plot D and the barley plot E were measured by ASD and the reference board (20% and 40%). Observation date Plot 2008-05-30 A、B、D、E 2008-06-03 B 2008-06-06 E 2008-06-15 The cement floor (the station) 2008-06-15 The alfalfa field 2008-06-15 The pool in Majuntan 2008-06-15 The cement floor in Majuntan 2008-06-16 A、B、 D、 E Five files on original binary data, one software file and six record forms were archived. See WATER: Dataset of setting of the sampling plots and stripes in the foci experimental area of Linze station for more information.
Wang Jing, HU Xiaoli, JIANG Xi, MA Mingguo, WANG Xufeng, YU Yingjie, HAO Xiaohua
Contact Support
Links
National Tibetan Plateau Data CenterFollow Us

A Big Earth Data Platform for Three Poles © 2018-2020 No.05000491 | All Rights Reserved
|  No.11010502040845
Tech Support: westdc.cn

