202024test test data 202024test test data 202024Test test data 202024test test data 202024test test data 202024test test data 202024test test data 202024test test data 202024test test data 202024test test data 202024test test data 202024test test data 202024test test data
MA Mingguo, DING Songchuang, GAO Song, Qian Jinbo, BAI Yunjie, WANG Xufeng, TAN Junlei, WANG Shuguo, GU Juan, WANG Shunli, LUO Longfa, WANG Rongxin, CHE Zongxi, JING Wenmao
")
A typical Shaker type potassium ion absorption channel gene AmKAT1 was cloned from the leaves of Ammopiptanthus mongolicus. Electrophysiological studies of AmKAT1 show that AmKAT1 is a K+ absorption channel regulated by potassium ion concentration. the system can only input K+ into guard cells when the extracellular potassium ion concentration is high (above 10 mmol/L). This distinctive feature has important physiological significance for xerophytes such as Ammopiptanthus mongolicus: under the condition of low concentration of extracellular potassium ions (no matter how high the concentration of sodium ions), AmKAT1 is difficult to open, potassium ions cannot enter guard cells, the guard cells will not absorb water and expand, and stomata will be difficult to open, thus reducing the transpiration and loss of water in Ammopiptanthus mongolicus and enhancing the viability of Ammopiptanthus mongolicus in arid environment. We have further studied the mechanism of extracellular potassium ion regulating the activity of AmKAT1 and found that at least two sites in AmKAT1 are involved in potassium ion induction, and now one site has been determined to be located in the channel pore region. In addition, we cloned a guard cell export-oriented K+ channel AmGORK and a slow anion channel AmSLAC1. Fluorescence quantitative PCR results showed that AmGORK was mainly expressed in the upper part of the ground, and its transcription level was affected by PEG simulated water stress, ABA, NaCl and osmotic stress treatments to varying degrees. Electrophysiological studies in xenogeneic system of Xenopus laevis oocytes show that AmGORK channel of Mongolian Ammopiptanthus mongolicus guard cells can mediate efficient efflux of K+ when membrane potential is depolarized. The activation of this channel has typical voltage dependence and potassium ion concentration dependence, and is inhibited by potassium ion channel inhibitors TEA and Ba2+; In addition, the activity of AmGORK is regulated by extracellular pH, but not by extracellular calcium concentration. These results show that although Ammopiptanthus mongolicus is an ancient drought-resistant leguminous shrub originated millions of years ago, it is highly similar to the existing common model plant Arabidopsis thaliana in the stomatal closure mechanism dominated by K+. These results provide evidence to preliminarily reveal the functional conservatism of GORK-like stomatal regulatory channels in different species and long-term evolution.
SU Yanhua

The leaf cross-sectional structure of constructive species in arid area of the middle and lower reaches of Heihe River Basin. The material number is consistent with the sampling table. Refer to the sampling table number to determine the material and its distribution position. A semi thin section of 65 dominant plants. The mesophyll structure of C3 and C4 plants, the characteristics of palisade tissue and sponge tissue, as well as the special structure including crystalloid cells can be reflected.
LIU Yubing
")
The algorithm firstly adopts the canopy BRDF model and represents the canopy reflectivity as a function of a series of parameters such as LAI/FAPAR, wavelength, reflectivity of soil and leaves, aggregation index, incidence and observation Angle.The parameter table is established for several key parameters as the input of inversion.Then input the pre-processed surface reflectance data and land cover data, and use look-up table (LUT) inversion to obtain FAPAR products.See references for detailed algorithms. Image format: tif Image size: about 1M per scene Time range: 2000-2012 Temporal resolution: 8 days Spatial resolution: 1km
FAN Wenjie

The dataset of BRDF observations was obtained in the Yingke oasis and Huazhaizi desert steppe foci experimental areas. Reflectance could be got based on R = (DN1/DN0)×R0, DN1 indicating DN of the item, R0 and DN0 the reflectance and DN of the grey board. Synchronizing with WiDAS and OMIS-II, the ground observations on reflectance (-60°~60° at intervals of 10°) of maize and wheat were carried out with ASD (FOV: 25°) and the self-made observation platform (maximum height: 5m) on May 30, Jun. 9, 14, 20, 22, 26 and 30, and Jul. 1, 2008. Raw data, recorded data and processed BRDF were archived in Excel format.
CHEN Ling, REN Huazhong, WANG Haoxing, YAN Guangkuo, ZHANG Wuming, XIN Xiaozhou, ZHANG Yang, FAN Wenjie, TAO Xin
 mission in the Yingke oasis and Huazhaizi desert steppe foci experimental areas on Jun. 4, 2008")
The dataset of ground truth measurement synchronizing with the airborne imaging spectrometer (OMIS-II) mission was obtained in the Yingke oasis and Huazhaizi desert steppe foci experimental areas on Jun. 4, 2008. Observation items included: (1) ground object reflectance spectra of maize and wheat in Yingke oasis maize field by ASD FieldSpec (350~2500 nm, the vertical canopy observation and the transect observation) from Institute of Remote Sensing Applications (CAS); and of the black and white cloth, the water body, vegetation and the cement floor in the resort calibration site by ASD (350-2500nm, fixed points observation) from BNU. Raw data were binary files direct from ASD (by ViewSpecPro), and pre-processed data on reflectance were in Excel format. (2) The radiative temperature in Yingke oasis maize field (the transect observation), Yingke oasis wheat field (the transect observation), the maize field (intensive) near the resort (the transect observation) and Huazhaizi desert No. 1 plot (the diagonal and the fixed point observation) by the handheld infrared thermometer (emissivity: 1.00). As for the fixed point observation, 25 corner points were chosen in the plot of 30m×30m, and at each point, the bare land was measured twice and the vegetation once. Raw data (in Word format), blackbody calibrated data and processed data (in Excel format) were all archived. (3) Atmospheric parameters on the ICBC resort office roof by CE318 (produced by CIMEL in France) from Institute of Remote Sensing Applications. The total optical depth, aerosol optical depth, Rayleigh scattering coefficient, column water vapor in 936 nm, particle size spectrum and phase function were then retrieved from these observations. The optical depth in 1640nm, 1020nm, 936nm, 870nm, 670nm, 550nm, 440nm, 380nm and 340nm were all acquired by CE318. Those data include the raw data in .k7 format and can be opened by ASTPWin. ReadMe.txt is attached for detail. Processed data (after retrieval of the raw data) in Excel format are on optical depth, rayleigh scattering, aerosol optical depth, the horizontal visibility, the near surface air temperature, the solar azimuth, zenith, solar distance correlation factors, and air column mass number. (4) Photosynthesis of wheat and maize by LI6400 in Yingke oasis maize field, carried out according to WATER specifications. Raw data were archived in the user-defined format (by notepat.exe) and processed data were in Excel format. (5) the radiative temperature vegetation (Reaumuria soongorica) and the bare land in Huazhaizi desert No. 1 plot by ThermaCAM SC2000 ( (1.2m above the ground, FOV = 24°×18°),. The data included raw data (read by ThermaCAM Researcher 2001), recorded data and the blackbody calibrated data (archived in Excel format). (6) the radiative temperature by the automatic thermometer at nadir in Yingke oasis maize field (2 from BNU, FOV: 10°; emissivity: 0.95, at intervals of 1s, set above the maize canopy and the bare land between ridges and the third from Institute of Remote Sensing Applications, emissivity: 1.0, at intervals of 0.05s, set above the maize canopy), Yingke wheat field (one set above the wheat canopy), Huazhaizi desert No. 1 plot (one set above the barley canopy), and in the resort calibration site (one for the cement floor). Raw data, blackbody calibrated data and processed data were all archived in Excel format. (7) Wheat albedo by the shortwave radiometer in Yingke oasis maize field. R =10H (R for FOV radius; H for the probe height). Data were archived in Excel format. (8) Wheat FPAR (Fraction of Photosynthetically Active Radiation) by SUNSACN and the digital camera in Yingke oasis maize field. FPAR= (canopyPAR-surface transmissionPAR-canopy reflection PAR+surface reflectionPAR) /canopy PAR; APAR=FPAR* canopy PAR. Data were archived in the table format of Word. (9) LAI in Yingke oasis maize field. The maximum leaf length and width of each maize and wheat were measured. Data were from Jun. 6, 2008, archived in Excel format.
CHEN Ling, REN Huazhong, ZHOU Hongmin, CAO Yongpan, SHU Lele, WU Yueru, XU Zhen, LI Li, LIU Sihan, XIA Chuanfu, XIN Xiaozhou, ZHOU Chunyan, ZHOU Mengwei, FAN Wenjie, TAO Xin, FENG Lei, LIANG Wenguang, YU Fan, WANG Dacheng, YANG Guijun, LI Xiaoyu, Liu Liangyun
")
Image format: tif Image size: about 925M per scene Time range: may-october 2012 Time resolution: month Spatial resolution: 30m The algorithm firstly adopts the canopy BRDF model and presents the canopy reflectivity as a function of a series of parameters such as FAPAR, wavelength, reflectance of soil and leaves, aggregation index, incidence and observation Angle.The parameter table is established for several key parameters as the input of inversion.Then input the pre-processed surface reflectance data and land cover data, and invert LAI/FAPAR products by look-up table (LUT) method. See references for detailed algorithm.
")
SPAC system is a comprehensive platform for observation of plant transpiration water consumption and environmental factors. In this project, a set of SPAC system is set up in the Alxa Desert eco hydrological experimental study. The main observation data include temperature, relative humidity, precipitation, photosynthetic effective radiation, etc. the sampling frequency is one hour. This data provides basic data support for the study of plant transpiration water environmental response mechanism.
SI Jianhua

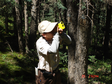
The data is a fisheye photo above the interception barrel of the Picea crassifolia plot in the Tianlaochi small watershed of Qilian Mountain. The plot has a latitude and longitude of 38.44N, 99.91E, and an altitude of 2793m. Photo DSC_0008——DSC_0097 corresponds to Fisheye photos above interception barrels 1 to 90 respectively. The camera is directly above the interception barrel and the lens is 1m above the ground. It is used to estimate the cover or LAI of Qinghai spruce forest, and the pictures are processed with Gap Light Analyzer software.
ZHAO Chuanyan, MA Wenying
")
The data set contains the observation data of thermal diffusion fluid flow meters at the downstream mixed forest station and eupoplar forest station of the hydrometeorological observation network from January 1 to December 31, 2014. La shan au in the study area is located in the Inner Mongolia autonomous region of mesozoic-cenozoic in iminqak, according to the different height and diameter at breast height of iminqak, choose sampling tree installation TDP (Thermal Dissipation SAP flow velocity Probe, Thermal diffusion flow meter), domestic TDP pin type Thermal diffusion stem flow meter, the model for TDP30.The sample sites are TDP1 point and TDP2 point respectively, which are located near the mixed forest station and populus populus station.The height of the sample tree is TDP2 and TDP1 from high to low, and the diameter of the chest is TDP1 and TDP2 from large to small, so as to measure the trunk fluid flow on behalf of the whole area.The installation height of the probe is 1.3 meters and the installation orientation is due east and west of the sample tree. The original observation data of TDP is the temperature difference between probes, which is collected once for 10s and the average output period is 10 minutes.The published data are calculated and processed trunk flow data, including flow rate (cm/h), flux (cm3/h) and daily transpiration (mm/d) per 10 minutes.Firstly, the liquid flow rate and liquid flux were calculated according to the temperature difference between the probes, and then the transpiration Q per unit area of the forest zone was calculated according to the area of Euphrates poplar forest and the distance between trees at the observation points.At the same time, post-processing was carried out on the calculated rate and flux value :(1) data that obviously exceeded the physical significance or the instrument range were removed;(2) the missing data is marked with -6999;Among them, the data of TDP2 was missing due to power supply problems from 1.1-2.8 days, and the data of the third group of probes was missing from 2.8-3.13 days due to the problems of the third group of probes.(3) suspicious data caused by probe fault or other reasons shall be identified in red, and the data confirmed to have problems shall be removed. Please refer to Li et al.(2013) for hydrometeorological network or site information, and Qiao et al.(2015) for observation data processing.
LIU Shaomin, LI Xin, CHE Tao, XU Ziwei, REN Zhiguo, TAN Junlei
")
The dataset includes the fractional vegetation cover data generated from the stations of crop land, wetland, Gebi desert and desert steppe in Yingke Oasis and biomass data generated from the stations of crop land (corn) and wetland. The observations lasted for a vegetation growth cycle from 19 May, 2012 to 15 September, 2012. 1. Fractional vegetation cover observation 1.1 Observation time 1.1.1 Station of the crop land: The observations lasted from 20 May, 2012 to 15 September, 2012, and in five-day periods for each observation before 31 July and in ten-day periods for each observation after 31 July. The observation time for the station of crop land (corn) are 2013-5-20, 2013-5-25, 2013-5-30, 2013-6-5, 2013-6-10, 2013-6-16, 2013-6-22, 2013-6-27, 2013-7-2, 2013-7-7, 2013-7-12, 2013-7-17, 2013-7-27, 2013-8-3, 2013-8-13, 2013-8-25, 2013-9-5 and 2013-9-15. 1.1.2 The other four stations: The observations lasted from 20 May, 2012 to 15 September, 2012 and in ten-day periods for each observation. The observation time for the crop land are 2013-5-20, 2013-6-5, 2013-6-16, 2013-6-27, 2013-7-7, 2013-7-17, 2013-7-27, 2013-8-3, 2013-8-13, 2013-8-25, 2013-9-5 and 2013-9-15. 1.2 method 1.2.1 Instruments and measurement method Digital photography measurement is implemented to measure the FVC. Plot positions, photographic method and data processing method are dedicatedly designed. In field measurements, a long stick with the camera mounted on one end is beneficial to conveniently measure various species of vegetation, enabling a larger area to be photographed with a smaller field of view. The stick can be used to change the camera height; a fixed-focus camera can be placed at the end of the instrument platform at the front end of the support bar, and the camera can be operated by remote control. 1.2.2 Design of the samples Three and two plots with the area of 10×10 m^2 were measured for the station of the crop land and wetland, respectively. One plot with the area of 10×10 m^2 was measured for the other three stations. Shoot 9 times along two perpendicularly crossed rectangular-belt transects. The picture generated of each time is used to calculate a FVC value. “True FVC” of the plot is then acquired as the average of these 9 FVC values. 1.2.3 Photographic method The photographic method used depends on the species of vegetation and planting pattern. A long stick with the camera mounted on one end is used for the stations of crop land and wetland. For the station of the crop land, rows of more than two cycles should be included in the field of view (<30), and the side length of the image should be parallel to the row. If there are no more than two complete cycles, then information regarding row spacing and plant spacing are required. The FVC of the entire cycle, that is, the FVC of the quadrat, can be obtained from the number of rows included in the field of view. For other three stations, the photos of FVC were obtained by directly photographing for the lower heights of the vegetation. 1.2.4 Method for calculating the FVC The FVC calculation was implemented by the Beijing Normal University. The detail method can be found in the reference below. Many methods are available to extract the FVC from digital images, and the degree of automation and the precision of identification are important factors that affect the efficiency of field measurements. This method, which is proposed by the authors, has the advantages of a simple algorithm, a high degree of automation and high precision, as well as ease of operation (see the reference). 2. Biomass observation 2.1. Observation time 2.1.1 Station of the crop land: The observations lasted from 20 May 2012 to 15 September 2012, and in five-day periods for each observation before 31 July and in ten-day periods for each observation after 31 July. The observation time for the crop land are 2013-5-25, 2013-5-30, 2013-6-5, 2013-6-10, 2013-6-16, 2013-6-22, 2013-6-27, 2013-7-2, 2013-7-7, 2013-7-12, 2013-7-17, 2013-7-27, 2013-8-3, 2013-8-13, 2013-8-25, 2013-9-5 and 2013-9-15. 2.1.2 The station of wetland: The observations lasted from 20 May 2012 to 15 September 2012, and in ten-day periods for each observation. The observation time for the crop land are 2013-6-5, 2013-6-16, 2013-6-27, 2013-7-7, 2013-7-17, 2013-7-27, 2013-8-3, 2013-8-13, 2013-8-25, 2013-9-5 and 2013-9-15. 2.2. Method Station of the crop land: Three plots were selected and three strains of corn for each observation were random selected for each plot to measure the fresh weight (the aboveground biomass and underground biomass) and dry weight. Per unit biomass can be obtained according to the planting structure. Station of the wetland: Two plots of reed with the area of 0.5 m × 0.5 m were random selected for each observation. The reed of the two plots was cut to measure the fresh weight (the aboveground biomass) and dry weight. 2.3. Instruments Balance (accuracy 0.01 g); drying oven 3. Data storage All observation data were stored in excel. Other data including plant spacing, row spacing, seeding time, irrigation time, the time of cutting male parent and the harvest time of the corn for the station of cropland were also stored in the excel.
GENG Liying, Jia Shuzhen, Li Yimeng, MA Mingguo

The dataset of ground truth measurement synchronizing with PROBA CHRIS was obtained in the Yingke oasis and Huazhaizi desert steppe foci experimental areas on Jul. 1, 2008. Observation items included: (1) FPAR (Fraction of Photosynthetically Active Radiation) of maize and wheat by SUNSACN and the digital camera in Yingke oasis maize field. FPAR= (canopyPAR-surface transmissionPAR-canopy reflection PAR+surface reflectionPAR) /canopy PAR; APAR=FPAR* canopy PAR. Data were archived in the table format of Word. (2) BRDF of maize by ASD (350~2 500 nm) from Institute of Remote Sensing Applications (CAS) and the self-made multi-angluar observation platform of BNU make in Yingke oasis maize field. The maximum height of the platform was 5m above the ground with the azimuth 0~360° and the zenith angle -60°~60°. An automatic thermometer was attached to the platform for the multiangle radiative temperature. Raw data were binary files direct from ASD (by ViewSpecPro), and pre-processed data on reflectance were in Excel. (3) The radiative temperature of the maize canopy by the automatic thermometer (emissivity: 0.95),at a hight of 50cm from the crown in Yingke oasis maize field. Raw data, blackbody calibrated data and processed data were all archived in Excel format. (4) Atmospheric parameters at the resort by CE318 (produced by CIMEL in France). The total optical depth, aerosol optical depth, Rayleigh scattering coefficient, column water vapor in 936 nm, particle size spectrum and phase function were then retrieved from these observations. The optical depth in 1020nm, 936nm, 870nm, 670nm and 440nm were all acquired by CE318. Those data include the raw data in k7 format and can be opened by ASTPWin. ReadMe.txt is attached for details. Processed data (after retrieval of the raw data) in Excel format are on optical depth, rayleigh scattering, aerosol optical depth, the horizontal visibility, the near surface air temperature, the solar azimuth, zenith, solar distance correlation factors, and air column mass number. (5) The multiangle radiative temperature by the automatic thermometer (emissivity: 1.0) attached on the observation platform, at an interval of 0.05s. The data were archived in .txt files (.dat format). The first seven lines were the header file, including acquisition date, time, and intervals; besides, Time (starting time), TObj (target temperature), Tint (the interior temperature of the probe), TBox (the temperature of the box) and Tact (the actual temperature calculated from the given emissivity) were also listed.
CHEN Ling, REN Huazhong, XIAO Yueting, SU Gaoli, WU Mingquan, WU Chaoyang, XIA Chuanfu, ZHOU Chunyan, ZHOU Mengwei, SHEN Xinyi, YANG Guijun

The experimental project of vegetation degradation mechanism and reconstruction in Yuanjiang dry-hot valley in Yunnan belongs to the major research program of "Environmental and Ecological Science in Western China" of the National Natural Science Foundation. The principal is researcher Cao Kunfang of Xishuangbanna Tropical Botanical Garden, Chinese Academy of Sciences. The project runs from January 2004 to December 2007. Data collected for this project include: 1. Excel table of multi-year average temperature and rainfall in Yuanjiang dry-hot valley (1961-2004), with attribute fields including monthly average temperature and monthly average rainfall. 2. excel table of annual average temperature (1750-2006) in the middle of Hengduan Mountain in China based on tree ring, with attribute fields including year and reconstructed average temperature. 3. excel table of summer temperatures (1750-2006) in the central Hengduan Mountains in southern China based on tree rings. The attribute fields include the year and the reconstructed average temperature in summer (April-September). 4. excel table of drought index (1655-2005) in central Hengduan Mountains of China based on tree rotation, with attribute fields including year and reconstruction of drought index in spring (March-May). 5. pdf file of growth dynamic graph of leaves and branches. it records the growth dynamic trend line and leaf dynamic trend graph of plants with s-type, f-type, intermediate-type and S+SD-type branches from March 22, 2004 to April 8, 2005. 6.32 Phenological Summary Tables of Woody Plants (word Document: Specific Name, Number of Observed Plants/Branches, Type of Branch Extension, Leaf Phenology, Length of Current Year Branches (cm), Total Leaves on Branches, Leaf Area (cm2), Non-leaf Period (Months), Flowering Period, Fruit Ripening Period and Fruit Type) 7. Seasonal Changes of Relative Water Content of Plant Leaves in Yuanjiang Dry-hot Valley (March 2003-February 2004) Excel Table 8. Seasonal Changes of Photosynthesis of 6 Representative Plants in Yuanjiang Dry-hot Valley (Maximum Photosynthetic Rate, Stomatal Conductance, Water Use Efficiency, Maximum Subefficiency of photosystem II) excle Table (2003-2005) 9. excle Table of Long-term Water Use Efficiency (Isotope) Data of Representative Plants in Yuanjiang Dry-hot Valley (Water Use Efficiency in Dry and Wet Seasons of Shrimp Flower, Red-skin Water Brocade Tree, Three-leaf Lacquer, Phyllanthus emblica, Pearl Tree, Dried Sky Fruit, Cyclobalanopsis glauca, West China Small Stone Accumulation, Geranium, Tiger thorn, Willow and Pigexcrement Bean) 10. word Document of List of Plants in Mandan Qianshan, Yuanjiang
CAO Kunfang

The data set include crop leaf chlorophyll content observed at four sample regions, that is the soil moisture control experimental field at Daman county, and the EC plots, the super station, and Shiqiao sample plots at Wuxing village in Zhangye city. 1) Objective Crop leaf chlorophyll content, a key biophysical parameter, was observed as model parameter or a priori knowledge for canopy radiative transfer model or eco-hydrological models. 2) Measuring instruments SPAD. 3) Measuring site a. the soil moisture control experimental field at Daman county, Twelve soil water treatments are set. The wheat leaf chlorophyll content for each treatment is measured on 17, 23 and 29 May, and 3, 9, 14 and 24 June, and 5 and 12 July. b. the EC site The maize leaf chlorophyll content at 14 EC site (EC-2,EC-3,EC-5,EC-6,EC-7,EC-8,EC-9, EC-10, EC-11, EC-12, EC-13, EC-14, EC-15, EC-16) are measured on 14, 21, 25 and 31 May, 7, 13, 23 and 28 June, 3, 13, 18 and 23 July, 3, 12 and 28 August. c. the Super Station The maize chlorophyll content at the super station is measured on 22 and 28 May, 5, 11, 18, and 25 June, and 1, 8, 15, 22 and 31 July, 9, 15 and 22 August, and 3 and 11 September. d. the Shiqiao sample site The maize chlorophyll content at the Shiqiao village is measured on 17, 22 and 28 May, 4, 11, 17 and 25 June, 1, 8, 15, 22, and 30 July, 8, 16 and 27 August, and 9 September. 4) Data processing The observational data was recorded in the sheets and reorganized in the EXCEL sheets. The time used in this dataset is in UTC+8 Time.
Xu Fengying, Wang Jing, Huang Yongsheng, LI Xin, MA Mingguo

The dataset of ground truth measurement synchronizing with the airborne WiDAS mission was obtained in the Yingke oasis and Huazhaizi desert steppe foci experimental areas on Jul. 11, 2008. WiDAS, composed of four CCD cameras, one mid-infrared thermal imager (AGEMA 550), and one infrared thermal imager (S60), can acquire CCD, MIR and TIR band data. The simultaneous ground data included: (1) Atmospheric parameters in Huazhaizi desert No. 2 plot from CE318 (produced by CIMEL in France). The total optical depth, aerosol optical depth, Rayleigh scattering coefficient, column water vapor in 936 nm, particle size spectrum and phase function were then retrieved from these observations. The optical depth in 1020nm, 936nm, 870nm, 670nm and 440nm were all acquired by CE318. Those data include the raw data in k7 format and can be opened by ASTPWin. ReadMe.txt is attached for details. Processed data (after retrieval of the raw data) in Excel format are on optical depth, Rayleigh scattering, aerosol optical depth, the horizontal visibility, the near surface air temperature, the solar azimuth, zenith, solar distance correlation factors, and air column mass number. (2) Radiative temperature of maize, wheat and the bare land (in Yingke oasis maize field), vegetation and the bare land (Huazhaizi desert No. 2 plot) by the thermal cameras at a height of 1.2m above the ground. Optical photos of the scene were also taken. Raw data (read by ThermaCAM Researcher 2001) was archived in IMG format and radiative files are stored in Excel format. . (3) Photosynthesis by LI6400 in Yingke oasis maize field, carried out according to WATER specifications. Raw data were archived in the user-defined format (by notepat.exe) and processed data were in Excel format. (4) Ground object reflectance spectra in Yingke oasis maize field, Huazhaizi maize field, Huazhaizi desert No. 1 and 2 plots, by ASD FieldSpec (350~2500 nm) from Institute of Remote Sensing Applications (IRSA), CAS. Raw data were binary files direct from ASD (by ViewSpecPro), which were recorded daily in detail, and pre-processed data on reflectance were in .txt format. (5) The radiative temperature in Huazhaizi desert No. 2 plot by the handheld infrared thermometer (BNU and IRSA). Raw data, blackbody calibrated data and processed data (in Excel format) were all archived. (6) FPAR (Fraction of Photosynthetically Active Radiation) by SUNSACN and the digital camera in Yingke oasis maize field. FPAR= (canopyPAR-surface transmissionPAR-canopy reflection PAR+surface reflectionPAR) /canopy PAR; APAR=FPAR* canopy PAR. Data were archived in Excel format. (7) The radiative temperature of the maize canopy by the automatic thermometer (FOV: 10°; emissivity: 0.95) mearsued at nadir with an time intervals of 1s in Huazhaizi desert maize field. Raw data, blackbody calibrated data and processed data were all archived as Excel files. (8) Maize albedo from two shortwave radiometer in Yingke oasis maize field. R =10H (R for FOV radius; H for the probe height). Data were archived in Excel format.
REN Huazhong, WANG Tianxing, YAN Guangkuo, LI Li, LI Hua, LIU Sihan, XIA Chuanfu, XIN Xiaozhou, ZHOU Chunyan, ZHOU Mengwei, YANG Guijun, LI Xiaoyu, CHENG Zhanhui, Liu Liangyun
")
The dataset of spectral reflectance measurements was obtained in the A'rou foci experimental area on Mar. 12, 2008. The land was covered with snow 10cm deep. Observed objects included snow, sandstone, grass and ice. The data were archived in the ASCII format, with the first five rows as the file header and the following two columns as wavelength (nm) and reflectance (percentage) respectively, and can be opened by .txt or wordpad. Raw data were binary files direct from ASD (by ViewSpecPro).
PENG Danqing, ZHENG Yue

The dataset of spectral reflectance of canopy leafs observed by the integrating sphere was obtained by ASD Spectroradiometer (350~2 500 nm) and integrating spheres from BNU and the reference board (40% before Jun. 15 and 20% hereafter), in the Linze station foci experimental area. Maize quadrate, the desert green quadrate and withered scrub quadrate in Linze station (on May 28, 30, Jun. 19, 30 and Jul. 9), Wulidun farmland quadrates (on Jun. 24, 29 and Jul. 11) and the desert strips were measured. According to the fact that the ratio of the two DN values equals that of their reflectivity, the reflectivity and the tranmittivity can be calculated with the caliberation coefficient, reflection DN of the observed objects and reference plates. The reflectivity and the tranmittivity of interior vegetation leaves can be got by the integrating spheres. Raw spectral data were archived as binary files, which were recorded daily in detail, and pre-processed data on reflectance and transmittivity were archived as text files (.txt).
LI Jing, Li Xiangyun, Qu Yonghua, SUN Qingsong, XIAO Zhiqiang, YU Yingjie, LIU Sihan, BAI Yanfen, WANG Yang, CHEN Shaohui, JIANG Hao, LI Shihua

The dataset of diurnal change of FPAR observations was obtained by the quantum meter in the Linze grassland foci experimental area. Incident and reflected radiation of canopy, and land surface in reed, saline grass, alfalfa, cumin and barley were measured and diurnal changes of PAR and Fpar were also acquired. Observations were carried out: In plot E (barley) and cumin field on Jun. 6, 2008; plot D (alfalfa) and plot E on Jun. 11; plot D and E on Jun. 15; plot E on Jun. 16; plot A (reed) on Jun. 20; plot B (saline) on Jun. 22; plot D and E on Jun. 23; plot B (saline) on Jun. 24; plot A and plot E on Jun. 29. 14 Excel files, one Word and one .TXT were archived. See Water: The dataset of setting of the sampling plots and stripes in the Linze grassland foci experimental area for more information.
CAO Yongpan, CHAO Zhenhua, GE Chunmei, HU Xiaoli, HUANG Chunlin, LIANG Ji, NIAN Yanyun, WANG Shuguo, WANG Xufeng, WU Yueru, LI Xiaoyu
")
The dataset is Lai data of ground sample points in Heihe River Basin, collected by LAI-2000 canopy analyzer. The collection area is located in Zhangye rural demonstration base, Ejina Banner, Jiuquan Satellite Center (2011) and other areas. The main measured vegetation is corn. The Lai value of maize was obtained by using lai2000, and the observation was repeated twice in the mode of one up four down. Cd202 was used to obtain the leaf area of each leaf of maize plant, and three maize plants were collected.
FAN Wenjie
")
The data set is the global ecosystem respiratory data, including the ecosystem autotrophic respiration (Ra) and heterotrophic respiration (Rh). It was obtained by the CNRM-CM6-1 mode simulation of CMIP6 under the Historical scenario. The time range of the data covers from 1850 to 2014, the time resolution is a month, and the spatial resolution is about 1.406°×1.389°. For the simulated data details, please go to the following link: http://www.umr-cnrm.fr/cmip6/spip.php?article11.
Program for Climate Model Diagnosis and Intercomparison (PCMDI)
Contact Support
Links
National Tibetan Plateau Data CenterFollow Us

A Big Earth Data Platform for Three Poles © 2018-2020 No.05000491 | All Rights Reserved
|  No.11010502040845
Tech Support: westdc.cn

