")
This dataset is derived from the paper: Su, T. et al. (2019). No high tibetan plateau until the Neogene. Science Advances, 5(3), eaav2189. doi:10.1126/sciadv.aav2189 This data contains supplementary material of this article. Researchers discovered well-preserved palm fossil leaves from the Lunpola Basin (32.033°N, 89.767°E), central Tibetan Plateau at a present elevation of 4655 m in 2016. Researchers compared the newly discovered fossil with those present fossil that are most similar, find that there is no similar leaves among present fossil, therefore, researchers proposed the new species <em>S. tibetensis</em> T. Su et Z.K. Zhou sp. nov. Using the climate model, combined with the research of the fossil, researchers rebuilt the paleoelevation of the central Tibetan Plateau, it shows that a high plateau cannot have existed in the core of Tibet in the Paleogene. The data contains the following tables: 1) Table S1. Fossil records of palms around the world. 2) Table S2. Morphological comparisons between fossils from Lunpola Basin and modern palm genera. 3) Table S3. Climate ranges of 12 living genera that show the closest morphological similarity to <em>S. tibetensis</em> T. Su et Z.K. Zhou sp. nov. This dataset also contains the figures in the supplementary material in the article.
SU Tao
")
This data set contains the digital slope distribution and slope degree data of the Tibetan Plateau, which can be used to assist in basic geographic information analysis and research work on the Tibetan Plateau region. The raw data were the Shuttle Radar Topography Mission (SRTM) data provided by Global Land Cover Network (GLCN) using the WGS84 coordinate system, and the raw data were framing data, including latitude and longitude data, with a spatial resolution of 3″. After the mosaic processing, the Nodata (null data) generated in the mosaic process were interpolated and filled, and after filling, a projection conversion process was performed to generate an equal-area conical projection of the data bit Albers, after conversion projection, the spatial resolution was 90 m. Finally, the boundary of the Tibetan Plateau was used for cutting to obtain DEM data. Use the spatial analysis module under ArcMap to calculate the slope aspect and generate the slope map. Field: value Data type: floating point Interpretation: slope degree Dimension: degree Data accuracy: spatial resolution 90 m
Food and Agriculture Organization of the United Nations
")
This data set is a three-level classification map of Eurasian grassland remote sensing in 2009. The data is in TIF grid format, with a spatial resolution of 1km. The three-level grassland is classified as: temperate meadow grassland, temperate typical grassland, temperate desertification grassland, temperate grassland desertification, and temperate desert. The data is processed according to the ESA global cover 2009 Product global cover map, combined with the historical meteorological data (precipitation, annual accumulated temperature, humidity coefficient, evaporation) and DEM data of ECMWF website. The data can be used to provide the basis for the distribution information and temporal and spatial variation analysis of warm grassland in Eurasia.
TANG Jiakui

The data is clipped from "1: 1 million wetland data of China". "1: 1 million wetland data of China" mainly reflects the national marsh wetland information in the 2000s. It is expressed in geographic coordinates using the decimal degree. The main contents include: marsh wetland types, wetland water supply types, soil types, main vegetation types, geographical area, etc. Implemented the "Standard for Information Classification and Coding of Sustainable Development Information Sharing System of China". Data source of this database: 1:20 swamp map (internal version), Tibetan Plateau 1: 500,000 swamp map (internal version), swamp survey data 1: 1 million and national 1: 4 million swamp map; processing steps are: data source selection, preprocessing, digitization and encoding of marsh wetland elements, data editing processing, establishing topological relationships, edge processing, projection conversion, linking with attribute databases such as place names and obtaining attribute data.
ZHANG Shuqing

The Shiyang River Basin Information System thematic data set is one of the results of the technical assistance project “Optimization of Desertification Control in Gansu Province” assisted by the Asian Development Bank, including 5 folders including document, investigation_point, maps, photo, and spatial. Each file The folder contains several files. The document folder includes the target design, data processing, thematic summary report, and projection information.The gpspoint folder includes files recorded in shapefile point format sampled by gps according to different purposes.The maps folder contains Chinese, english, and fonts files. Folder, the first two folders represent 14 Chinese and English maps stored in A4 format and pdf format, and fonts contain some special fonts: the photo folder contains field survey digital photos stored in bmp format: spatial The folder contains the dem folder of the digital elevation model, the gansu folder of the outline map of Gansu Province and the Hexi Corridor, the generate folder of the site data file shapefile, the grid folder of the raster data of various geographic features, and the remote sensing image. image folder, meteoHydro folder for original site text data, and vector folder for vector data for various geographic features. The data includes: 1. DEM folder: 100m dem, hillshade, divided into GRID and geotif formats 2. Gansu folder: Gansu border, Hexi border 3. Grid folder: NDVI (vegetation index), lndchange (land transfer matrix), landscape86 (land landscape map in 86 years), landscape2k (land landscape map in 2000), Desertiftype (desert type landscape map), Desersevrt (desert type map ), Annprecip 4. Meteohydro folder: Minqin, Wuwei, Yongchang meteorological data (1) daily daily observation items: Airpress (humidity), Precipitation (radiation), Sunlight (sunlight), Temperature (temperature) ), Wind (wind speed) (2) Months (monthly): Airpress (air pressure), Humidity (humidity), Rain (precipitation), Sunlight (sunlight), Temperature (temperature), Wind (wind speed) (3) tendays: Airpress, Humidity, Rain, Sunlight, Temperature, Wind (4) years (year by year): Precipitation, Temperature 5. Vectro folder: (1) Admwhole (county boundary map), (2) Lake (lake), (3) Hydrasta (hydrological site), (4) Basin (watershed boundary), (5) Landscape2000 (land use 200 (Year), (6) landscape86 (land use 1986), (7) Meteosta (meteorological station), (8) Lakep (reservoir point), (9) Place (residential point), (10) Rainfallcontour (railway), ( 11) Rainfallcontour (rainfall contour map), (12) Road (highway), (13) Stream (water system map), (14) Town (county name), (15) Township (county township boundary), (16) Vegetation (vegetation map) Data projection information: PROJCS ["Albers", GEOGCS ["GCS_Krasovsky_1940", DATUM ["Not_specified_based_on_Krassowsky_1940_ellipsoid", SPHEROID ["Krasovsky_1940", 6378245.0,298.3]], PRIMEM ["Greenwich", 0.0], UNIT ["Degree", 0.0174532925199433]], PROJECTION ["Albers_Conic_Equal_Area"], PARAMETER ["False_Easting", 0.0], PARAMETER ["False_Northing", 0.0], PARAMETER ["longitude_of_center", 105.0], PARAMETER ["Standard_Parallel_1", 25.0], PARAMETER ["Standard_Parallel_2", 47.0], PARAMETER ["latitude_of_center", 0.0], UNIT ["Meter", 1.0]] For detailed data description, please refer to the data file
LI Xin
")
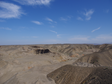
This data set comprises pictures of geological sections and landscape of Nima Basin and Lunpola Basin in the north of Tibetan Plateau which produced on achievement of geological survey in these years. The process of section pictures drawing comprises: measurement of different stratas by hand; identify and description of stratas by experienced geological researcher; picture production with software, based on information collected above. Landscape pictures were drew from satellite maps as base map, then added texts with software. All the pictures are clear, detailed and comprehensive. They are very critical for research on geology, geomorphology of the important localities in the north of Tibetan Plateau, such as Nima Basin and Lunpola Basin, and necessary for paleo-altimetry and uplift of Tibetan Plateau.
")
The data set contains the slope aspect (resolution: 30 m) factor affecting soil erosion on the Loess Plateau and the slope aspect data extracted from the elevation data of the Loess Plateau. Each theme map is divided into frames according to the 1:250000 scale standard map cartography method, and the frames are denoted by the 1:250000 scale standard map cartography number. The geographical coordinate is WGS1984; the accuracy can meet the requirements of regional scale hydrology and soil erosion analysis and forecasting.
LIU Baoyuan, SHI Haijing

The data is clipped from "1: 1 million wetland data of China". "1: 1 million wetland data of China" mainly reflects the national marsh wetland information in the 2000s. It is expressed in geographic coordinates using the decimal degree. The main contents include: marsh wetland types, wetland water supply types, soil types, main vegetation types, geographical area, etc. Implemented the "Standard for Information Classification and Coding of Sustainable Development Information Sharing System of China". Data source of this database: 1:20 swamp map (internal version), Tibetan Plateau 1: 500,000 swamp map (internal version), swamp survey data 1: 1 million and national 1: 4 million swamp map; processing steps are: data source selection, preprocessing, digitization and encoding of marsh wetland elements, data editing processing, establishing topological relationships, edge processing, projection conversion, linking with attribute databases such as place names and obtaining attribute data.
ZHANG Shuqing
")
Two sets of grid data, aster GDEM data with a resolution of 30 meters and SRTM data with a resolution of 90 meters provided by the data management center of Heihe project, as well as point data from multiple sources, are used. By using the HASM scaling algorithm, the grid data of different sources and different precision are fused with the elevation point data to obtain the high precision slope data of Heihe River Basin. First of all, the accuracy of two groups of grid data is verified by using various point data. According to the results of accuracy verification, different grid data are used as the trend surface of data fusion in different regions. The residuals of various point data and trend surface are calculated, and the residual surface is obtained by interpolation with HASM algorithm, and the trend surface and residual surface are superposed to obtain the final slope surface. The spatial resolution is 500 meters.
YUE Tianxiang, ZHAO Na
The dataset contains all individual glacial storage (unit: km3) over the Qinghai-Tibetan Plateau in 1970s and 2000s. It is sourced from the resultant data of the paper entitled "Consolidating the Randolph Glacier Inventory and the Glacier Inventory of China over the Qinghai-Tibetan Plateau and Investigating Glacier Changes Since the mid-20th Century". The first draft of this paper has been completed and is planned to be submitted to Earth System Science Data journal. The baseline glacier inventories in 1970s and 2000s are the Randolph Glacier Inventory 4.0 dataset, and the Glacier Inventory of China, respectively. Based on the individual glacial boundaries extracted from the above-mentioned two datasets, the grid-based bedrock elevation dataset (https://www.ngdc.noaa.gov/mgg/global/global.html, DOI: 10.7289/v5c8276m), and the glacier surface elevation obtained by a slope-dependent method, the individual glacier volumes in 1970s and 2000s are then calculated. In addition, the calculated results of individual glacier volumes in this study have been compared and verified with the existent results of several glacier volumes, relevant remote sensing datasets, and the global glacier thickness dataset based on the average of multiple glacier model outputs (https://www.research-collection.ethz.ch/handle/20.500.11850/315707, doi:10.3929/ethz-b-000315707), and the errors in the calculations have also been quantified. The established dataset in this study is expected to provide the data basis for the future regional water resources estimation and glacier ablation-involved researches. Moreover, the acquisition of the data also provides a new idea for the future glacier storage estimation.
HU Xiaofei, PAN Baotian
")
The section data of the upper reaches of Heihe River mainly show the structure and cross section distribution characteristics of the terrace of Heihe River. These data are mainly obtained through field investigation and measurement. The data include the forest farm section and raft section near Qilian County in the upper reaches of Heihe River, and the Heihekou section in Yingluoxia.
HU Xiaofei, PAN Baotian

The data is clipped from "1: 1 million wetland data of China". "1: 1 million wetland data of China" mainly reflects the national marsh wetland information in the 2000s. It is expressed in geographic coordinates using the decimal degree. The main contents include: marsh wetland types, wetland water supply types, soil types, main vegetation types, geographical area, etc. Implemented the "Standard for Information Classification and Coding of Sustainable Development Information Sharing System of China". Data source of this database: 1:20 swamp map (internal version), Tibetan Plateau 1: 500,000 swamp map (internal version), swamp survey data 1: 1 million and national 1: 4 million swamp map; processing steps are: data source selection, preprocessing, digitization and encoding of marsh wetland elements, data editing processing, establishing topological relationships, edge processing, projection conversion, linking with attribute databases such as place names and obtaining attribute data.
ZHANG Shuqing

Slope data of economic corridors in Silk Road can reflect the degree of steepness of the surface units of the six major economic corridors, the unit is degree (°). The spatial resolution of the data is 0.016 degrees, which is about 1.8km. The longitude range is 12.09°E-180°, and the latitude range is 10.99°S-90°N. The source is derived from the Global Relief Model built by the National Oceanic and Atmospheric Administration of the United States (NOAA). The range is cut by the border of the Silk Road. This data is one of the basic data necessary to assess the risks of natural disasters (including debris flows, landslides, flash floods, etc.) in the six economic corridors. The application frequency will be high and the prospects will be broad.
ZOU Qiang

Chinese Cryospheric Information System is a comprehensive information system for the management and analysis of cryospheric data over China. The establishment of Chinese Cryospheric Information System is to meet the needs of earth system science, and provide parameters and verification data for the development of response and feedback models of permafrost, glacier and snow cover to global changes under GIS framework. On the other hand, the system collates and rescues valuable cryospheric data to provide a scientific, efficient and safe management and analysis tool. Chinese Cryospheric Information System selected three regions with different spatial scales as its main research areas to highlight the research focus. The research area along the Qinghai-Tibet highway is mainly about 700 kilometers long from Xidatan to Naqu, and 20 to 30 kilometers wide on both sides of the highway. The datasets of the Tibetan highway contains the following types of data: 1. Cryosphere data.Including: snow depth distribution. 2. Natural environment and resources.Include: Digital elevation topography (DEM) : elevation elevation, elevation zoning, slope and slope direction; Fundamental geology: Quatgeo 3. Boreholes: drilling data of 200 boreholes along the qinghai-tibet highway. Engineering geological profile (CAD) : lithologic distribution, water content, grain fraction data, etc 4. Model of glacier mass equilibrium distribution along qinghai-tibet highway: prediction of frozen soil grid data. The graphic data along the qinghai-tibet highway includes 13 map scales of 1:250,000.The grid size is 100×100m. For details, please refer to the documents (in Chinese): "Chinese Cryospheric Information System design. Doc", "Chinese Cryospheric Information System data dictionary. Doc", "Database of the Tibetan highway. Doc".
LI Xin
")
The data set analyzes the spatial and temporal distribution, impact and loss of typical global flood disasters from 2018 to 2019. In 2018, there were 109 flood disasters in the world, with a death toll of 1995. The total number of people affected was 12.62 million. The direct economic loss was about 4.5 billion US dollars, which was at a low level in the past 30 years. The number of global flood incidents in 2018 was higher in the first half of the year than in the second half of the year, and the frequency of occurrence was higher from May to July. Therefore, based on three typical disaster events such as the hurricane flood in Florence in the United States in 2018, the flooding of the Niger River in Nigeria in 2018, and the Shouguang flood in Shandong Province in 2018, the disaster background, hazard factors, and disaster situation were analyzed. .
JIANG Zijie, JIANG Weiguo, WU Jianjun, ZHOU Hongmin

The Relief Degree of Land Surface is a comprehensive representation of regional altitude and surface cutting degree. Using the resampled Digital Elevation Model data and the Feng(2007) Model, the Relief Degree of Land Surface dataset of the Green Silk Road in 1km resolution was developed. The dataset includes the spatial distribution data of the Relief Degree of Land Surface, elevation, and flat area at 1km covering the Green Silk Road, as well as each country of the Green Silk Road.
XIAO Chiwei
 in the Kubuqi Desert")
I. Overview This data set contains the terrain data, soil data, meteorological data, land use data, NDVI data, etc. required for the operation of the IWEMS model. All maps and relevant point coordinates (weather stations) use the isometric projection UTM / WGS94 coordinate system. Ⅱ. Data processing description All maps and related point coordinates (weather stations) use the isometric projection UTM / WGS84 coordinate system. Ⅲ. Data content description The data content mainly includes: The basic terrain data includes the Cuneiform Desert (DEM) and the river network. The river network is used as the boundary for wind and sand transmission. The size of the DEM grid is 250 * 250 m. The river network was extracted using the ASTER-GDEM terrain data with the river burning method. Soil data, including soil physics, chemistry, and spatial distribution of soil types. It is derived from 1: 1 million soil database of China and converted to ESRI-grid format with a grid size of 250 * 250 m. Meteorological data, including daily data from Baotou, Dongsheng and Linhe meteorological stations around the Kubuqi Desert, from 2002 to 2010. Includes precipitation, wind speed and wind direction data. Land use data, 2000 land use data, scale is 1: 100,000. Convert it to ESRI-grid format with a grid size of 250 * 250 m. Ⅳ. Data usage description Evaluate wind and sand hazards along the Yellow River, estimate the amount of wind and sand entering the upper reaches of the Yellow River, and provide data support for establishing an early warning system for wind and sand hazards in the region.
XUE Xian, DU Heqiang
")
This data set contains the digital slope aspect distribution and slope aspect degree data of the Tibetan Plateau, which can be used to assist in basic geographic information analysis and research work on the Tibetan Plateau region. The raw data were the Shuttle Radar Topography Mission (SRTM) data provided by Global Land Cover Network (GLCN) using the WGS84 coordinate system, and the raw data were framing data, including latitude and longitude data, with a spatial resolution of 3″. After the mosaic processing, the Nodata (null data) generated in the mosaic process were interpolated and filled, and after filling, a projection conversion process was performed to generate an equal-area conical projection of the data bit Albers, after conversion projection, the spatial resolution was 90 m. Finally, the boundary of the Tibetan Plateau was used for cutting to obtain DEM data. Use the spatial analysis module under ArcMap to calculate the slope aspect and generate the slope aspect map. Pixel data: value Data type: floating point Interpretation: slope degree Dimension: degree Data accuracy: spatial resolution 90 m
GLCN
")
"Digital data including slope and aspect (slope and aspect) data are the basic data of GIS, and can be used as two important indicators to describe the terrain feature information, which can not only indirectly express the relief shape and structure of the terrain, It includes hydrological model, landslide monitoring and analysis, surface material movement, soil erosion, land use planning, etc The basic data of geoscience analysis model. At present, slope and aspect data are generally calculated by certain calculation model on digital elevation model (DEM). This data takes 34 key nodes of Pan third pole as the research area, takes DEM data with resolution of 30 meters as the base, realizes the digital simulation of slope and aspect in terrain data (that is, the digital expression of slope and aspect in terrain surface data), and finally obtains the slope and aspect data of pan third pole key nodes. The data area is 34 key nodes of Pan third pole (Abbas, Astana, Colombo, Gwadar, Mengba, Teheran, Vientiane, etc.).
SHANG Cheng
")
The slope dataset of the Green Silk Road, which represent the tilts of the land surface units, is a quantitative description for land surface steepness. This dataset calculated from GMTED2010 (Multi-resolution Terrain Elevation Data 2010) which product by USGS (United States Geological Survey). First, the DEM (Digital Elevation Model) of Green Silk Road are obtained by the preprocessing including projection, clipping for the GMTED2010. Second, the slopes are calculated by using the degree method in ArcGIS software to generate the slope dataset of the green Silk Road. This dataset is of good quality and can accurately reflect the land surface tilt of the Green Silk Road areas. It can be used in the fields of Surveying and mapping, remote sensing, environmental resources, agricultural and forestry land planning, urban planning, disaster monitoring, hydropower engineering, military and other resources, environment and social economy.
Xiaohuan Yang
Contact Support
Links
National Tibetan Plateau Data CenterFollow Us

A Big Earth Data Platform for Three Poles © 2018-2020 No.05000491 | All Rights Reserved
|  No.11010502040845
Tech Support: westdc.cn

