
Brief Introduction:The Arctic region is one of the regions most sensitive to climate change and has long received great attention from climate change research. Despite the recent signs of slowing or even stagnation in global warming, climate change in the Arctic has accelerated markedly over the past few decades: on the one hand, sea ice cover in the Arctic summer and autumn is accelerating melting ( As shown in Figure 1), the historical low value of the Arctic sea ice cover area is constantly refreshed. The sea ice cover area in September 2012 is only equivalent to 51% of the average sea ice area from 1979 to 2000, compared to the early 1980s. More than half of the sea ice has disappeared in the summer. The rate of sea ice reduction in 2002-2011 was twice as fast as it was between 1979 and 2006...
Publish Datetime:2018-10-25
Number of Datasets:71

Based on the Global 1,000,000 Basic Geographic Data (2010) of the Resource and Environment Science Data Center of the Chinese Academy of Sciences, the railway and highway networks of Arctic countries (USA, Canada, Russia, Norway (including Greenland and the Faroe Islands), Denmark, Sweden, Finland, and Iceland) are extracted via ArcGIS. The data are stored separately by nation. The data format is the .shp format of ArcGIS, and the projection mode is GCS_WGS_1984. The railway network data are from http://www.resdc.cn/data.aspx?DATAID=208, and the highway network data are from http://www.resdc.cn/data.aspx?DATAID=207
2020-04-28 View Details

Arctic administrative boundary data sets include Arctic_National, Arctic_Provincial, and Arctic_Prefecture vector spatial data sets of arcti-bound countries and Its corresponding name, TYPE related attribute data :(LOCAL_NAME), (ENG_NAME), (CNTRY_NAME), (TYPE), (CNTRY_CODE), (CONTINENT) The data comes from the 1:1,000,000 ADC_WorldMap global data set, which is a comprehensive, up-to-date and seamless geographic digital data. The world map coordinate system is latitude and longitude, WGS84 datum surface, and the arctic data set is the special projection parameter for the arctic (North_Pole_Stereographic).
2020-04-28 View Details
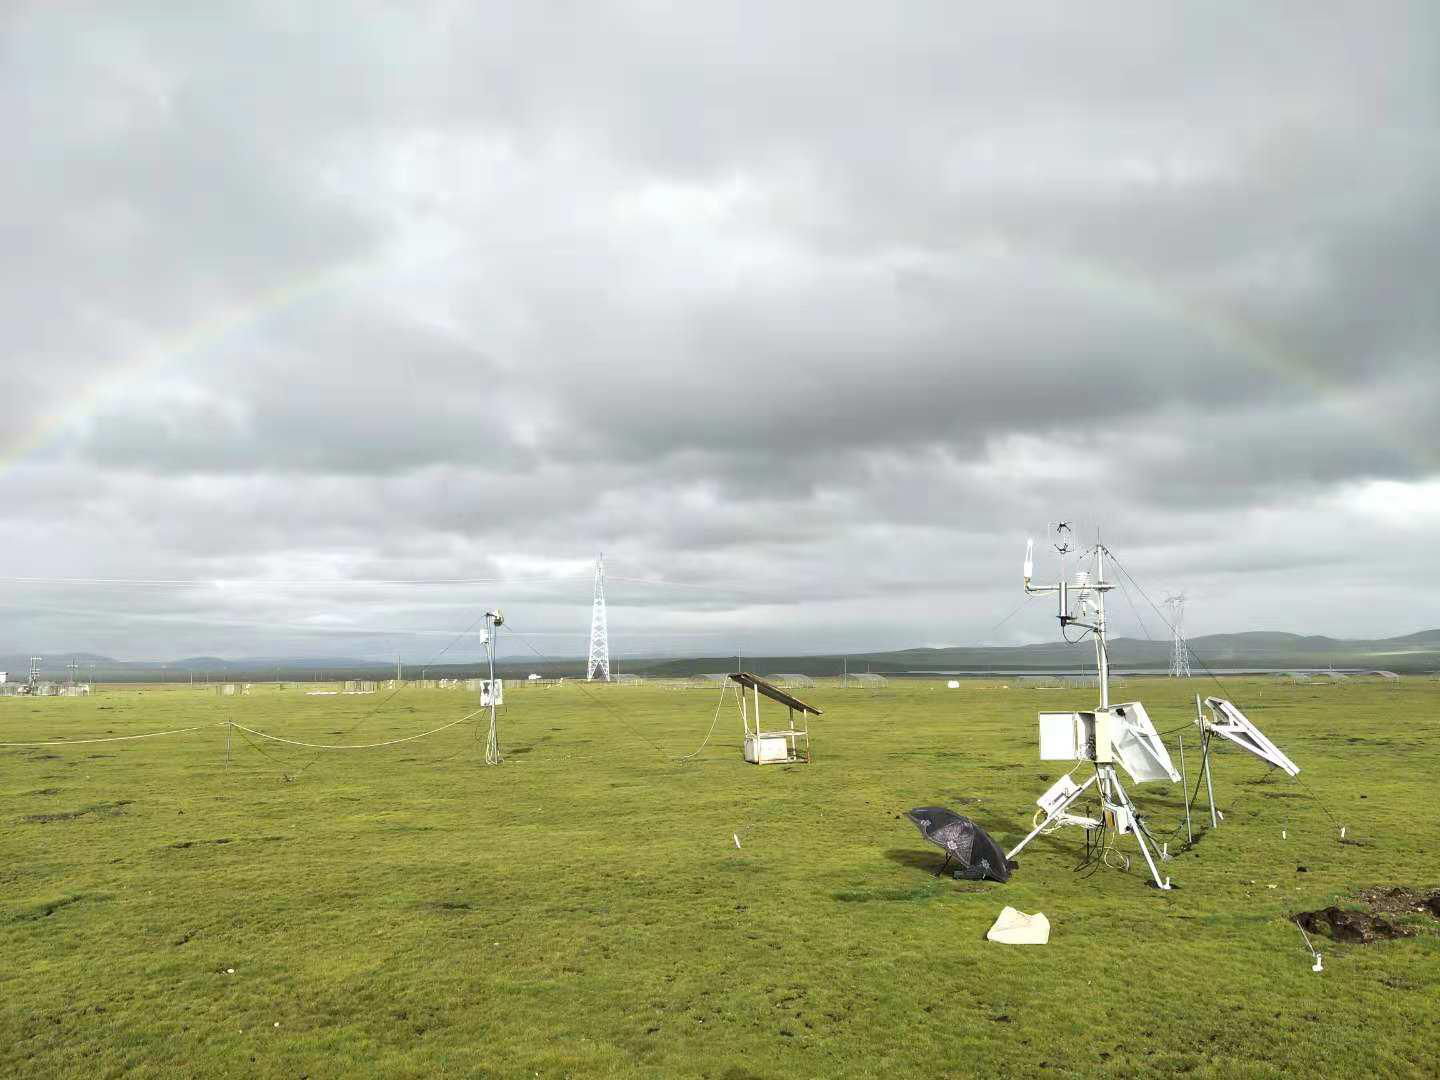
The dataset is a 30-minute eddy covariance flux observation data from nine flux stations in the Three Poles, including the data of ecosystem Net Carbon Exchange (NEE), Gross Primary Productivity(GPP), and Ecosystem Respiration (ER) . The time coverage of the data is from 2000 to 2016. The main steps of data pre-processing include outlier removal (±3σ), coordinate axis rotation(three-dimensional wind rotation), Webb-Pearman-Leuning correction, outlier elimination, carbon flux interpolation and decomposition. And missing data is interpolated by the nonlinear empirical formula between CO2 flux value(Fc) and environmental factors.
2020-01-19 View Details
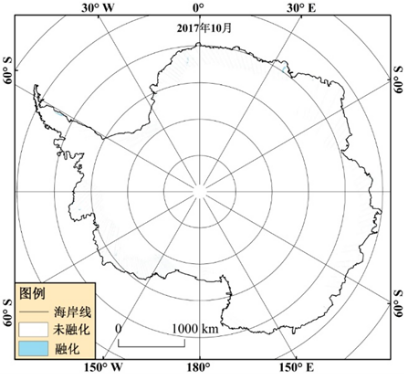
At present, based on the proposed SAR ice sheet freeze-thaw detection algorithm using change detection and decision tree algorithm, the monthly average ice sheet freeze-thaw is detected using sentinel-1 EW SAR data. At the same time, using the developed production module of freeze-thaw products based on big data platform, the international first production of Antarctic ice sheet and Greenland ice sheet freeze-thaw products. Through the development of automatic weather station temperature data, the ice sheet freeze-thaw detection accuracy reaches 90%. At present, the acquisition time of data products is mainly the summer of the north and south poles, among which the Antarctic ice sheet products are January, February, March, October, November, December and Greenland products are may, June, July, August, September and October.
2020-01-19 View Details
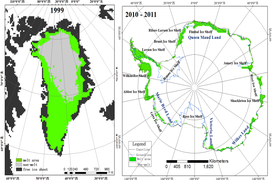
The coverage time of microwave radiometer ice sheet freeze-thaw data set is updated to 2016-2019, with a spatial resolution of 25 km; the remote sensing inversion method based on microwave radiometer adopts the improved wavelet based ice sheet freeze-thaw detection algorithm, which takes into account the change of ice sheet freeze-thaw brightness temperature characteristics in time. First, the long-time brightness temperature data of all ice sheet areas in Greenland is small by using wavelet transform. The multi-scale decomposition of wave is used to analyze the edge information at different scales. Thirdly, the edge information of ice sheet melting and refreezing is separated from the noise by ANOVA. Based on the extracted edge information of long-term brightness and temperature change of ice sheet, the optimal edge threshold of dry snow and wet snow classification is determined by using the generalized Gaussian model, so as to detect the melting area of Greenland ice sheet. Finally, based on the principle of space automatic error correction, the error results caused by noise are detected by using the space neighborhood error correction operator, and the error is corrected manually. The brightness and temperature data of passive microwave in long time series come from SMMR, SSM / I and SSMI / s sensors. To ensure simultaneous interpreting of the brightness temperature of different sensors, simultaneous interpreting of different sensor brightness temperatures is made before freezing and thawing. Through the verification of the actual measurement site, it shows that the detection accuracy of Greenland ice sheet freeze-thaw is more than 70%.
2020-01-19 View Details
The microwave radiometer data set comprises brightness temperature data from SMMR (1978-1987), SSM/I (1987-2009) and SSMIS (2009-2015), with temporal coverage from 1978 to 2015 and a spatial resolution of 25 km. Each Antarctic data file consists of 316*332 grids, and each Arctic freeze-thaw data file consists of 304*448 grids. The microwave scatterometer data set comprises backscattering data from QScat (2000-2009) and ASCAT (2009-2015), with a temporal coverage from 2000 to 2015 and a spatial resolution of 4.45 km. Each Antarctic data file consists of 1940*1940 grids, and each Arctic data file consists of 810*680 grids. The temporal resolution of the data set is one day, and the data cover both Antarctica and Arctic ice sheets.
2020-01-19 View Details
Because of its unique natural conditions and geographical location, the Arctic region plays a very important role in global change. Polar sea ice, as an important influencing factor of climate change, is a sensitive instrument of global climate change. The Yellow River Station, one of China's research stations in the Arctic, focuses on supporting the three scientific fields of global change and its regional response, the polar space environment and space climate, and the life characteristics and processes in the polar environment, providing an important platform for China's in-depth scientific research activities in the Arctic. Therefore, the product data set of data validation for key areas of Arctic sea ice in recent years is constructed to monitor the key areas of Arctic sea ice.
2020-01-19 View Details
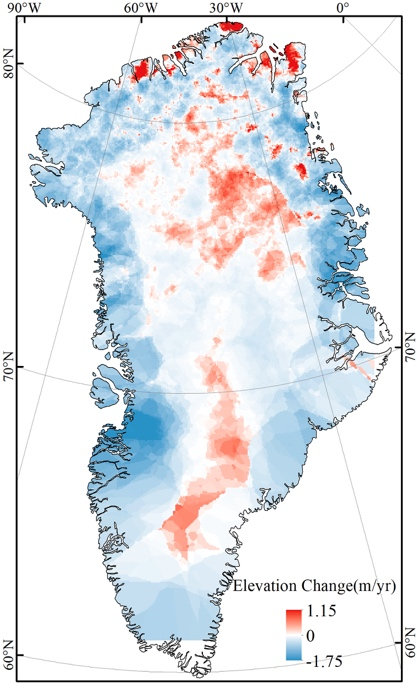
First of all, the data of ice cover elevation change is obtained by using the data of glas12 in 2004 and 2008. In ideal case, each track is strictly repeated. However, due to the track deviation, it can not be guaranteed that the track is strictly repeated according to the design. The deviation varies from several meters to several hundred meters. The grid of 500m * 500m is taken, and the point falling in the same grid is considered as the weight of the repeated track. The elevation change in 2004-2008 is obtained by subtraction of complex points, and the annual elevation change is obtained. Ice sheet elevation change data
2020-01-18 View Details
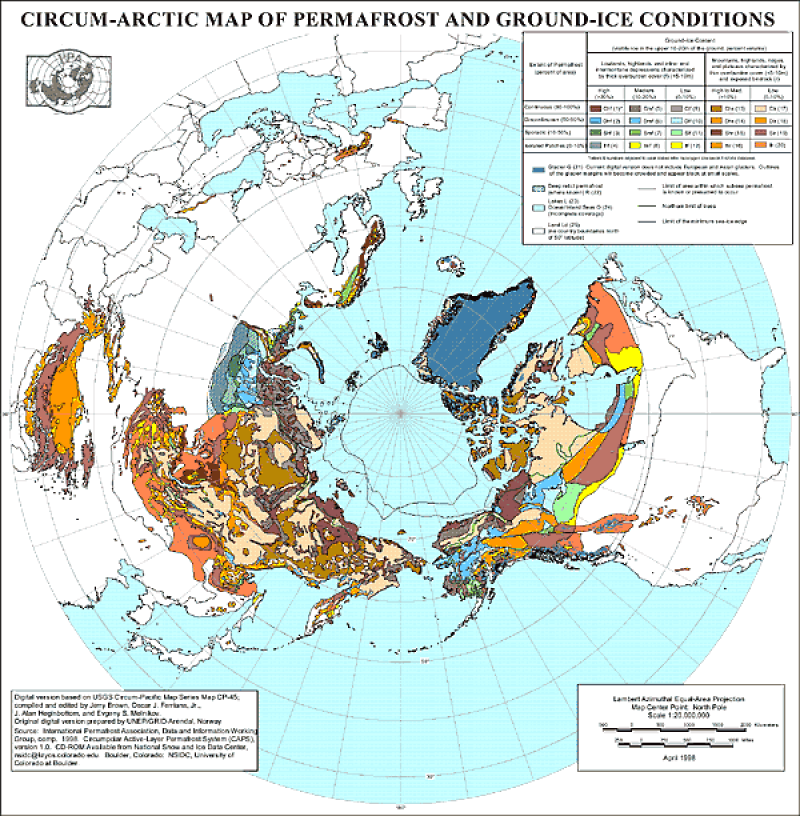
The data set includes 1. permaice (map of frozen soil types), 2. subsea (subsea boundary vectorgraph), 3. treeline (timberline vectorgraph), 4. nhipa (grid map) and 5. llipa (grid map). Permaice includes the following attribute fields: Num_code (frozen soil attribute code), Combo (frozen soil attribute), extent (frozen soil coverage) and content (ice content). The attribute comparison is as follows. (1) Frozen soil attribute comparison table: 0 (No information) 1 - chf (Continuous permafrost extent with high ground ice content and thick overburden) 2 - dhf (Discontinuous permafrost extent with high ground ice content and thick overburden) 3 - shf (Sporadic permafrost extent with high ground ice content and thick overburden) 4 - ihf (Isolated patches of permafrost extent with high ground ice content and thick overburden) 5 - cmf (Continuous permafrost extent with medium ground ice content and thick overburden) 6 - dmf (Discontinuous permafrost extent with medium ground ice content and thick overburden) 7 - smf (Sporadic permafrost extent with medium ground ice content and thick overburden) 8 - imf (Isolated patches of permafrost extent with medium ground ice content and thick overburden) 9 - clf (Continuous permafrost extent with low ground ice content and thick overburden) 10 - dlf (Discontinuous permafrost extent with low ground ice content and thick overburden) 11 - slf (Sporadic permafrost extent with low ground ice content and thick overburden) 12 - ilf (Isolated patches of permafrost extent with low ground ice content and thick overburden) 13 - chr (Continuous permafrost extent with high ground ice content and thin overburden and exposed bedrock) 14 - dhr (Discontinuous permafrost extent with high ground ice content and thin overburden and exposed bedrock) 15 - shr (Sporadic permafrost extent with high ground ice content and thin overburden and exposed bedrock) 16 - ihr (Isolated patches of permafrost extent with high ground ice content and thin overburden and exposed bedrock) 17 - clr (Continuous permafrost extent with low ground ice content and thin overburden and exposed bedrock) 18 - dlr (Discontinuous permafrost extent with low ground ice content and thin overburden and exposed bedrock) 19 - slr (Sporadic permafrost extent with low ground ice content and thin overburden and exposed bedrock) 20 - ilr (Isolated patches of permafrost extent with low ground ice content and thin overburden and exposed bedrock) 21 - g (Glaciers) 22 - r (Relict permafrost) 23 - l (Inland lakes) 24 - o (Ocean/inland seas) 25 - ld (Land) (2)The frozen soil coverage attribute comparison table c = continuous (90-100%) d = discontinuous (50-90%) s = sporadic (10-50%) i = isolated patches (0-10%) (3)The ice content comparison table h = high (>20% for "f" landform codes) (>10% for "r" landform codes) m = medium (10-20%) l = low (0-10%) ------------------------------------------------------------ Projection of the shapefiles is: PROJCS["Sphere_ARC_INFO_Lambert_Azimuthal_Equal_Area", GEOGCS["GCS_Sphere_ARC_INFO", DATUM["Sphere_ARC_INFO", SPHEROID["Sphere_ARC_INFO",6370997.0,0.0]], PRIMEM["Greenwich",0.0], UNIT["Degree",0.0174532925199433]], PROJECTION["Lambert_Azimuthal_Equal_Area"], PARAMETER["False_Easting",0.0], PARAMETER["False_Northing",0.0], PARAMETER["longitude_of_center",180.0], PARAMETER["latitude_of_center",90.0], UNIT["Meter",1.0]] Projection for the raster (*.byte) files is: Projection: Lambert Azimuthal Units: meters Spheroid: defined Major Axis: 6371228.00000 Minor Axis: 6371228.000 Parameters: radius of the sphere of reference: 6371228.00000 longitude of center of projection: 0 latitude of center of projection: 90 false easting (meters): 0.00000 false northing (meters): 0.00000
2020-01-16 View Details

1) This data is the reconstructed autumn sea ice from 1289 to 1993 in Barents Kara Sea, Arctic ; 2) Based on multiple statistical methods modeling, this sea ice time series is reconstructed by the ice core and tree ring proxy record; 3) This long term sea ice series is annual resolution and have a high reliability; 4) This data can help us know the historical changes of Arctic sea ice and its response and impact on climate change. The Barents Sea Kara Sea area is the key sea area where the extreme cold air flows southward in winter and spring in China. However, the lack of observation data limits our understanding of its mechanism. It is very important to reconstruct the characteristics of long-term Arctic sea ice change to study the Arctic sea ice change in the global context and its impact on China's historical climate.
2020-01-16 View Details
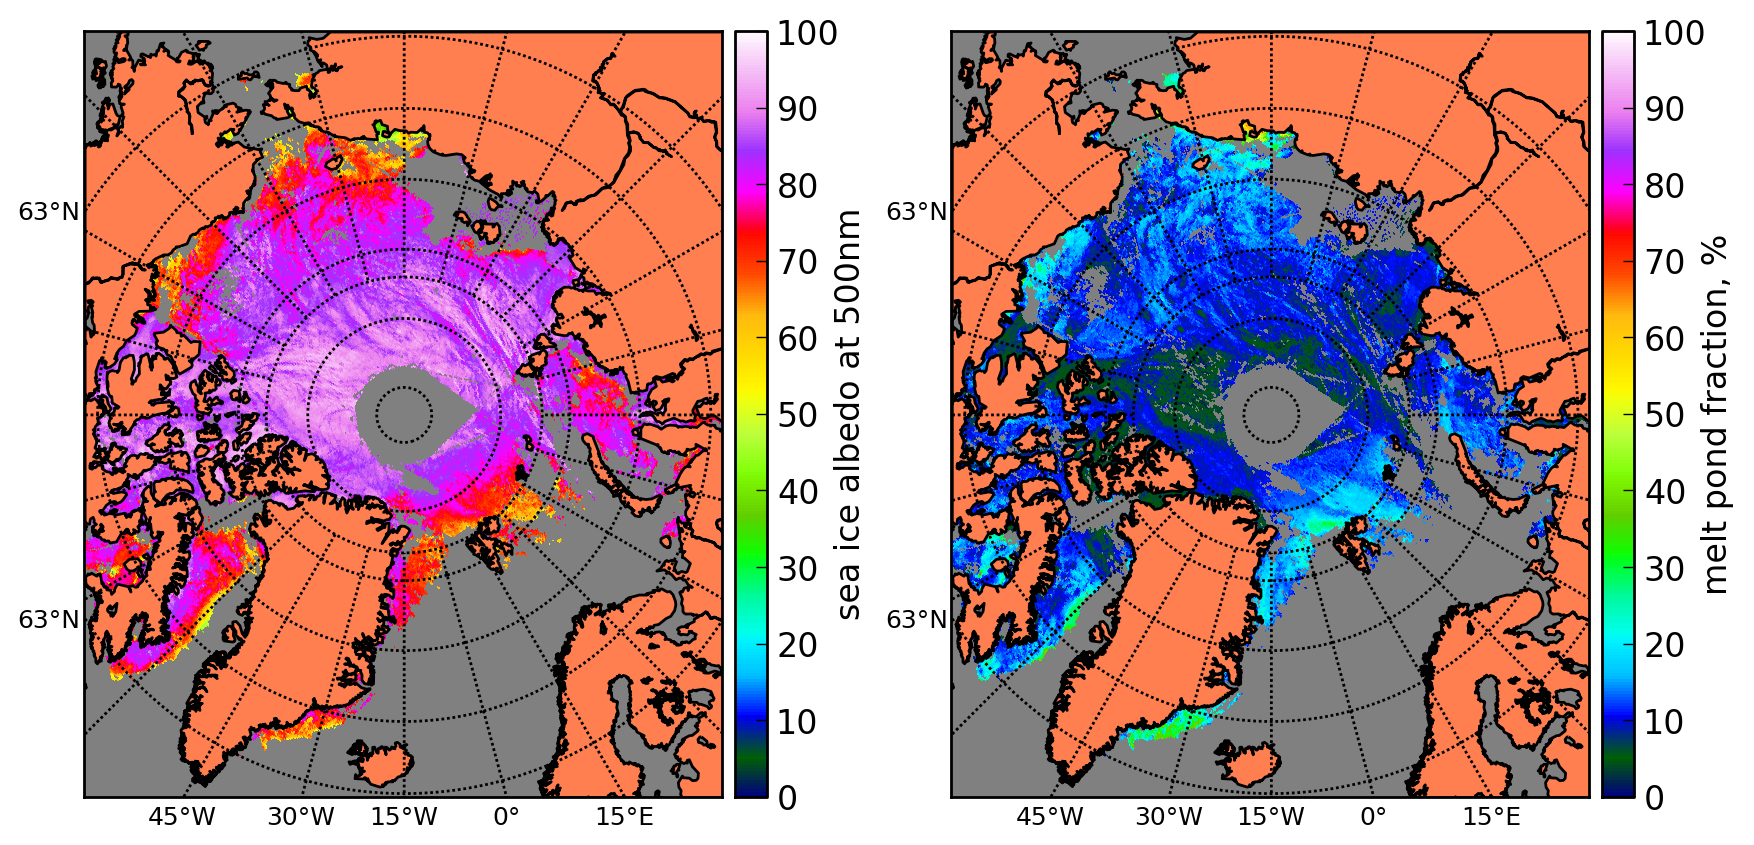
Sea ice is the ice formed by the freezing of sea water on the sea surface, and the re freezing of precipitation on the sea ice surface also becomes a part of sea ice. Sea ice changes not only affect the stratification, stability and convection of the ocean, but also affect the large-scale temperature and salt environment. In addition, due to the high albedo and insulation of sea ice, it can change the radiation state of the polar surface and affect the energy and material exchange between air and sea. The change of sea ice not only affects the local marine ecological environment and the local atmospheric environment, but also affects the weather and climate of other regions in the way of remote correlation through complex feedback process. Through the evaluation, this data set presents four parameters related to polar sea ice: sea ice density, range, thickness and albedo. To provide a basis for the study of polar and global climate change.
2020-01-12 View Details
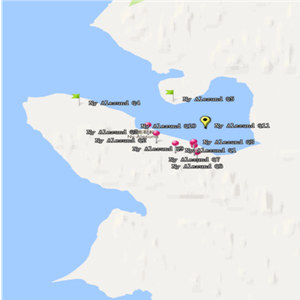
Svalbard, Spitsbergen. The archipelago in the Arctic region is the territory of the northernmost border of Norway. It is located in the north of the European continent, between the Norwegian continent and the Arctic point. Vegetation is mainly lichens and bryophytes, the only trees are small polar willow and birch. The vegetation spectrum data set collected in this area is mainly based on the pioneer plant survey of 283 sample points in the new Olson area of Svalbard Islands in the Arctic. The survey time is July 6-22, 2018. The collection place includes London Island, the Yellow River Station area and the front of glaciers, which provides background information for the study of plant distribution and change in the Arctic tundra area.
2020-01-12 View Details
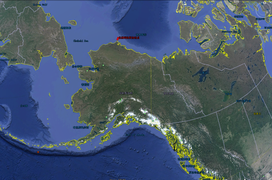
The aerosol optical thickness data of the Arctic Alaska station is based on the observation data products of the atmospheric radiation observation plan of the U.S. Department of energy at the Arctic Alaska station. The data coverage time is updated from 2016 to 2019, with the time resolution of hour by hour. The coverage site is the northern Alaska station, with the longitude and latitude coordinates of (71 ° 19 ′ 22.8 ″ n, 156 ° 36 ′ 32.4 ″ w). The source of the observed data is retrieved from the radiation data observed by mfrsr instrument. The characteristic variable is aerosol optical thickness, and the error range of the observed inversion is about 15%. The data format is NC format.
2020-01-12 View Details
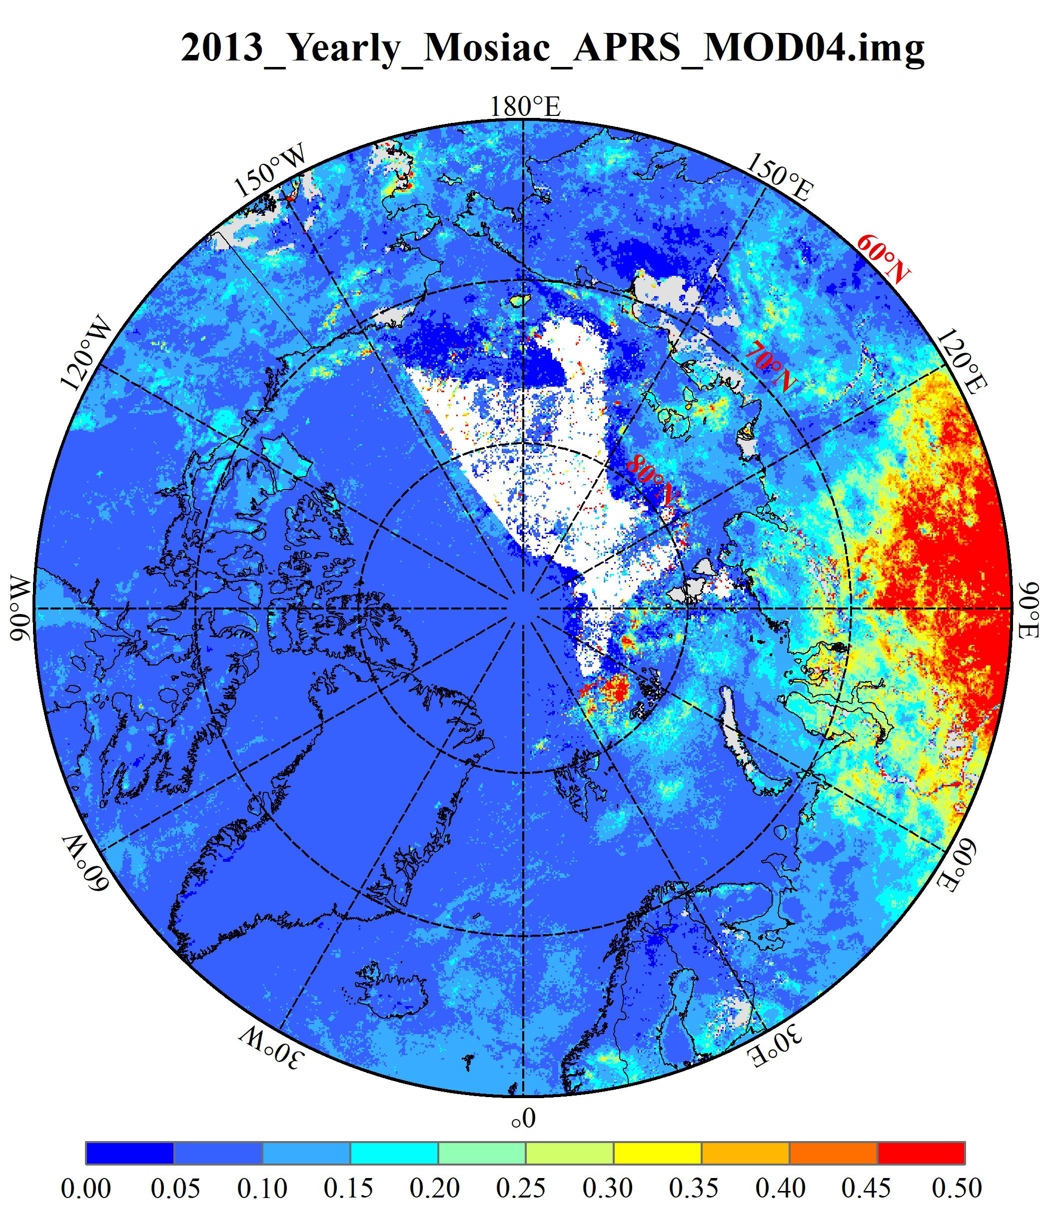
The "poles AOD Collection 1.0" aerosol optical thickness (AOD) data set adopts the self-developed visible band remote sensing inversion method, combined with the merra-2 model data and the official NASA product mod04. The data covers from 2000 to 2019, with the time resolution of day by day, covering the "three poles" (Antarctic, Arctic and Qinghai Tibet Plateau) area, and the spatial resolution of 0.1. Degree. The inversion method mainly uses the self-developed APRs algorithm to invert the aerosol optical thickness over ice and snow. The algorithm considers the BRDF characteristics of ice and snow surface, and is suitable for the inversion of aerosol optical thickness over ice and snow. The experimental results show that the relative deviation of the data is less than 35%, which can effectively improve the coverage and accuracy of the aerosol optical thickness in the polar region.
2020-01-12 View Details
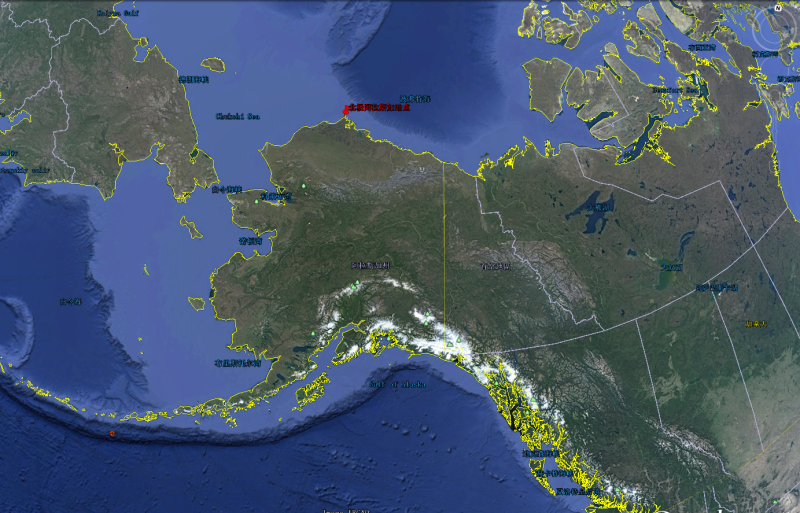
The aerosol optical thickness data of the Arctic Alaska station is based on the observation data products of the atmospheric radiation observation plan of the U.S. Department of energy at the Arctic Alaska station. The data coverage time is from 1998 to 2016, and the time resolution is hour by hour. The coverage site is the Arctic Alaska station, with the longitude and latitude coordinates of (71 ° 19 ′ 22.8 ″ n, 156 ° 36 ′ 32.4 ″ w). The source of the observed data is retrieved from the radiation data observed by mfrsr instrument. The optical characteristic variable is aerosol optical thickness, and the error range of the observed inversion is about 15%. The data format is NC format.
2020-01-12 View Details
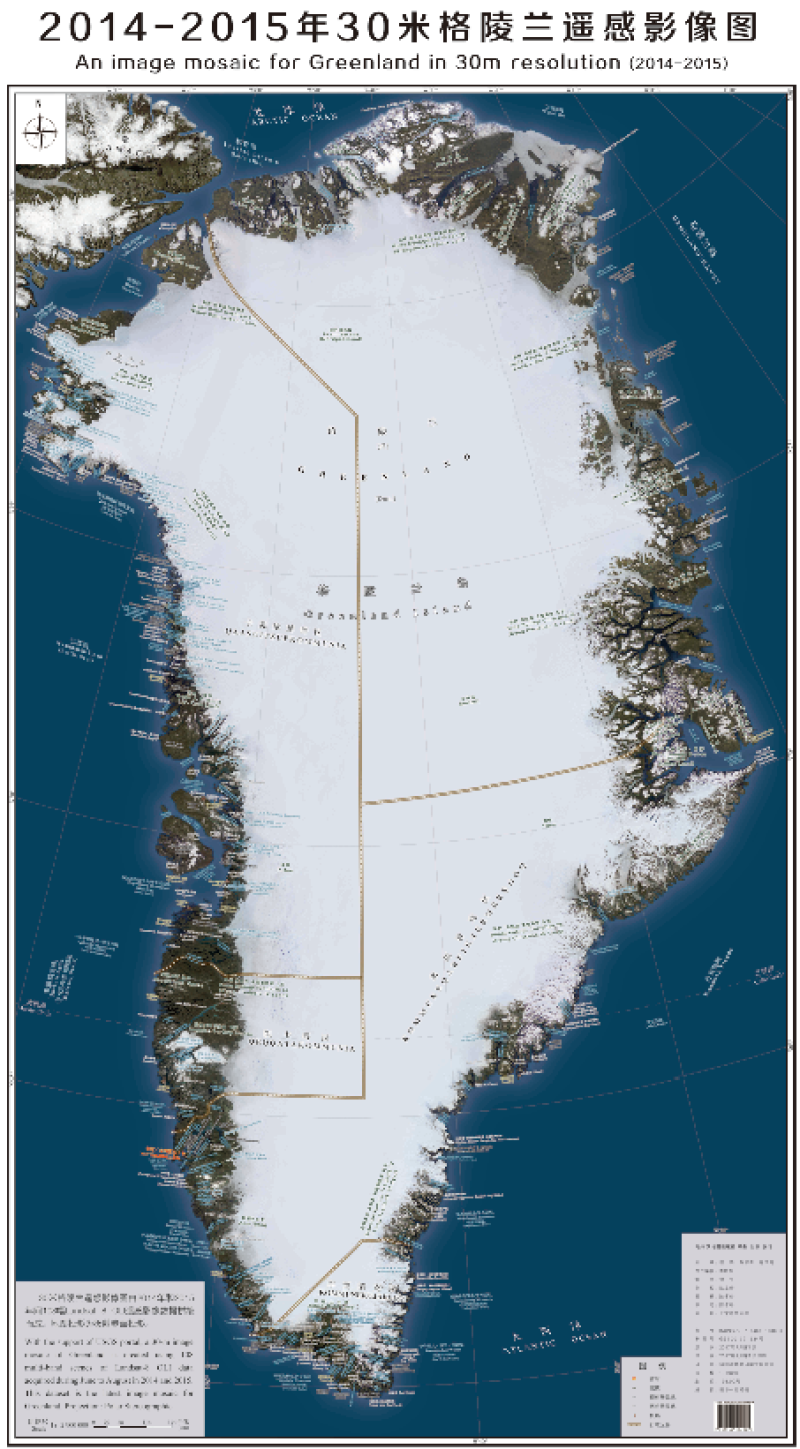
A remote sensing image mosaic was generated for Greenland by processing a collection of 108 scenes of Landsat 8 OLI remote sensing images from 2014 to 2015 with DN correction, cloud removal correction, planetary reflectance correction, reflectance and RGB value conversion, image synthesis and merging, etc. The spatial resolution of the entire image is 30 m, and the stereographic projection method is adopted.
2019-12-05 View Details
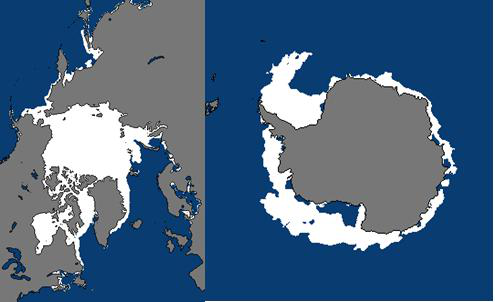
The original data of the Arctic and Antarctic sea ice data set is generated by the National Snow and Ice Data Center (NSIDC) through remote sensing data. The data format is GeoTIFF format and image format. The spatial resolution of the data is 25km and the time resolution is day. The data content is the sea ice range and sea ice density of the north and south poles. In this study, NetCDF format products are generated by post-processing the extent and density of sea ice in the north and south poles. The product data includes the sea ice range and sea ice density data of the north and south poles from 1979 to 2019. The time resolution is day by day, the coverage range is the South Pole and the north pole, and the horizontal spatial resolution is 12.5km. The data value of 1 in the sea ice range matrix indicates that the grid is sea ice, and the sea ice density is expressed by 0-1000. The grid value divided by 10 is the sea ice density value of the grid.
2019-11-17 View Details
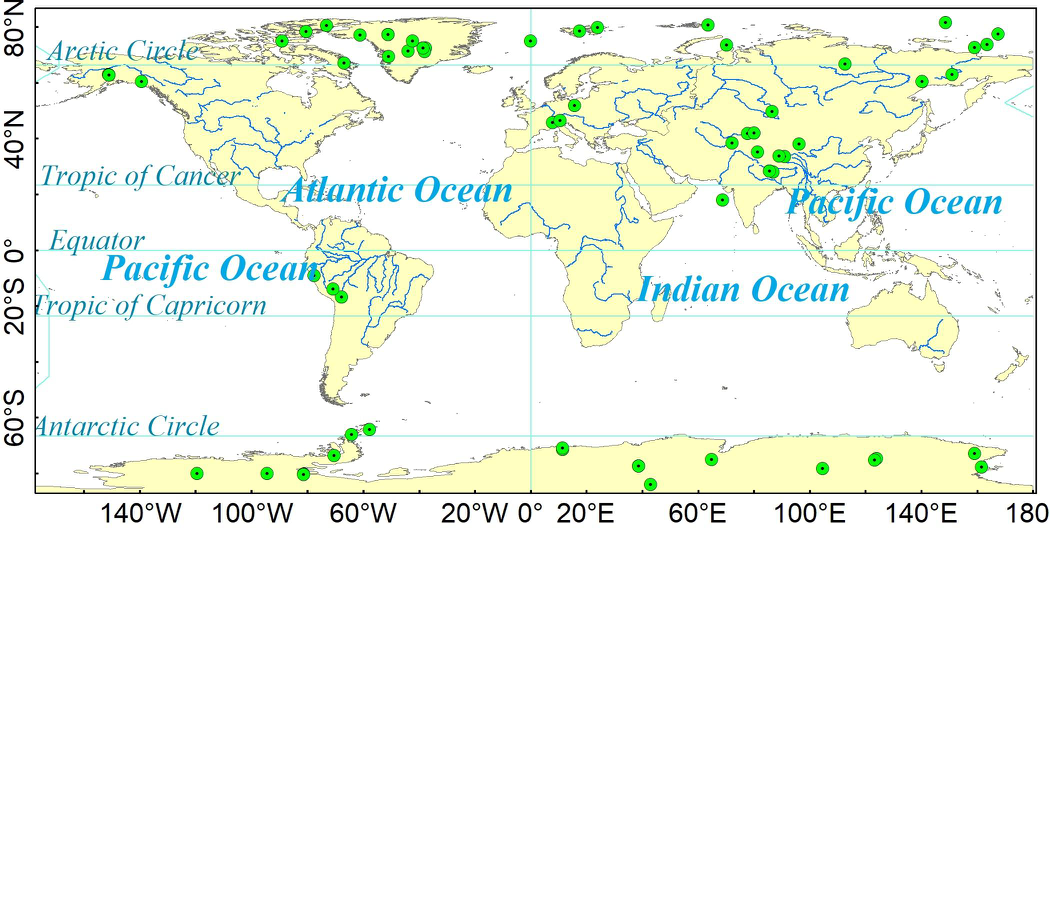
The data of triode ice core mainly comes from NOAA (National Oceanic and Atmospheric Administration, https://www.ncdc.noaa.gov/data-access/paleoclimatology-data/datasets/ice-core). The original data is mainly in text format, which is provided by relevant units and researchers voluntarily. The data mainly includes the original observation data such as oxygen isotope, greenhouse gas concentration, ice core age, etc., as well as the historical temperature, carbon dioxide concentration and methane concentration produced by the researchers according to the observation data. The data are mainly divided into Antarctic, Arctic, Greenland and the third polar region. The database includes drilling address, time, derivative products, corresponding observation site data, references and other elements. Derivative products include product name, type, time and other elements. The space location is divided into the south pole, the north pole and the third pole, including Alaska, Canada, Russia, Greenland and other regions. After sorting and post-processing the collected data, the ice core database is established by using the access database management system of Microsoft office. According to the Antarctic, Arctic, Greenland and the third pole, it is divided into four sub databases. The first table in each database is readme, which contains information and references of each data table.
2019-11-17 View Details
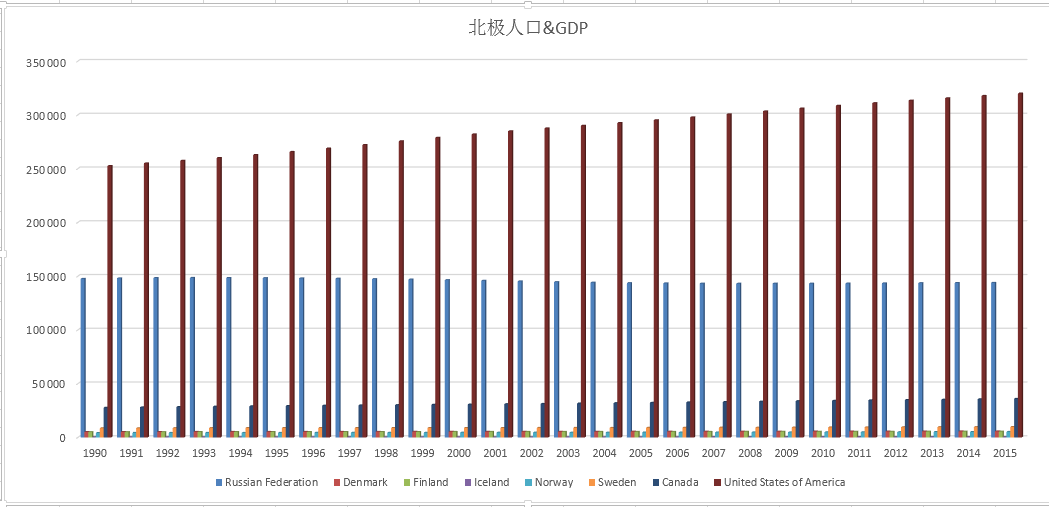
The data set includes: population and GDP data of the arctic (1990-2015) and county-level population and GDP data of the third pole region (gansu, qinghai and Tibet) (1970-2016). Socio-economic statistical attributes include: population (ten thousand), GDP (ten thousand yuan), total industrial and agricultural output (ten thousand yuan), total agricultural output (ten thousand yuan), and total industrial output (ten thousand yuan). The arctic population data are mainly derived from the world populationProspects: 2017 revision by the Department of economic and social affairs, which divides the total population by region and country. The data of the third pole mainly refer to the statistical yearbook of gansu province, qinghai province and Tibet autonomous region.County records of gansu, qinghai and Tibet autonomous regions.
2019-09-29 View Details

The Greenland Ice Sheet Project Two (GISP2), initiated by the United States, has provided detailed oxygen isotope data for a time span of more than 100,000 years, covering almost the entire glacial-interglacial cycle. These data include the oxygen isotope changes from 818 to 1987, with a clear record showing that the Little Ice Age was the coldest period of the past 1000 years. Fluctuating warming occurred from 1850 to 1987, and the changes were consistent with those of GRIP, NGRIP and the latest NEEM ice core obtained in Greenland. This finding indicated that the snow and ice records from the Greenland ice sheet were highly consistent. The physical meaning of each variable is as follows: First column: ice core depth; second column: oxygen isotope value; third column: time
2019-09-15 View Details
Contact Support
Links
National Tibetan Plateau Data CenterFollow Us

A Big Earth Data Platform for Three Poles © 2018-2020 No.05000491 | All Rights Reserved
|  No.11010502040845
Tech Support: westdc.cn