
Brief Introduction:The Arctic region is one of the regions most sensitive to climate change and has long received great attention from climate change research. Despite the recent signs of slowing or even stagnation in global warming, climate change in the Arctic has accelerated markedly over the past few decades: on the one hand, sea ice cover in the Arctic summer and autumn is accelerating melting ( As shown in Figure 1), the historical low value of the Arctic sea ice cover area is constantly refreshed. The sea ice cover area in September 2012 is only equivalent to 51% of the average sea ice area from 1979 to 2000, compared to the early 1980s. More than half of the sea ice has disappeared in the summer. The rate of sea ice reduction in 2002-2011 was twice as fast as it was between 1979 and 2006...
Publish Datetime:2018-10-25
Number of Datasets:71
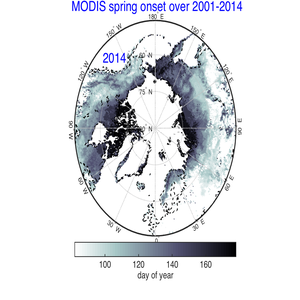
This dataset is based on the sixth edition of the MODIS normalized difference vegetation index product (2001-2014) jointly released by NASA EOSDIS LP DAAC and the US Geological Survey USGS EROS. The NDVI has a time resolution of 16 days and a spatial resolution of 0.05 degree. First,the NDVI data products were re-sampled from the spatial resolution of 0.05 degree to 0.5 degree, then the time series of every year was smoothed by the double-logistic method, and the smoothed curvature was calculated. The maximum curvature of spring was selected as the returning green stage of the vegetation in Spring. This data can be used to analyze the temporal and spatial characteristics of the Holarctic vegetation phenology in Spring.
2020-09-30 View Details
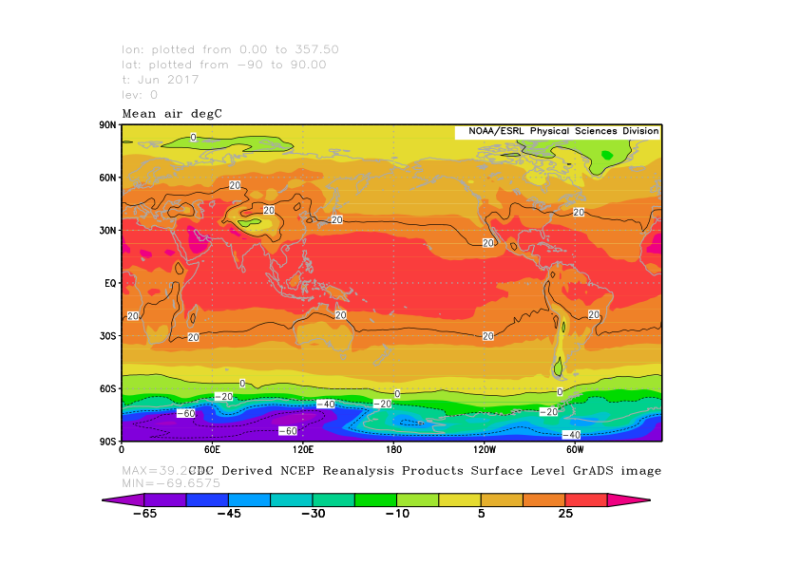
1) The data set is composed of global atmospheric reanalysis data jointly produced by the National Centers for Environmental Prediction (NCEP) and the National Center for Atmospheric Research (NCAR). These grid data are generated by reanalysing the global meteorological data from 1948 to present by applying observation data, forecasting models and assimilation systems. The data variables include surface, near-surface (.995 sigma layer) and multiple meteorological variables in different barospheres, such as precipitation, temperature, relative humidity, sea level pressure, geopotential height, wind field, heat flux, etc. 2) The coverage time is from 1948 to 2018, and the data from 1948 to 1957 are non-Gaussian grid data. The data cover the whole world. The spatial resolution is a 2.5° latitude by 2.5° longitude grid. The vertical resolution is a 17-layer standard pressure barosphere, with layer boundaries at 1000, 925, 850, 700, 600, 500, 400, 300, 250, 200, 150, 100, 70, 50, 30, 20, and 10 hPa, and 28 sigma levels. Some variables are calculated for 8 layers (omega) or 12 layers (humidity), with temporal resolutions of 6 hours, daily, monthly or a long-term monthly average (from 1981 to 2010). The daily data are obtained by averaging the daily values of 0Z, 6Z, 12Z and 18Z. 3) Missing values are assigned a value of -9.99691e+36f. The data are stored in the .nc format with the file name var.time.stat.nc, and each file includes data on latitude, longitude, time, and atmospheric variables. For detailed data specifications, please visit http://www.esrl.noaa.gov/pad/data.
2020-09-14 View Details
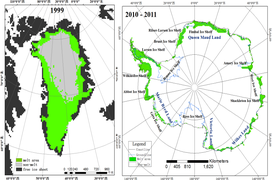
The coverage time of microwave scatterometer ice sheet freeze-thaw data is updated to 2015-2019, with a spatial resolution of 4.45km. The time resolution is day by day, and the coverage range is the polar ice sheet. The remote sensing inversion method based on microwave radiometer considers the change of snow cover characteristics in space-time and space. Firstly, the DVPR time series data of scatterometer data is extracted, the high time resolution of scatterometer data is effectively used, and the influence of terrain is removed by channel difference. Then, the variance value of time series at each sampling point is simulated by generalized Gaussian model, so as to make the region. The generalized Gaussian model needs less input parameters than the traditional double Gaussian model, and the obtained threshold is also unique. Finally, the moving window segmentation algorithm is used to accurately find the melting start time, end time and duration of the wet snow point, which can effectively remove the temperature mutation in the melting or non melting period. The impact. The data of long time series microwave scatterometer are from QSCAT and ASCAT. The verification of the measured stations shows that the detection accuracy of ice sheet freezing and thawing is over 70%. The data is stored in a bin file every day. Each file of Antarctic freeze-thaw data based on microwave scatterometer is composed of 810 * 680 grid, and each file of Greenland ice sheet freeze-thaw data is composed of 810 * 680 grid (0 value: non melting area, 1 Value: melting area).
2020-09-14 View Details
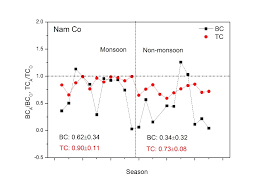
Climate records obtained by most instruments are relatively short in time, which limits the study of climate change, necessitating the use of proxy data to extend records to the past. It was not until the late 1940s that atmospheric data of sufficient quality and spatial resolution were available to determine the main patterns of climate change such as the North American Pacific model and the Pacific Decadal Oscillation. The global ice cores are from the north and south poles and the third pole, and there are also mountain glaciers in Alaska. The ice core data obtained in that area are of great significance for revealing the climate in North America and climate change in the Arctic regions at both low and high latitudes. The physical meaning of each variable: First column: time; second column: accumulation rate data; third column: oxygen isotope data value
2020-08-13 View Details
This dataset contains the flux measurements from the Subalpine shrub eddy covariance system (EC) belonging to the Qinghai Lake basin integrated observatory network from April 28 to December 31 in 2019. The site (100°6'3.62"E, 37°31'15.67" N ) was located near Dasi, Shaliuhe Town, Gangcha County, Qinghai Province. The elevation is 3495m. The EC was installed at a height of 2.5m, and the sampling rate was 10 Hz. The sonic anemometer faced north, and the separation distance between the sonic anemometer and the CO2/H2O gas analyzer (Gill&Li7500A) was about 0.17 m. The raw data acquired at 10 Hz were processed using the Eddypro post-processing software, including the spike detection, lag correction of H2O/CO2 relative to the vertical wind component, sonic virtual temperature correction, coordinate rotation (2-D rotation), corrections for density fluctuation (Webb-Pearman-Leuning correction), and frequency response correction. The EC data were subsequently averaged over 30 min periods. The observation data quality was divided into three classes according to the quality assessment method of stationarity (Δst) and the integral turbulent characteristics test (ITC): class 1-3 (high quality), class 4-6 (good), class 7-8 (poor, better than gap filling data), class9 (rejected). In addition to the above processing steps, the half-hourly flux data were screened in a four-step procedure: (1) data from periods of sensor malfunction were rejected; (2) data collected before or after 1 h of precipitation were rejected; (3) incomplete 30 min data were rejected when the missing data constituted more than 3% of the 30 min raw record; and (4) data were rejected at night when the friction velocity (u*) was less than 0.1 m/s. There were 48 records per day, and the missing data were replaced with -6999. The released data contained the following variables: DATE/TIME, wind direction (Wdir, °), wind speed (Wnd, m/s), the standard deviation of the lateral wind (Std_Uy, m/s), virtual temperature (Tv, ℃), H2O mass density (H2O, g/m3), CO2 mass density (CO2, mg/m3), friction velocity (ustar, m/s), stability (z/L), sensible heat flux (Hs, W/m2), latent heat flux (LE, W/m2), carbon dioxide flux (Fc, mg/ (m2s)), quality assessment of the sensible heat flux (QA_Hs), quality assessment of the latent heat flux (QA_LE), and quality assessment of the carbon flux (QA_Fc). The quality marks of sensible heat flux, latent heat flux and carbon flux are divided into three levels (quality marks 0 have good data quality, 1 have good data quality and 2 have poor data quality). In this dataset, the time of 0:30 corresponds to the average data for the period between 0:00 and 0:30; the data were stored in *.xls format. Detailed information can be found in the suggested references.
2020-07-28 View Details
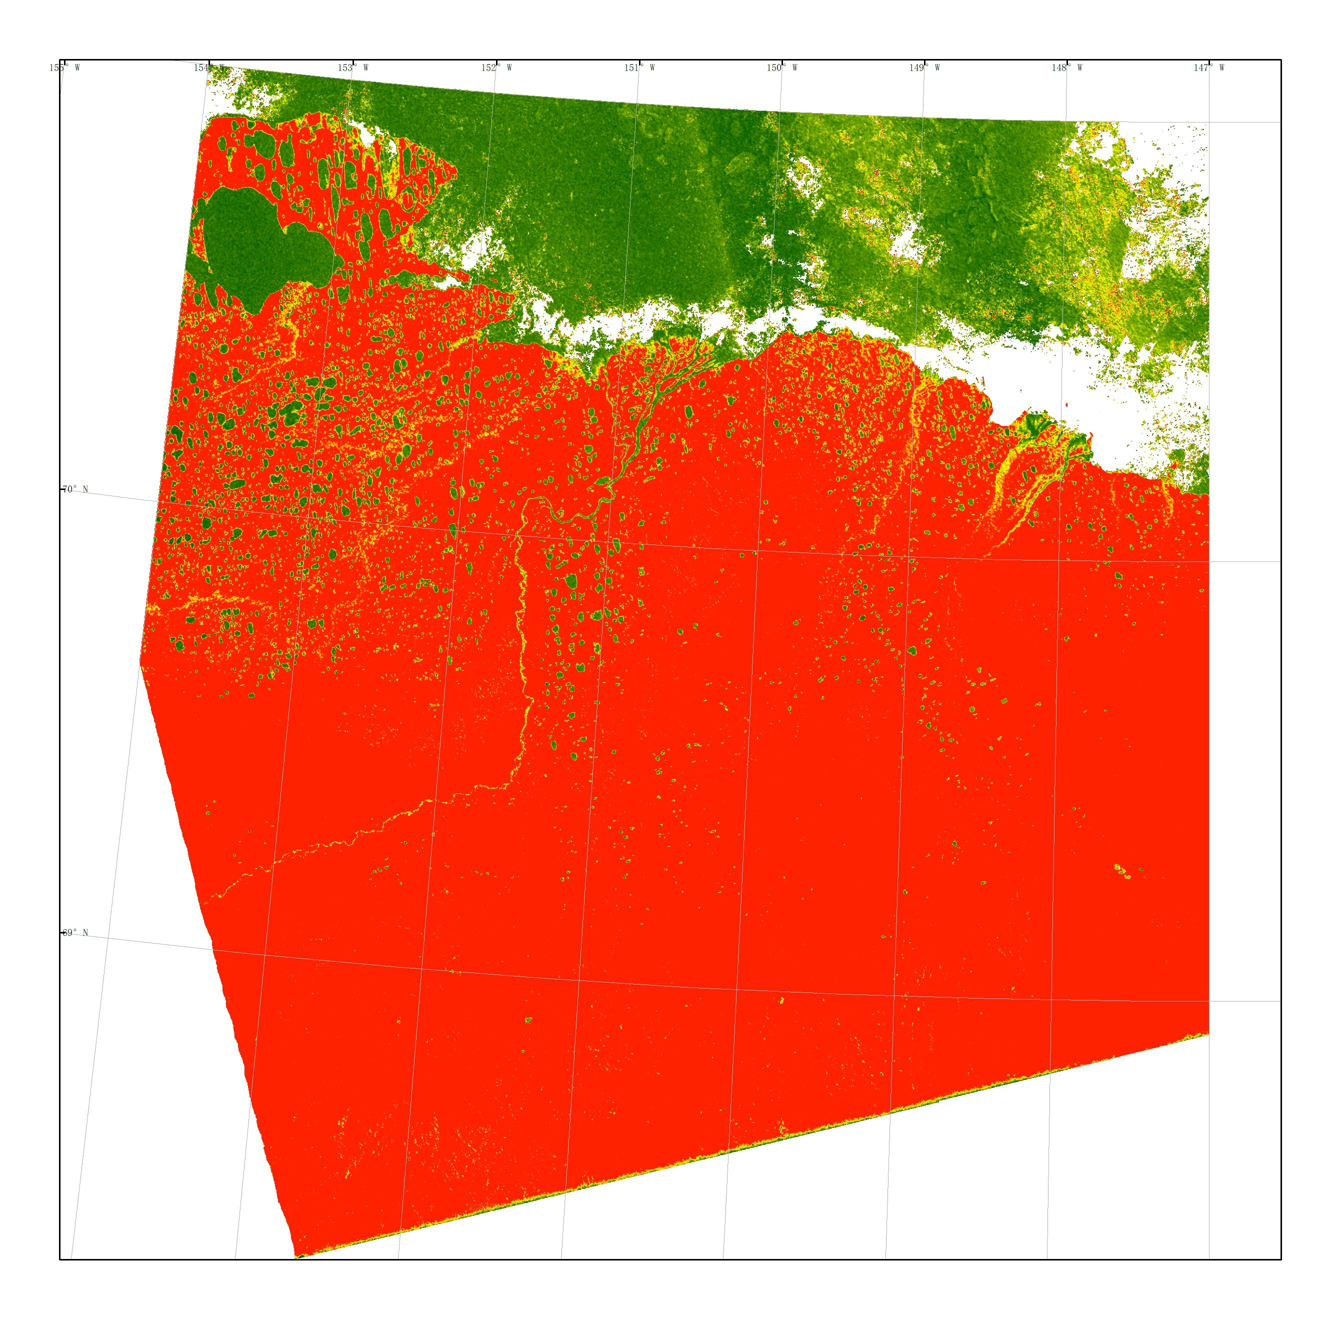
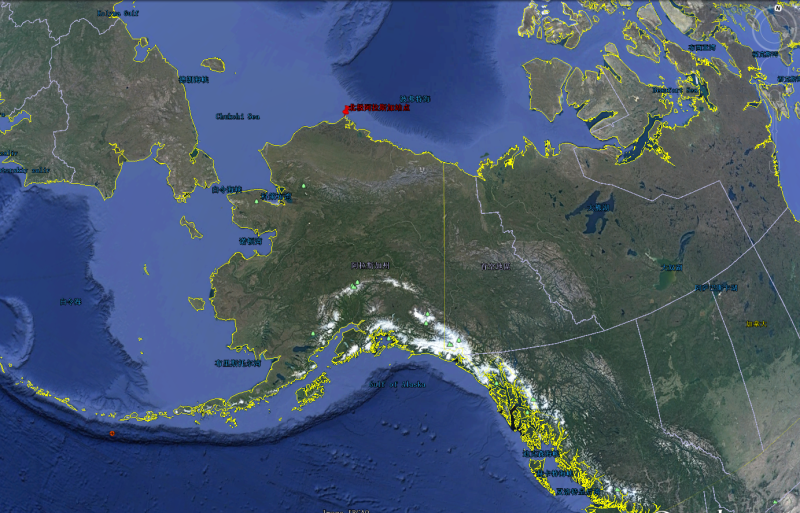
Wildfires can strongly affect the frozen soil environment by burning surface vegetation and soil organic matter. Vegetation affected by fire can take many years to return to mature pre-fire levels. In this data set, the effects of fires on vegetation regrowth in a frozen-ground tundra environment in the Anaktuvuk River Basin on the North Slope of Alaska were studied by quantifying changes in C-band and L-band SAR backscatter data over 15 years (2002-2017). After the fire, the C- and L-band backscattering coefficients increased by 5.5 and 4.4 dB, respectively, in the severe fire area compared to the unburned area. Five years after the fire, the difference in C-band backscattering between the fire zone and the unburned zone decreased, indicating that the post-fire vegetation level had recovered to the level of the unburned zone. This long recovery time is longer than the 3-year recovery estimated from visible wavelength-based NDVI observations. In addition, after 10 years of vegetation recovery, the backscattering of the L-band in the severe fire zone remains approximately 2 dB higher than that of the unburned zone. This continued difference may be caused by an increase in surface roughness. Our analysis shows that long-term SAR backscattering data sets can quantify vegetation recovery after fire in an Arctic tundra environment and can also be used to supplement visible-wavelength observations. The temporal coverage of the backscattering data is from 2002 to 2017, with a time resolution of one month, and the data cover the Anaktuvuk River area on the North Slope of Alaska. The spatial resolution is 30~100 m, the C- and L-band data are separated, and a GeoTIFF file is stored every month. For details on the data, see SAR Backscattering Data of the Anaktuvuk River Basin on the North Slope of Alaska - Data Description.
2020-07-28 View Details
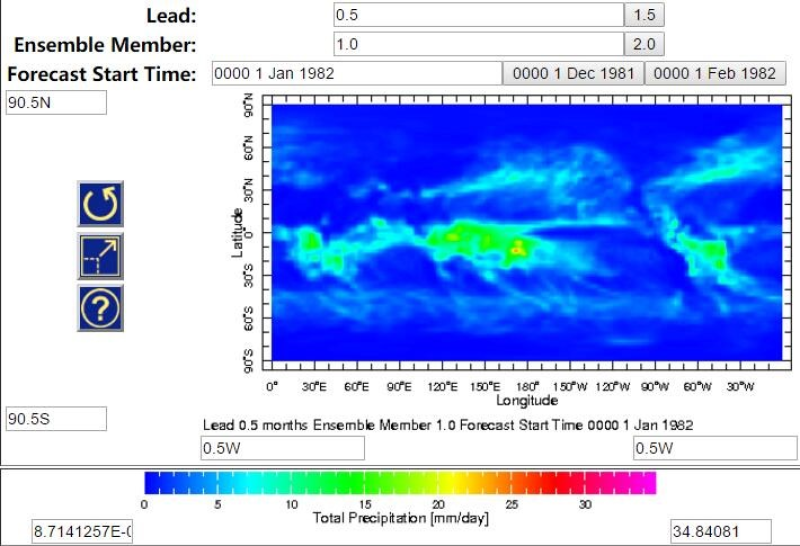
The North American Multi-Model Ensemble (NMME) Forecast is a multi-modal ensemble seasonal forecasting system jointly published by the US Model Center (including NOAA/NCEP, NOAA/GFDL, IRI, NCAR, and NASA) and the Canadian Meteorological Centre. The data include retrieval data from 1982 to 2010 and real-time weather forecast data from 2011 to the present. The forecasting system covers the whole world with a temporal resolution of one month and a horizontal spatial resolution of 1°. NMME has nine climate forecasting models, and each contains 6-28 ensemble members, with a forecasting period of 9-12 months. The name, source, ensemble members, and forecasting period of the climate models are as follows: 1) CMC1-CanCM3, Environment Canada, 10 models, 12 months 2) CMC2-CanCM4, Environment Canada, 10 models, 12 months 3) COLA-RSMAS-CCSM3, National Center for Atmospheric Research, 6 models, 12 months 4) COLA-RSMAS-CCSM34, National Center for Atmospheric Research, 10 models, 12 months 5) GFDL-CM2p1-aer04, NOAA Geophysical Fluid Dynamics Laboratory, 10 models, 12 months 6) GFDL-CM2p5-FLOR-A06, NOAA Geophysical Fluid Dynamics Laboratory, 12 models, 12 months 7) GFDL-CM2p5-FLOR-B01, NOAA Geophysical Fluid Dynamics Laboratory, 12 models, 12 months 8) NASA-GMAO-062012, NASA Global Modeling and Assimilation Office, 12 models, 9 months 9) NCEP-CFSv2, NOAA National Centers for Environmental Prediction, 24/28 models, 10 months With the exception of the CFSv2 model (which includes only precipitation and average temperature), the variables of other models include precipitation, average temperature, maximum temperature, and minimum temperature. Each model ensemble member stores one NC file every month for each variable. The meteorological elements, variable names, units, and physical meanings of each variable are as follows: 1) Average temperature, tref, K, monthly average near-surface (2-m) average air temperature 2) Maximum temperature, tmax, K, monthly average near-surface (2-m) maximum air temperature 3) Minimum temperature, tmin, K, monthly average near-surface (2-m) minimum air temperature 4) Precipitation, prec, mm/day, monthly average precipitation. The dataset has been widely applied in climate forecasting, hydrological forecasting, and quantitatively estimating model forecasting uncertainty.
2020-06-03 View Details
The MODIS land cover type product is a data classification product (MOD12Q1) with different classification schemes for land cover features extracted from Terra data each year. These data are generated by reprojecting the standard MODIS land cover product MOD12Q1 to geographic coordinates with a spatial resolution of one-half degree. The basic land cover classification comprises the 17 types defined by the International Geosphere Biosphere Programme (IGBP): 11 types of natural vegetation classification, 3 types of land use and land inlays, and 3 types of nonvegetation land classification. It covers a longitude range of -180-180 degrees and a latitude range of -64-84 degrees. The data are in GeoTIFF format. This data are free to use, and the copyright belongs to the University of Maryland Department of Geography and NASA.
2020-06-03 View Details
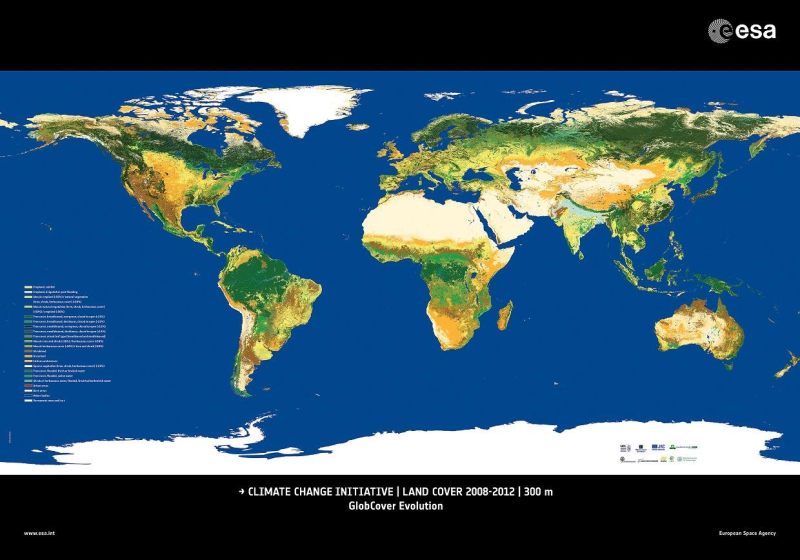
The land cover classification product is the second phase product of the ESA Climate Change Initiative (CCI), with a spatial resolution of 300 meters and a temporal coverage of 1992-2015. The spatial coverage is latitude -90-90 degrees, longitude -180-180 degrees, and the coordinate system is the geographic coordinate WGS84. The classification of the surface coverage is based on the Land Cover Classification System (LCCS) of the Food and Agriculture Organization of the United Nations. When the data are used for scientific research purposes, the ESA CCI Land Cover project should be acknowledged. In addition, the published article should be send to contact@esalandcover-cci.org.
2020-06-03 View Details
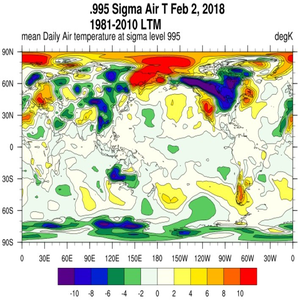
NCEP/NCAR Reanalysis 1 is an assimilation of data from the past (1948-recent). It was developed by the National Centers for Environmental Prediction-National Center for Atmospheric Research (NCEP–NCAR) in the US to act as an advanced analysis and prediction system. Most of the data are from the original daily average data of the PSD (Physical Sciences Division). However, the data from 1948 to 1957 are slightly different because these data are conventional (non-Gaussian) grid data. The information published on the official website is generally from 1948 to the present, and the latest information is generally updated every two days. For data on an isostatic surface, the general vertical resolution is 17 layers, from 1000 hPa to 10 hPa. The horizontal resolution is typically 2.5° x 2.5°. The NCEP reanalysis data are systematically comparable among international atmospheric science reanalysis data sets. Compared with the reanalysis data of the European Center, the initial year is earlier, and the latest data updates are more frequent. These two sets of reanalysis data are currently the most widely used data sets in the world. For details of the data, please visit the following website: https://www.esrl.noaa.gov/psd/data/gridded/data.ncep.reanalysis.html
2020-06-03 View Details
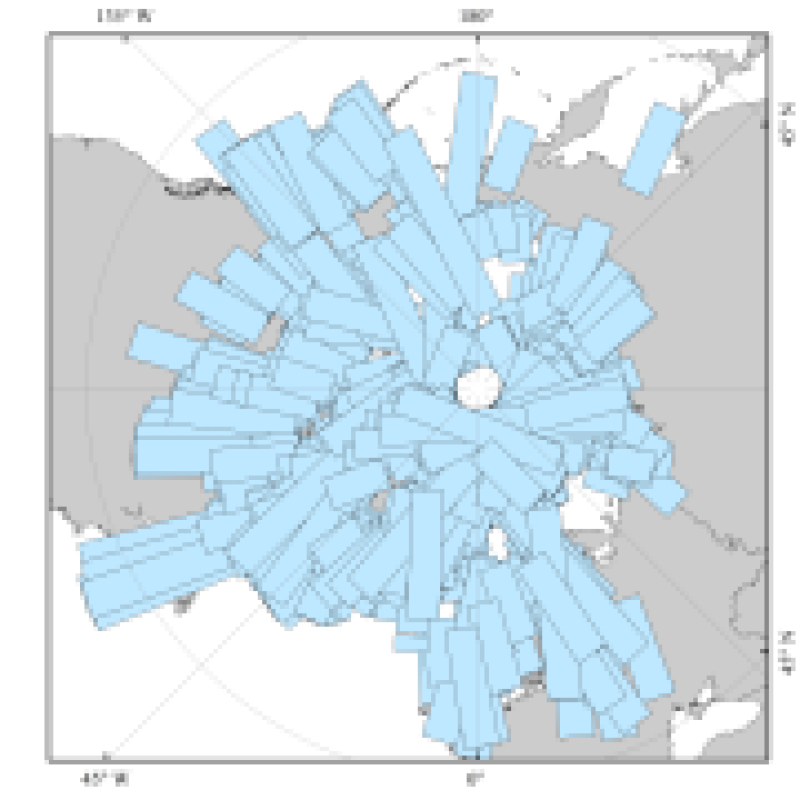
This data set contains the wide swath mode Level 1B SAR data acquired over Greenland in 2005 by the ASAR sensor of the ENVISAT-1 satellite. The width is 400 km, the spatial resolution is 75 m, and the absolute positioning accuracy is approximately 200 m. The SAR data are stored in a time-growth order, which causes the images of the descending track to be left-right mirror images and the images of the ascending track to be up-down images. The naming scheme for these data is as follows: ASA_IMS_1PPIPA 20050402_095556_000000162036_00065_16151_0388.N1 ASA: Product identification, ASAR Sensor IMS: Reception and processing information of the data (imaging modes, such as WS, WSS, IM, ...) 1PPIPA: Customized number 20050402: Acquisition time of the data (UTC time) 095556: Geographic location (start, end) 000000162036: Information on the satellite orbit 00065: Product trust data 16151: Size and structure information of the product 0388 => Check code
2020-06-03 View Details
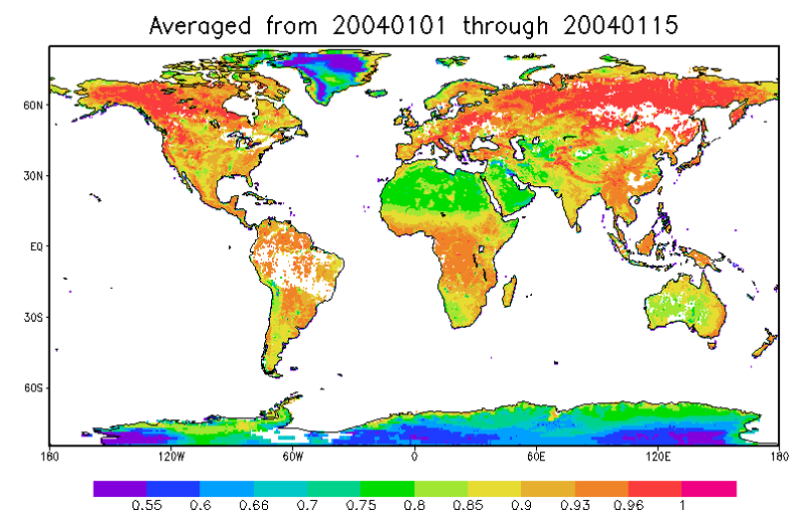
The aerosol optical thickness data of the Arctic Alaska station is based on the observation data products of the atmospheric radiation observation plan of the U.S. Department of energy at the Arctic Alaska station. The data coverage time is updated from 2017 to 2019, with the time resolution of hour by hour. The coverage site is the northern Alaska station, with the longitude and latitude coordinates of (71 ° 19 ′ 22.8 ″ n, 156 ° 36 ′ 32.4 ″ w). The source of the observed data is retrieved from the radiation data observed by mfrsr instrument. The characteristic variable is aerosol optical thickness, and the error range of the observed inversion is about 15%. The data format is NC format. The aerosol optical thickness data of Qomolangma station and Namuco station in the Qinghai Tibet Plateau is based on the observation data products of Qomolangma station and Namuco station from the atmospheric radiation view of the Institute of Qinghai Tibet Plateau of the Chinese Academy of Sciences. The data coverage time is from 2017 to 2019, the time resolution is hour by hour, the coverage sites are Qomolangma station and Namuco station, the longitude and latitude coordinates are (Qomolangma station: 28.365n, 86.948e, Namuco station Mucuo station: 30.7725n, 90.9626e). The source of the observed data is retrieved from the radiation data observed by mfrsr instrument. The characteristic variable is aerosol optical thickness, and the error range of the observed inversion is about 15%. The data format is TXT.
2020-06-03 View Details
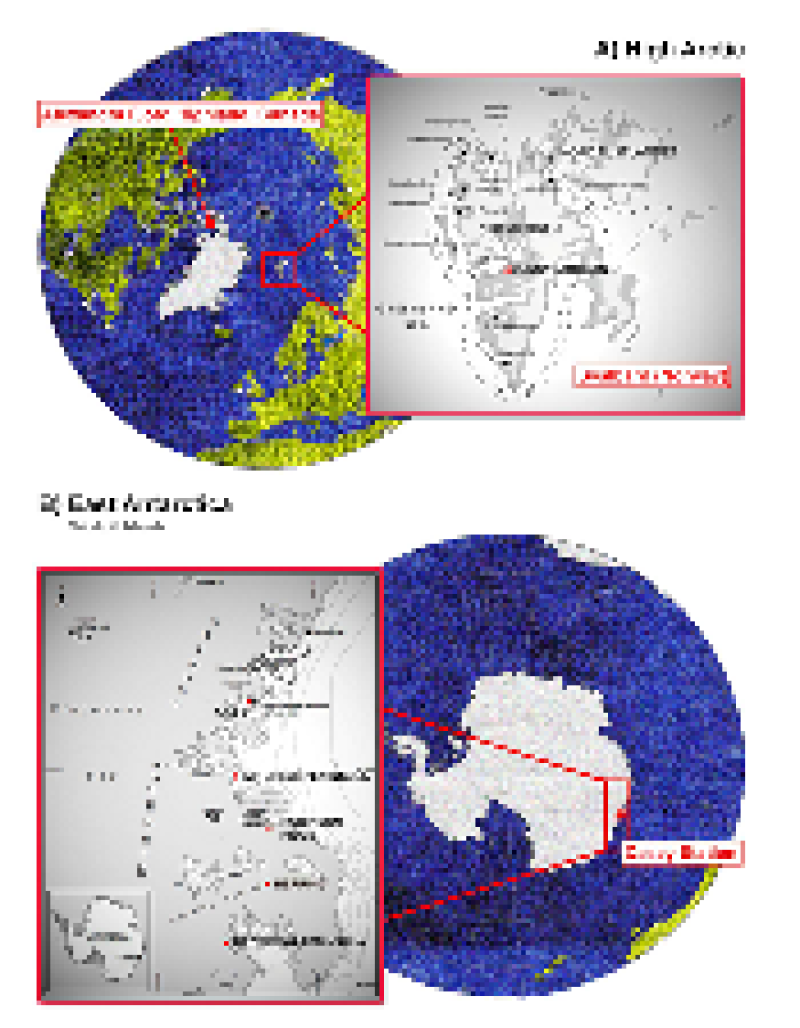
The data set of prokaryotic microorganism distribution in the snow and ice of the Arctic Antarctic and the Tibetan Plateau provides the bacterial 16S ribosomal RNA gene sequence collected by the experimental group led by Yongqin Liu from the NCBI database during 2010 to 2018. The keywords for NCBI database search are Antarctic, Arctic Tibetan, and Glacier. The collected sequences were calculated using the DOTOUR software to obtain the similarities between sequences, the sequences with similarities above 97% were clustered into one OTU, and the OTU representative sequence was defined. The OTU representative sequence was compared with the RDP database by the "Classifier" software and was identified as level one when the reliability exceeded 80%. After acquiring the sequence, the GPS coordinates of the sample were obtained by reading the sample information in the sequence file. These data contain the sequence of 16S ribosomal RNA gene fragments for each sequence, evolutionary classification, and sample GPS coordinates. Compared with sequences based on high-throughput sequencing, these data have a longer sequence and more accurate classification. It is significant for comparing the evolutionary information of three-pole microorganisms and understanding the evolution of psychrophilic microorganisms.
2020-06-03 View Details

This dataset is the spatial distribution map of the marshes in the source area of the Yellow River near the Zaling Lake-Eling Lake, covering an area of about 21,000 square kilometers. The data set is classified by the Landsat 8 image through an expert decision tree and corrected by manual visual interpretation. The spatial resolution of the image is 30m, using the WGS 1984 UTM projected coordinate system, and the data format is grid format. The image is divided into five types of land, the land type 1 is “water body”, the land type 2 is “high-cover vegetation”, the land type 3 is “naked land”, and the land type 4 is “low-cover vegetation”, and the land type 5 is For "marsh", low-coverage vegetation and high-coverage vegetation are distinguished by vegetation coverage. The threshold is 0.1 to 0.4 for low-cover vegetation and 0.4 to 1 for high-cover vegetation.
2020-06-03 View Details
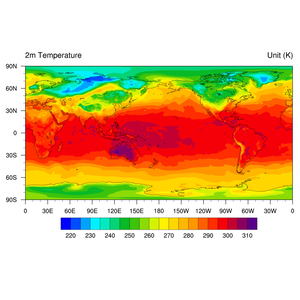
The data set of ERA-Interim global surface air temperature reanalysis (1979-2016) was obtained from the European Center for Medium-Range Weather Forecasts (ECMWF) by adopting the ECMWF IFS forecasting system (T255, 60 layers) and using the four-dimensional variational assimilation system (8DVAR) with an analysis window of 12 hours to assimilate satellite remote sensing data (TOVS, GOES, Meteosat, etc.) and regular observations of the surface and upper atmosphere in different regions of the world and from different sources. The surface air temperature (2 m air temperature) data span the time range from January 1979 to December 2016 and cover the whole world with the projection of equal latitude and longitude, a temporal resolution of six hours, and a horizontal resolution of 0.75. The data were stored as a NetCDF format file once a month and included longitude, latitude, time, and temperature (t2m, unit: K), with 241 latitudinal grid points and 480 longitudinal grid points.
2020-06-03 View Details
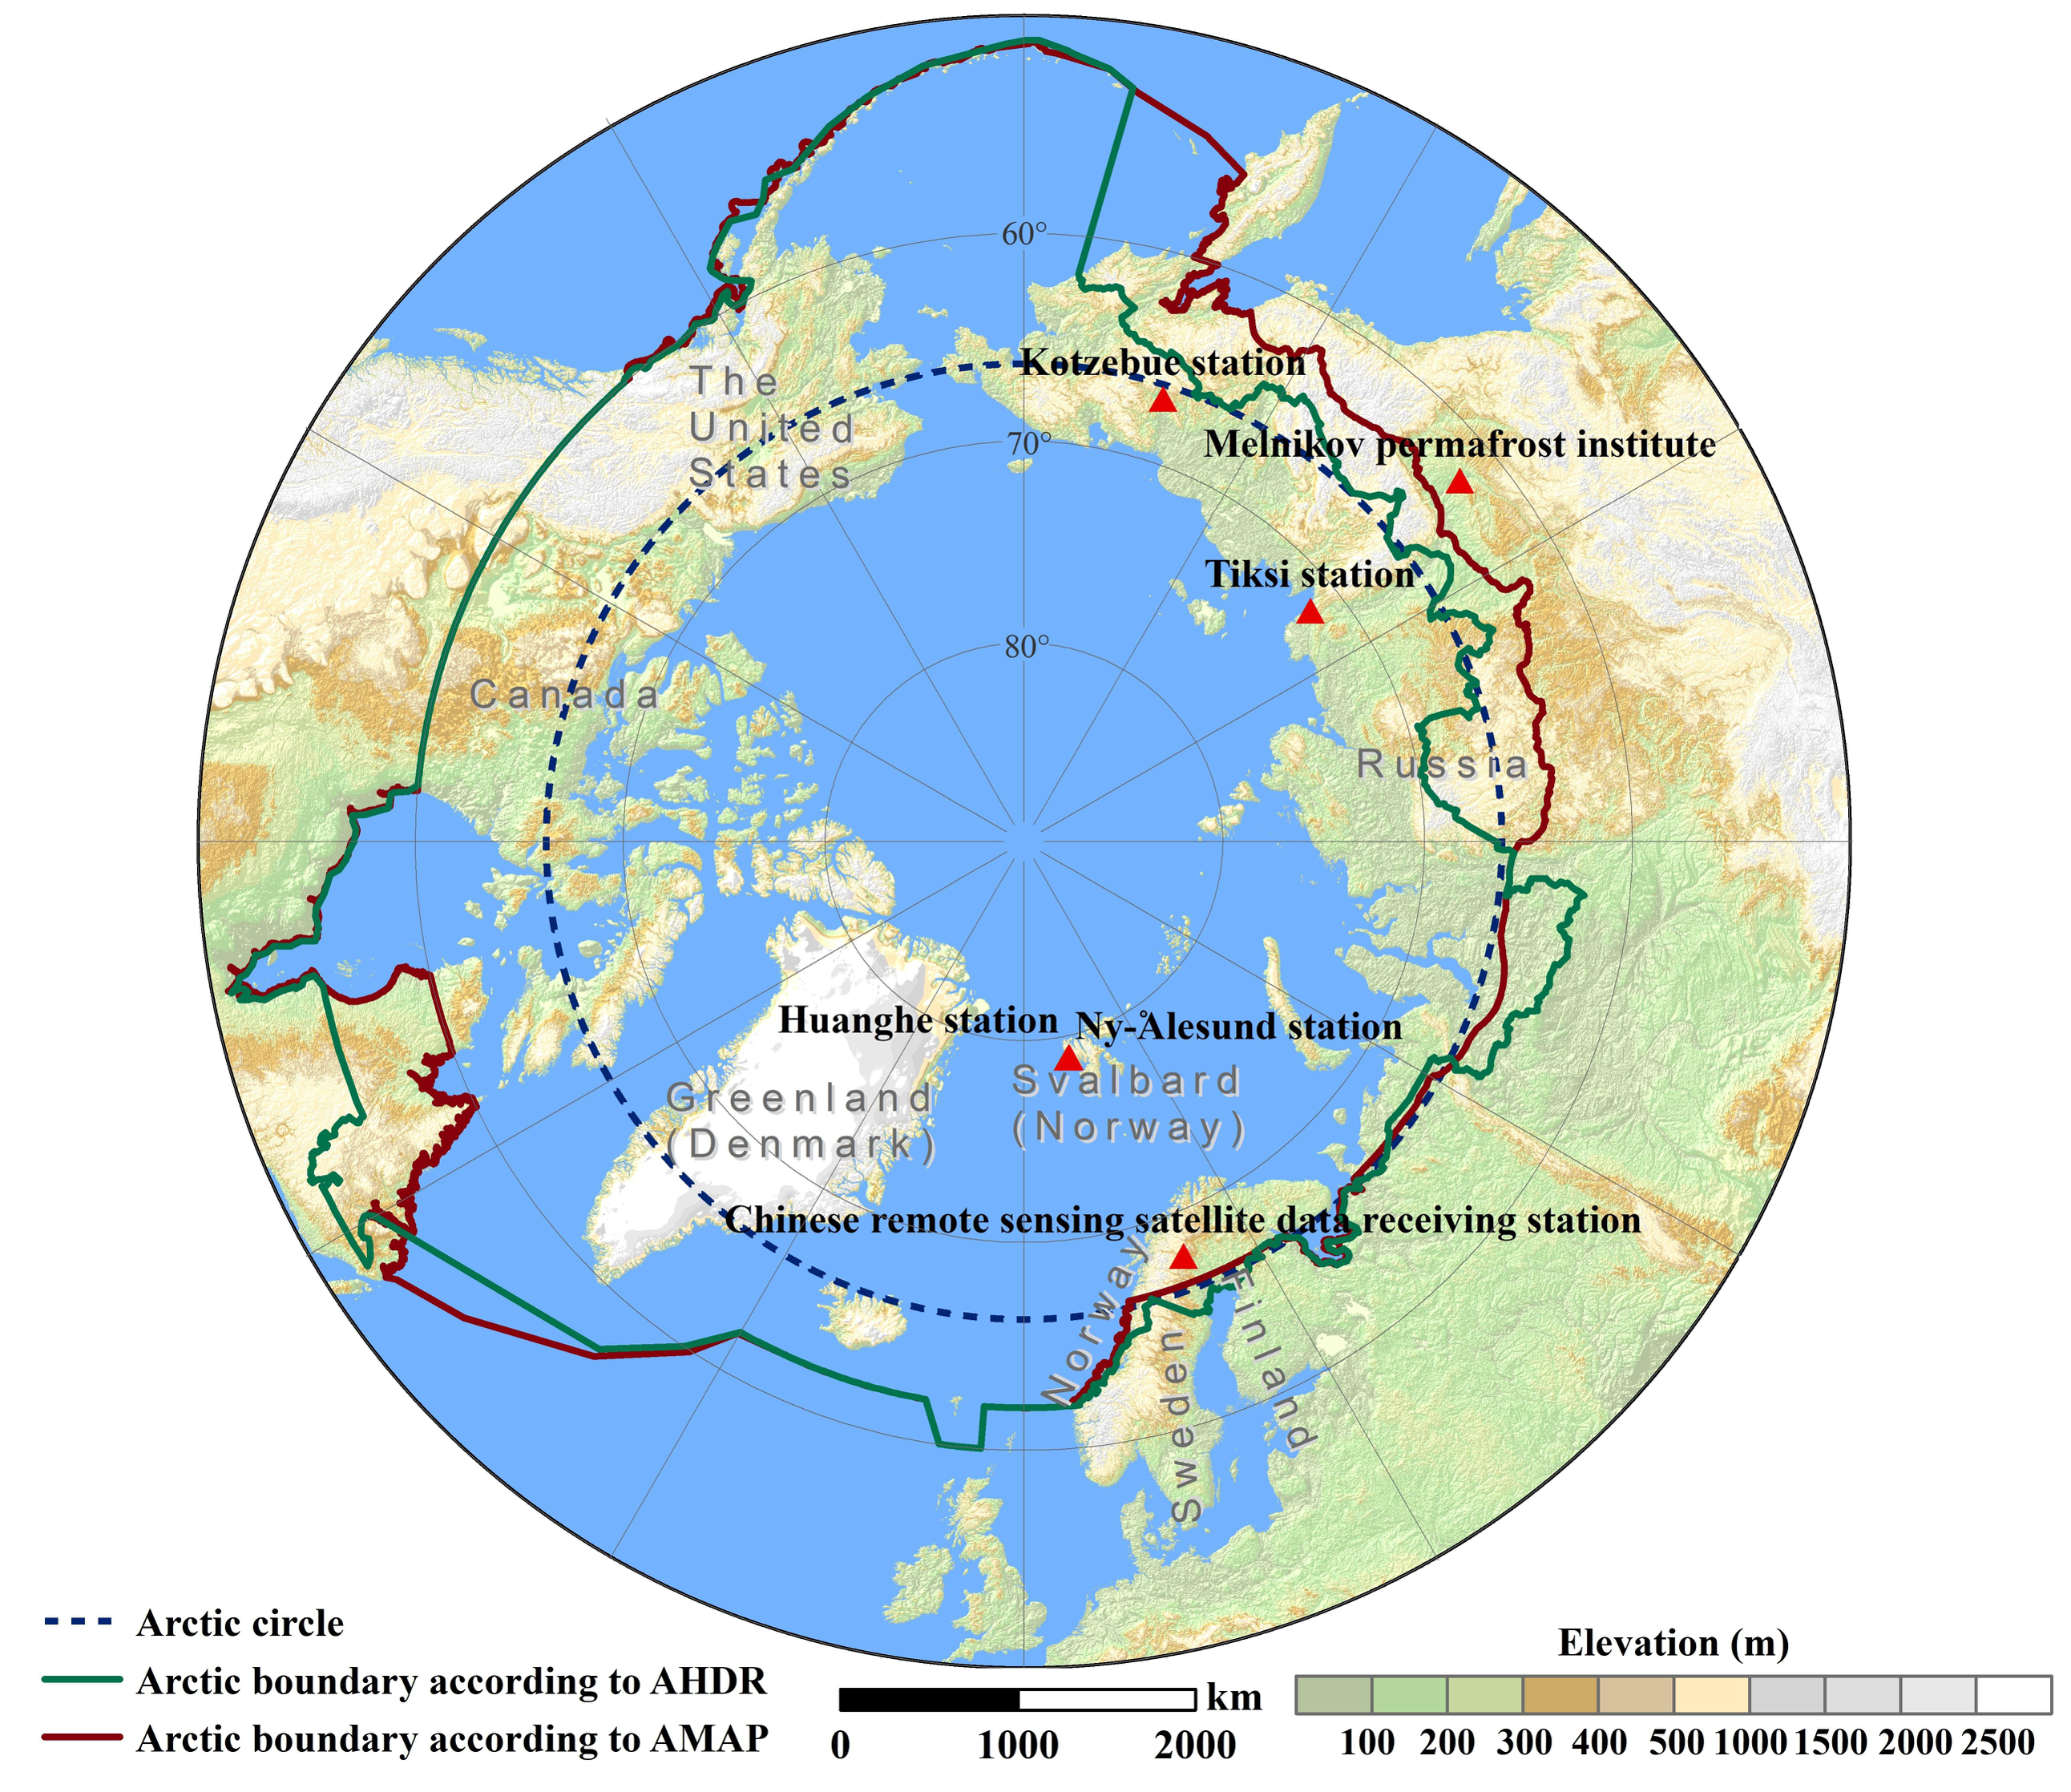
The two regions of North Pole are defined by the Arctic Monitoring and Assessment Programme (AMAP) working group and Arctic Human Development Report (AHDR). The AMAP Arctic’s geographical coverage extends from the High Arctic to the sub Arctic areas of Canada, the Kingdom of Denmark (Greenland and the Faroe Islands), Finland, Iceland, Norway, the Russian Federation, Sweden and the United States, including associated marine areas. The AHDR Arctic encompasses all of Alaska, Canada North of 60°N together with northern Quebec and Labrador, all of Greenland, the Faroe Islands, and Iceland, and the northernmost counties of Norway, Sweden and Finland. The situation in Russia is harder to describe in simple terms. The area included, as demarcated by demographers, encompasses the Murmansk Oblast, the Nenets, YamaloNenets, Taimyr, and Chukotka autonomus okrugs, Vorkuta City in the Komi Republic, Norilsk and Igsrka in Krasnoyarsky Kray, and those parts of the Sakha Republic whose boundaries lie closest to the Arctic Circle.
2020-05-28 View Details

Based on the Global 1,000,000 Basic Geographic Data (2010) of the Resource and Environment Science Data Center of the Chinese Academy of Sciences, the administrative divisions of Arctic countries (USA, Canada, Russia, Norway (including Greenland and the Faroe Islands), Denmark, Sweden, Finland, and Iceland) at the national and provincial levels are extracted via ArcGIS. The data are stored separately by nation. The data format is the .shp format of ArcGIS, and the projection mode is GCS_WGS_1984. The national data are from http://www.resdc.cn/data.aspx?DATAID=205. The provincial data are from http://www.resdc.cn/data.aspx?DATAID=206.
2020-05-28 View Details
Digital Elevation Model (DEM) is a kind of solid ground Model that represents the ground Elevation in the form of a set of ordered numerical arrays. The arctic region within 66 ° 34 'refers to the arctic regions and parts of Greenland in the arctic.Elevation data include arctic digital dem and hillshade data in tif format.Range of 66 ° ~ 90 ° N N, the spatial resolution of 0.008 ° x 0.008 °. The data is downloaded from NASA global elevation data DEM describes ground elevation information, which is widely used in surveying and mapping, hydrology, meteorology, geomorphology, geology, soil, engineering construction, communication, military and other fields of national economy and national defense as well as humanities and natural sciences.
2020-05-28 View Details
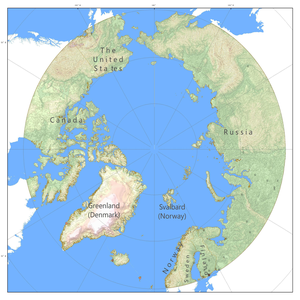
The data set of 1:100,000 settlements in the Arctic includes all settlements in the North Pole (Arctic_Resident), capital settlements (Arctic_Capitals), Cities_up_to_75K settlements and other vector spatial data and related attribute data: urban name (ENG_NAME), CITY_POP and other properties. The data comes from the 1:100,000 ADC_WorldMap global data set,The data through topology, warehousing and other data quality inspection,It's most comprehensive, current and seamless geographic digital data for the whole earth. The world map coordinate system is latitude and longitude, WGS84 datum surface,Arctic specific projection parameters(North_Pole_Stereographic).
2020-05-27 View Details
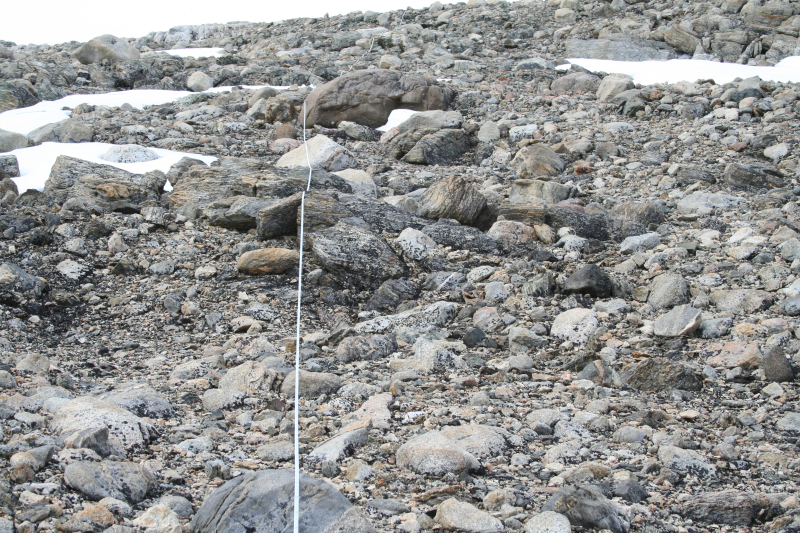
The Antarctic and Arctic bacterial distribution data set provides distribution characteristics of bacteria in the Arctic and Antarctic. The collection period of the samples was from December 13,2005, to December 8,2006; 52 samples were obtained from 3 Arctic regions (Spitsbergen Slijeringa, Spitsbergen Vestpynten, and Alexandra Fjord_Highlands), and 171 samples were obtained from 5 Antarctic regions (the Mitchell Peninsula, Casey station main Power house, Robinsons Ridge, Herring Island, and Browning Peninsula). The soil surface samples were stored in liquid nitrogen after collection, shipped to a Sydney laboratory, and extracted using the FastPrep DNA kit. The extracted DNA samples were processed by 27F (5'-GAGTTTGATCNTGGCTCA-3' and 519R (5'-GTNTTACNGCGGCKGCTG-3') to amplify the 16S rRNA gene fragments. The amplified fragments were sequenced by the 454 method, and the raw data were analyzed by Mothur software. First, the sequences with poor sequencing quality were removed, the sequences were then sorted, and the chimera sequences were removed. The similarities between the sequences were calculated, the sequences with similarities above 97% were clustered into one OTU, and the OTU representative sequence was defined. By comparison with the Silva database, the OTU sequences with reliabilities greater than 80% were identified as level one. This data system compared the diversity of microorganisms in the eastern Antarctic with that in the Arctic and is of great significance for the study of the distributions of microorganisms in the Antarctic and Arctic.
2020-04-29 View Details
Contact Support
Links
National Tibetan Plateau Data CenterFollow Us

A Big Earth Data Platform for Three Poles © 2018-2020 No.05000491 | All Rights Reserved
|  No.11010502040845
Tech Support: westdc.cn