
Brief Introduction:The Arctic region is one of the regions most sensitive to climate change and has long received great attention from climate change research. Despite the recent signs of slowing or even stagnation in global warming, climate change in the Arctic has accelerated markedly over the past few decades: on the one hand, sea ice cover in the Arctic summer and autumn is accelerating melting ( As shown in Figure 1), the historical low value of the Arctic sea ice cover area is constantly refreshed. The sea ice cover area in September 2012 is only equivalent to 51% of the average sea ice area from 1979 to 2000, compared to the early 1980s. More than half of the sea ice has disappeared in the summer. The rate of sea ice reduction in 2002-2011 was twice as fast as it was between 1979 and 2006...
Publish Datetime:2018-10-25
Number of Datasets:71
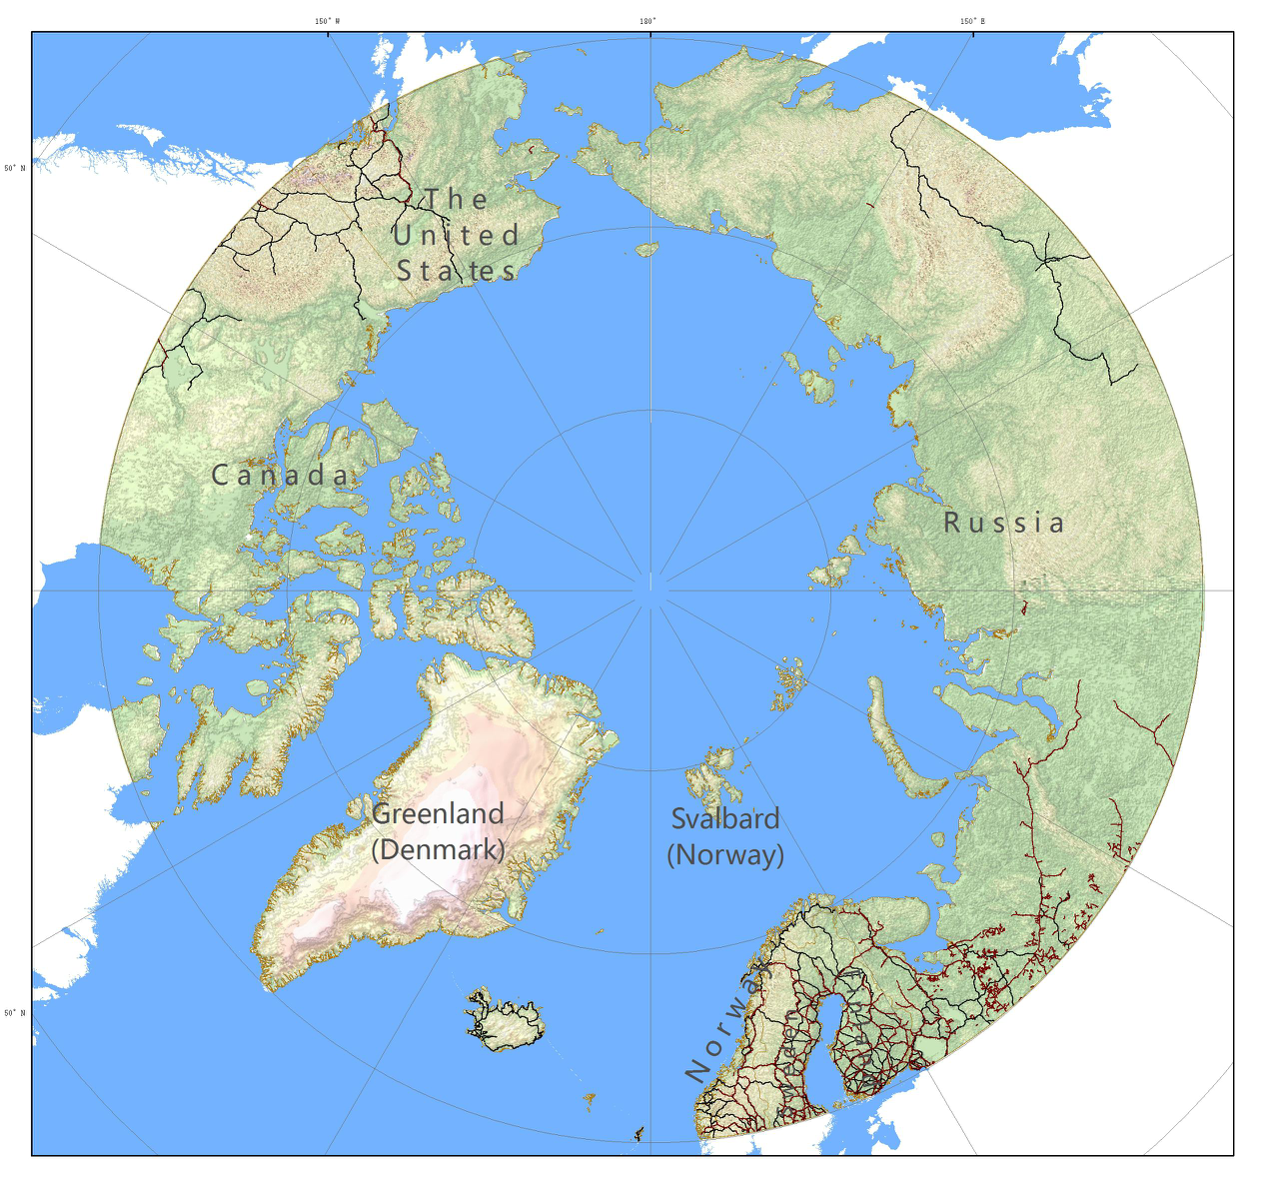
The 1:1,000,000 road data set of the North Pole includes the Arctic_Major_Routes, the Arctic_Minor_Routes, the Arctic_railway vector space data and the related attribute data: road Name and Type. The data comes from the 1:100,000 ADC_WorldMap global data set,The data through topology, warehousing and other data quality inspection,It's most comprehensive, current and seamless geographic digital data for the whole earth. The world map coordinate system is latitude and longitude, WGS84 datum surface,Arctic specific projection parameters(North_Pole_Stereographic).
2019-09-15 View Details
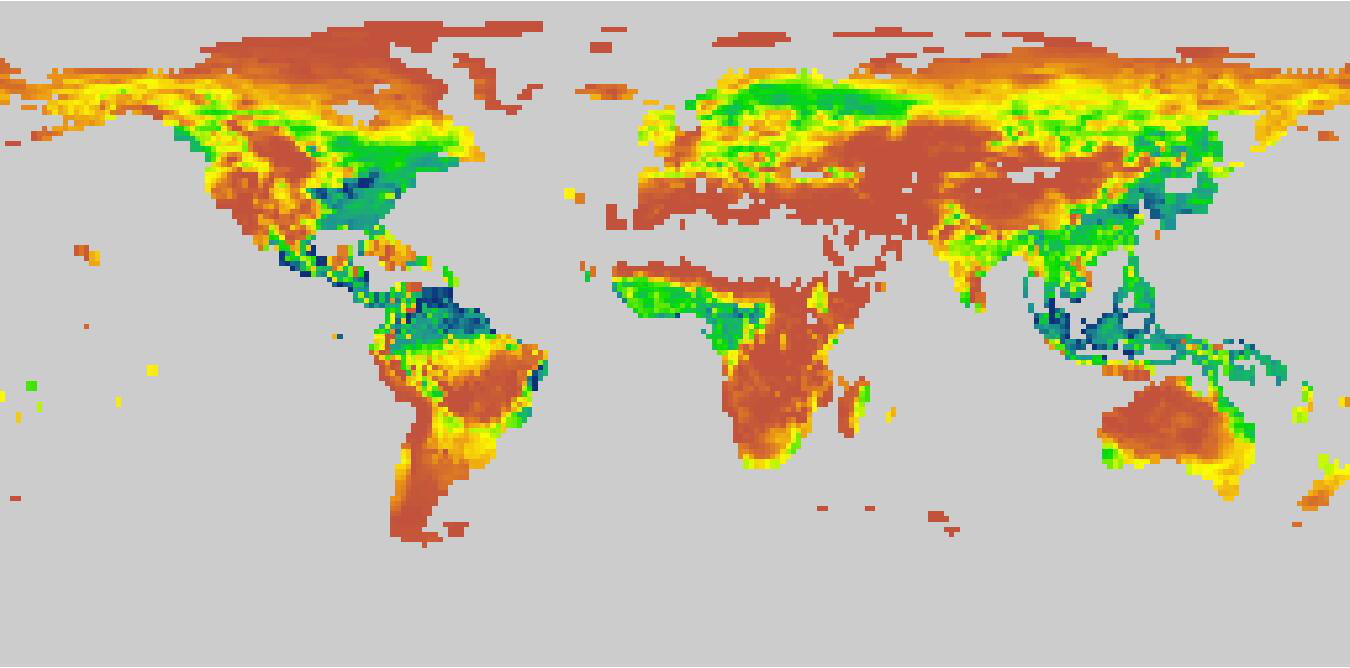
The data set is the global vegetation productivity data, including Gross Primary Productivity(GPP) and Net Primary Productivity (NPP). It was obtained by the CNRM-CM6-1 mode simulation of CMIP6 under the Historical scenario. The time range of the data covers from 1850 to 2014, the time resolution is a month, and the spatial resolution is about 1.406°×1.389°. For the simulated data details, please go to the following link: http://www.umr-cnrm.fr/cmip6/spip.php?article11.
2019-09-15 View Details
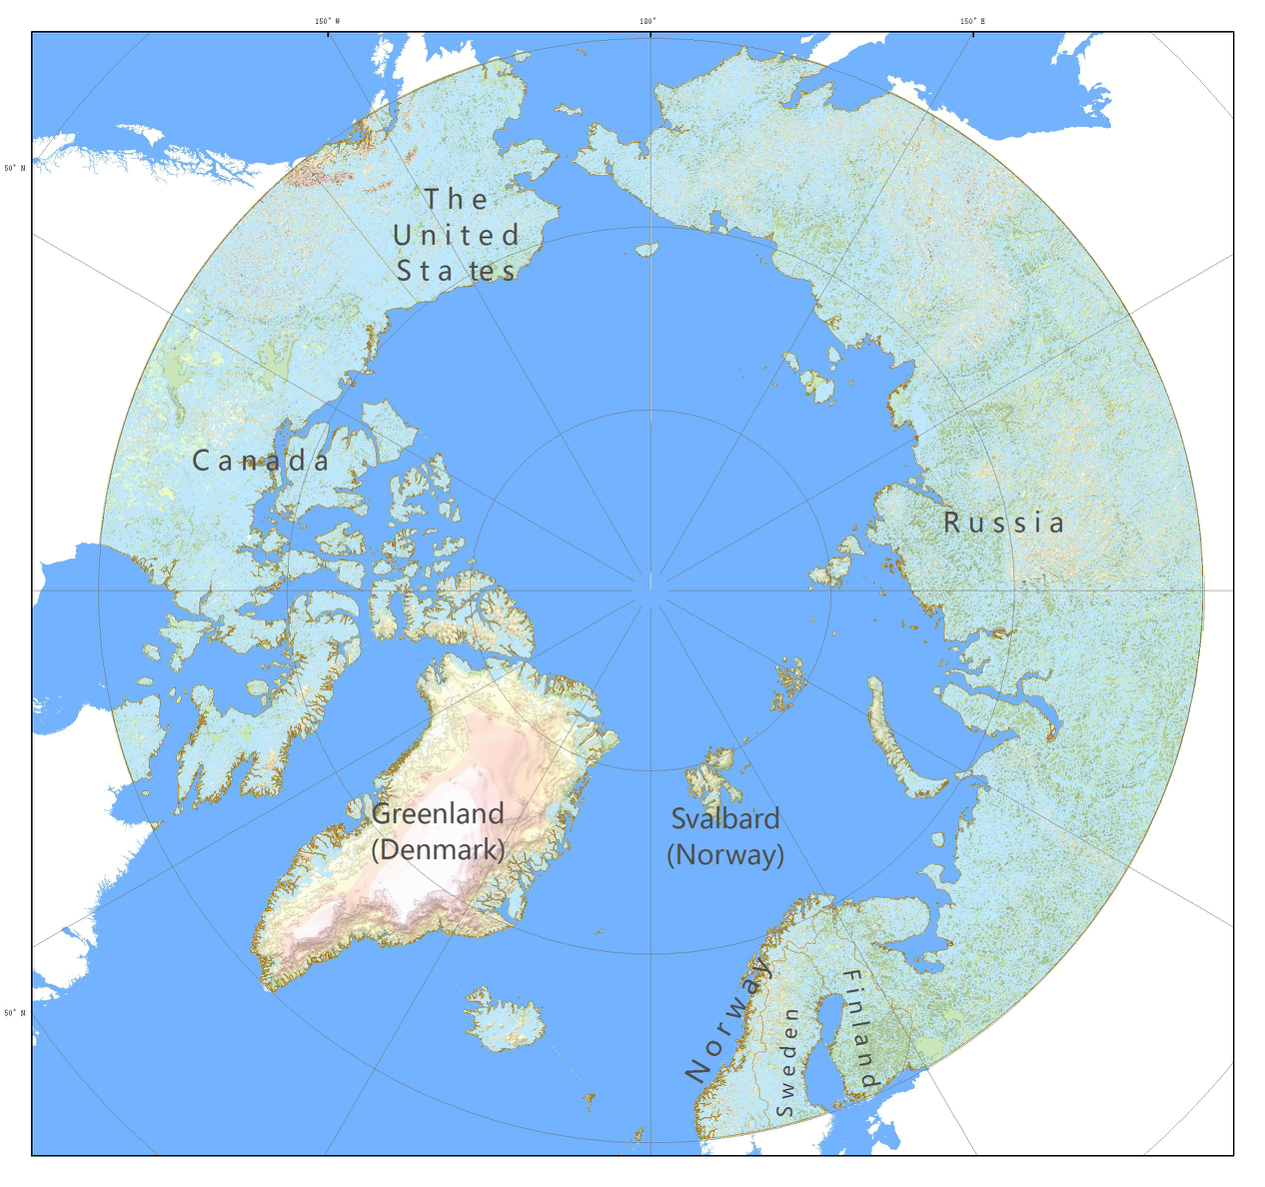
Arctic 1:100,000 stream data set includes Arctic_River vector space data and related attribute data of different grades within the arctic range: Name and Type. The data comes from the 1:100,000 ADC_WorldMap global data set, which is a comprehensive, up-to-date and seamless geographic digital data after the data quality inspection of topology, warehousing and other data. The world map coordinate system is latitude and longitude, WGS84 datum surface, and the arctic data set is the special projection parameter for the arctic (North_Pole_Stereographic).
2019-09-15 View Details
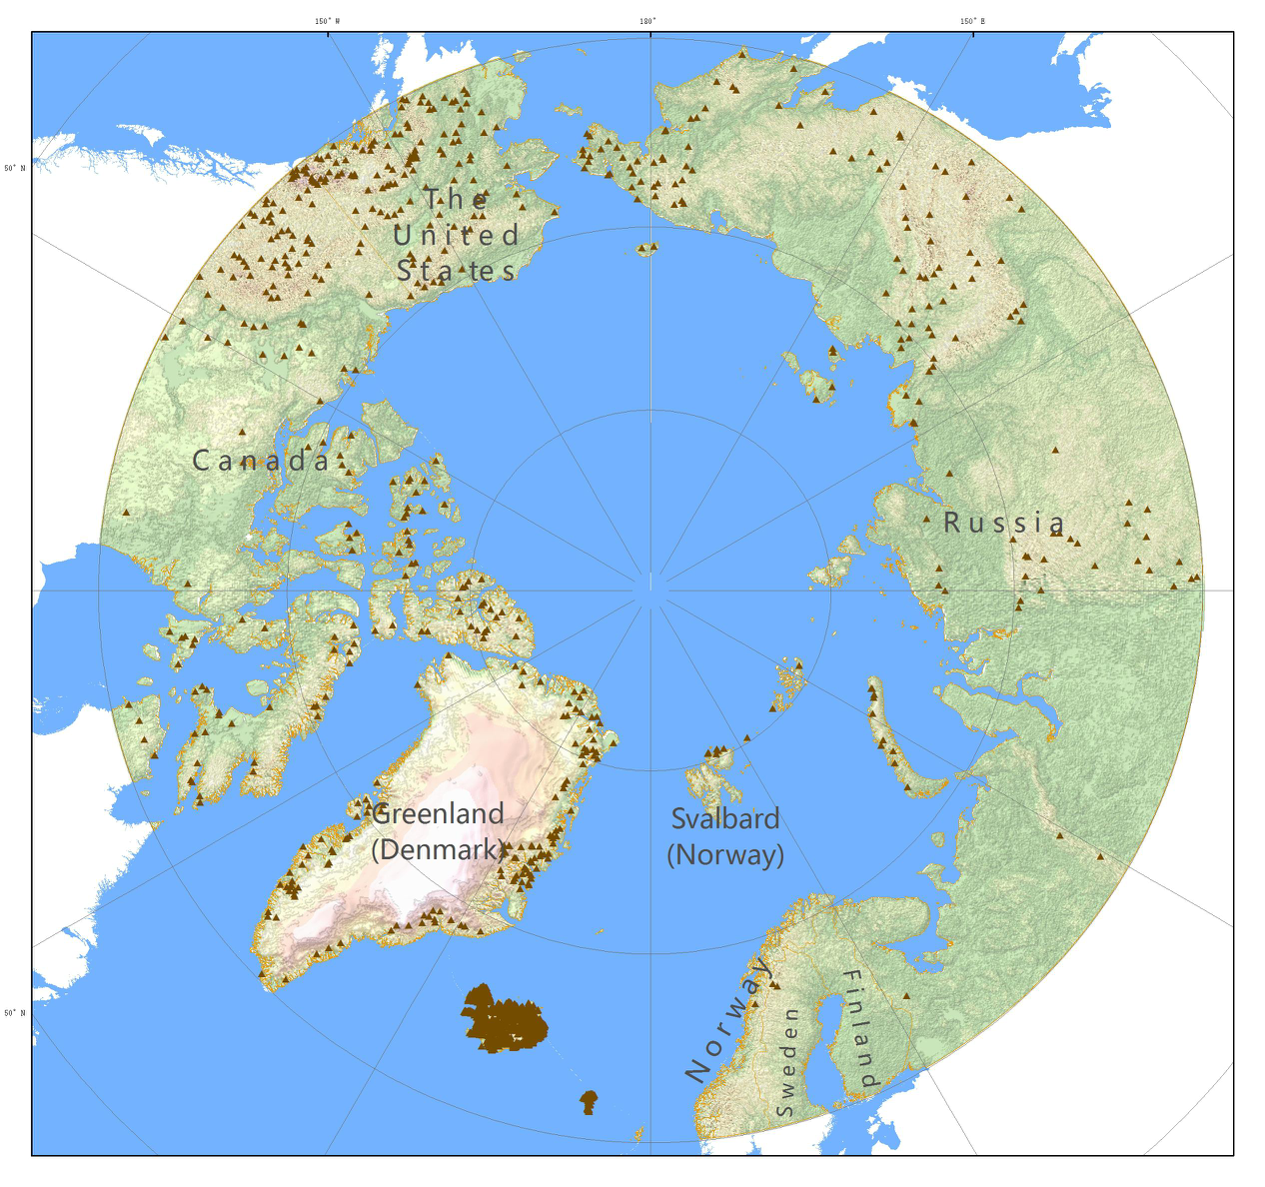
Arctic 1:100,000 mountains data set includes vector spatial distribution data and related attribute data of the Arctic_Mountains in the arctic range: Name, Name of the country where the mountains are located (CNTRY_NAME), abbreviation of the country where the mountains are located (CNTRY_CODE), LATITUDE, LONGITUDE). The data comes from the 1:100,000 ADC_WorldMap global data set,The data through topology, warehousing and other data quality inspection,It's most comprehensive, current and seamless geographic digital data for the whole earth. The world map coordinate system is latitude and longitude, WGS84 datum surface,Antarctic specific projection parameters(North_Pole_Stereographic).
2019-09-14 View Details
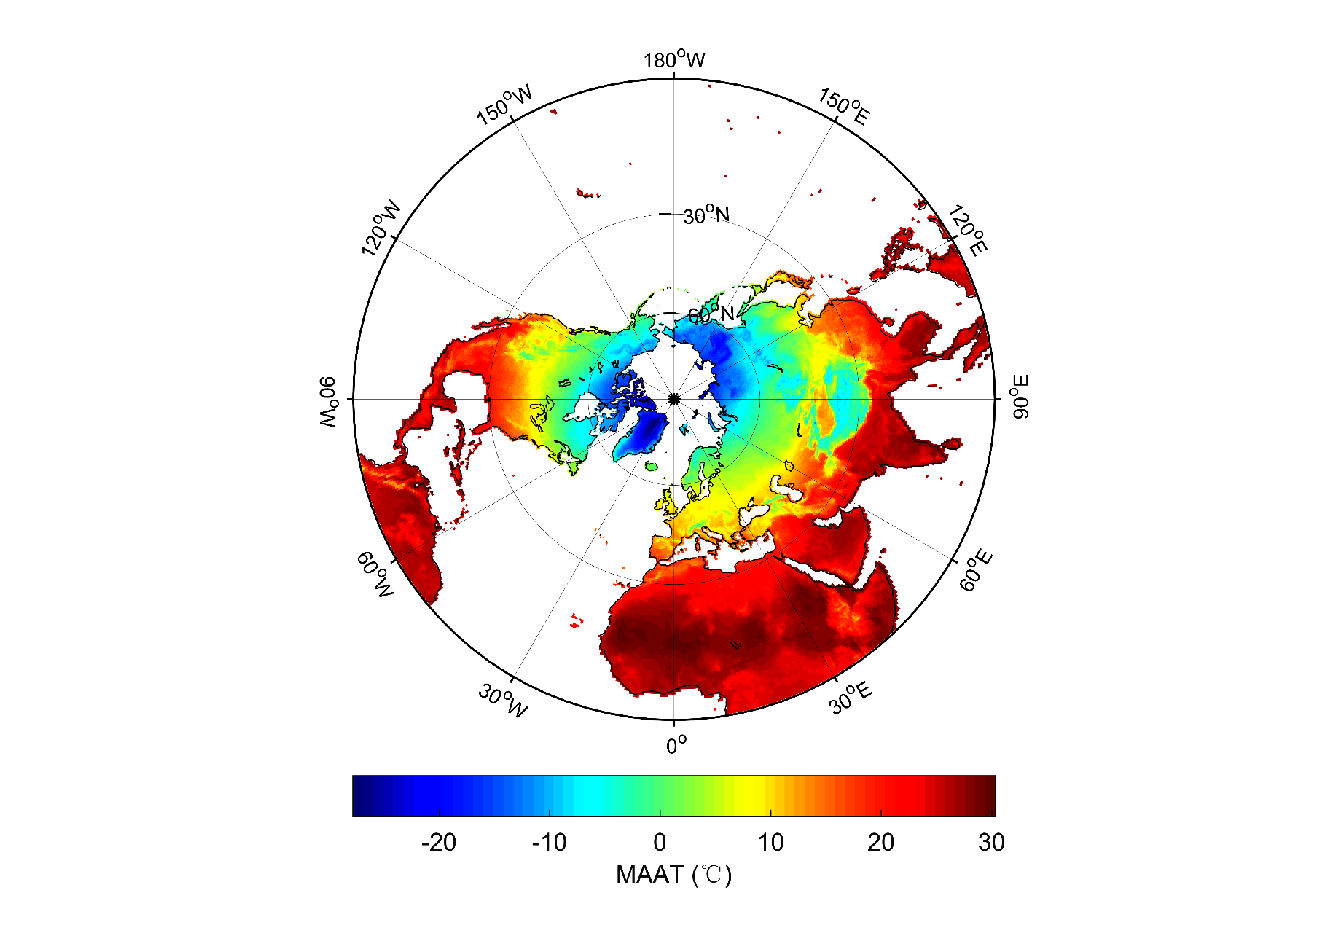
In order to understand the temporal and spatial variation characteristics of temperature changes in the Northern Hemisphere, the study used CRU (Climatic Research Unit) grid data to calculate the spatial distribution of the average annual temperature of 30 years (1971-2000). The annual average temperature decreases with the latitude increasing, and varies from greater than 30 °C to less than -25 °C. In the regions of the same latitudes, the annual average temperature in high altitude areas (such as the Tibetan Plateau, the Mongolian Plateau, and the Western Siberian Mountains) presented the trend of low temperature. At the same time, the annual average temperature trend distribution map of the Northern Hemisphere with a resolution of 0.5 ° × 0.5 ° from 1901 to 2016 was completed.
2019-09-13 View Details
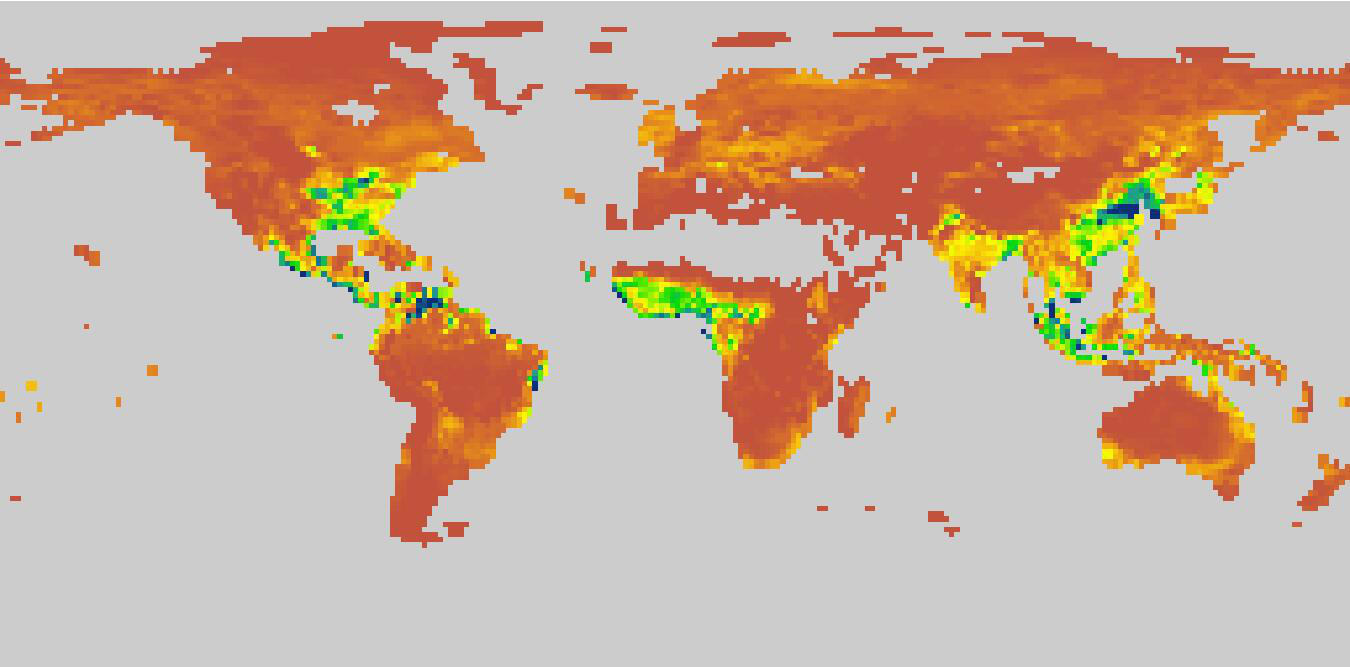
The data set is the global ecosystem respiratory data, including the ecosystem autotrophic respiration (Ra) and heterotrophic respiration (Rh). It was obtained by the CNRM-CM6-1 mode simulation of CMIP6 under the Historical scenario. The time range of the data covers from 1850 to 2014, the time resolution is a month, and the spatial resolution is about 1.406°×1.389°. For the simulated data details, please go to the following link: http://www.umr-cnrm.fr/cmip6/spip.php?article11.
2019-09-13 View Details
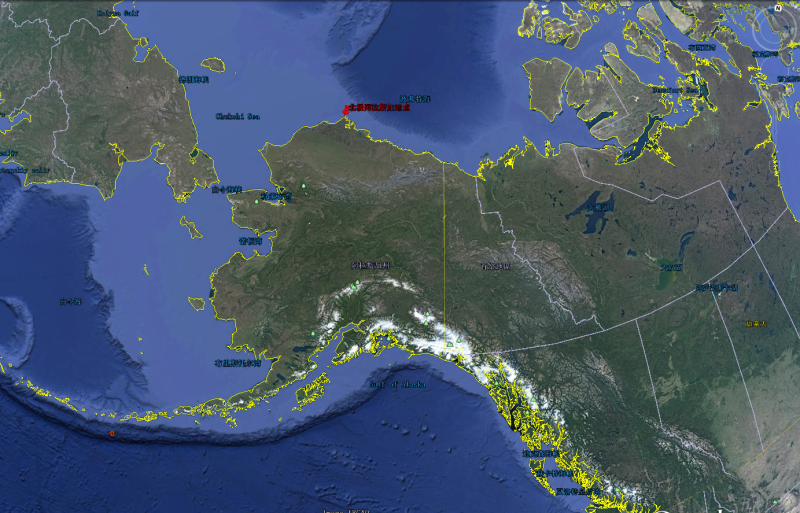
This data set of cloud observations at a site in Arctic Alaska is based on the fusion of five cloud inversion products that are well known worldwide. The temporal coverage of the data is from 1999 to 2009, the temporal resolution is one hour, and there are 512 layers vertically with a vertical resolution of 45 m. The spatial coverage is one site in Arctic Alaska, with latitude and longitude coordinates of 71°19′22.8′′N, 156°36′32.4′′ W. The remote sensing cloud inversion data products include the following official products: the all-phase cloud characteristic products produced by the Atmospheric Radiation Measurement Program of the US Department of Energy adopting a parametric method for remote sensing inversion, the ice cloud and hybrid cloud feature products obtained from the US NOAA researchers Matt Shupe and Dave Turner based on cooperative remote sensing inversion (optimization method + parametric method), the hybrid cloud feature (optimization method) products produced by Zhien Wang of the University of Wyoming, USA, the ice cloud feature (parametric method) products produced by Min Deng of the University of Wyoming, USA, and the cloud optical thickness products produced by Qilong Min of the State University of New York at Albany adopting remote sensing inversion (optimization method). The variables of the remote sensing products include cloud water effective radius, cloud water content, cloud ice effective radius, cloud ice content, cloud optical thickness, and cloud water column content; the corresponding observed inversion error ranges are approximately 10-30%, 30-60%, 10-30%, 30-60%, 10-30% and 10-20%. The data files are in the NC format, and an NC file is stored every month.
2019-09-12 View Details
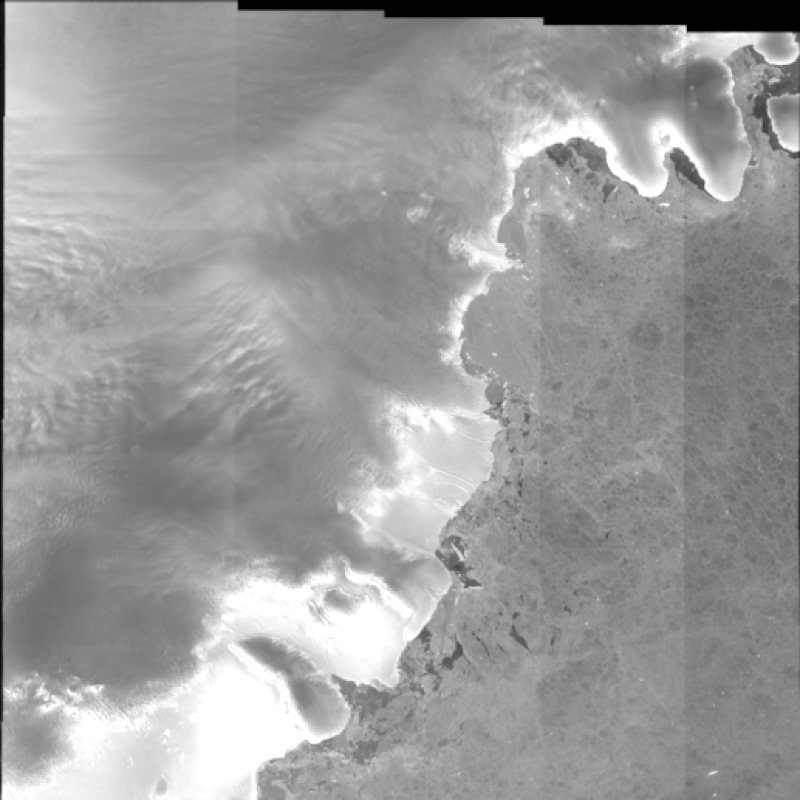
The Sentinel-1A/B satellite uses a near-polar sun-synchronous orbit with an orbital altitude of 693 km, an orbital inclination of 98.18°, and an orbital period of 99 minutes. It is equipped with a C-band Synthetic Aperture Radar (SAR) with a designed service life of 7 years (12 years expected). Sentinel-l has a variety of imaging methods that enable different polarization modes such as single-polarization and dual-polarization. Sentinel-1A SAR has four working modes: Strip Map Mode (SM), Extra Wide Swath (EW), Interferometric Wide Swath (IW) and Wave Mode (WV). Satellite A was successfully launched in April 2014. The revisit period of the same region was 12 days. Satellite B successfully operated on orbit in April 2016. The current revisiting period reached 3 to 6 days. After the operation of two satellites, the S1 data acquisition frequency in the Antarctic region increased greatly. This data set comprises the Sentinel-1 SAR data for the Antarctic ice sheet and the Greenland Ice Sheet area. The data band comprises C-band extra wide multiview data with a resolution of 20 m*40 m. The temporal resolution is 12 days and is related to the round-trip period, the width is 400 km, the noise level is -25 dB, and the radiation measurement accuracy is 1.0 dB. The annual temporal coverage of these data is October to the next March in the Antarctic and April to September in Greenland, and the spatial coverage comprises the Antarctic ice sheet ice shelf area and Greenland ice sheet.
2019-09-12 View Details
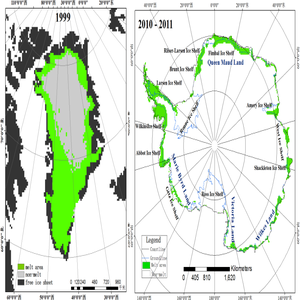
This dataset is the spatial distribution map of the marshes in the source area of the Yellow River near the Zaling Lake-Eling Lake, covering an area of about 21,000 square kilometers. The data set is classified by the Landsat 8 image through an expert decision tree and corrected by manual visual interpretation. The spatial resolution of the image is 30m, using the WGS 1984 UTM projected coordinate system, and the data format is grid format. The image is divided into five types of land, the land type 1 is “water body”, the land type 2 is “high-cover vegetation”, the land type 3 is “naked land”, and the land type 4 is “low-cover vegetation”, and the land type 5 is For "marsh", low-coverage vegetation and high-coverage vegetation are distinguished by vegetation coverage. The threshold is 0.1 to 0.4 for low-cover vegetation and 0.4 to 1 for high-cover vegetation.
2019-09-12 View Details
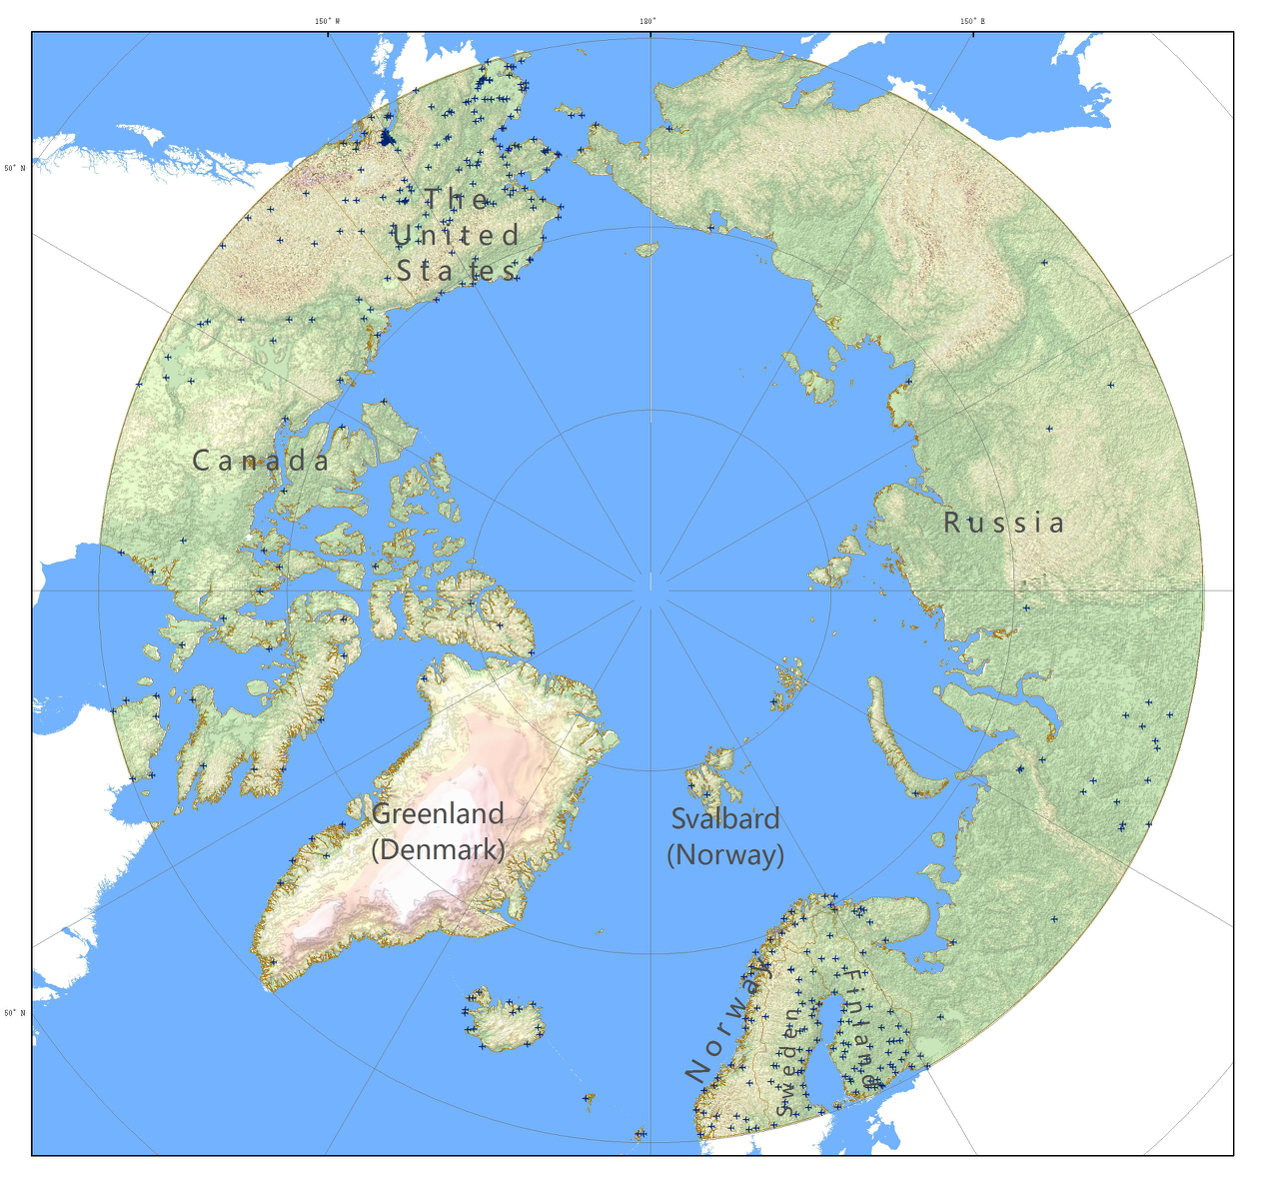
Arctic 1:100,000 airport distribution data set includes vector space data and related attribute data of airports (Arctic_Airport) and airport runway (Arctic_Airport_runways) in the arctic range: airport Name, airport country Name, airport country abbreviation (CNTRY_CODE), LATITUDE and LONGITUDE. The data comes from the 1:100,000 ADC_WorldMap global data set, which is a comprehensive, up-to-date and seamless geographic digital data after the data quality inspection of topology, warehousing and other data. The world map coordinate system is latitude and longitude, WGS84 datum surface, and the arctic data set is the special projection parameter for the arctic (North_Pole_Stereographic).
2019-09-11 View Details
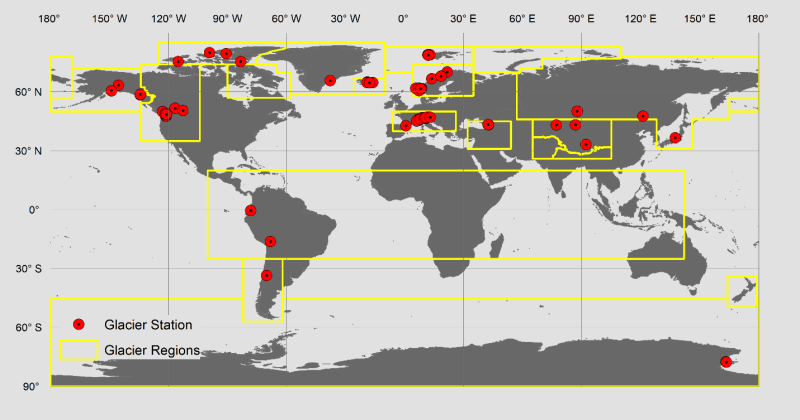
Glacier monitoring mass balance data are the most direct and reliable data for glaciers responding to climate change. The data set of global glacier monitoring mass balance collects information on 76 glaciers and their glacier mass balance data, both with continuous (uninterrupted) observation time series and by collecting and arranging globally accessible mass balance data with a time resolution of one year from 1950 to 2016.
2019-05-30 View Details
Contact Support
Links
National Tibetan Plateau Data CenterFollow Us

A Big Earth Data Platform for Three Poles © 2018-2020 No.05000491 | All Rights Reserved
|  No.11010502040845
Tech Support: westdc.cn