
Brief Introduction:The Tibetan Plateau, known as the " third pole " of the earth, has always been the focus of attention of the international community because it is an important area driving global environmental change research and has a profound regulatory effect on the ecology, environment and climate of the whole earth. Under the background of global warming, the cryosphere elements such as tripolar glaciers, frozen soils, and freeze-thaw lakes have undergone significant changes, with glaciers shrinking rapidly and permafrost active layers thickening. For a long time, China has carried out systematic and multidisciplinary research in the world ' s third pole with the Qinghai-Tibet Plateau as the main body, forming a rich research accumulation.
Publish Datetime:2022-12-13
Number of Datasets:184
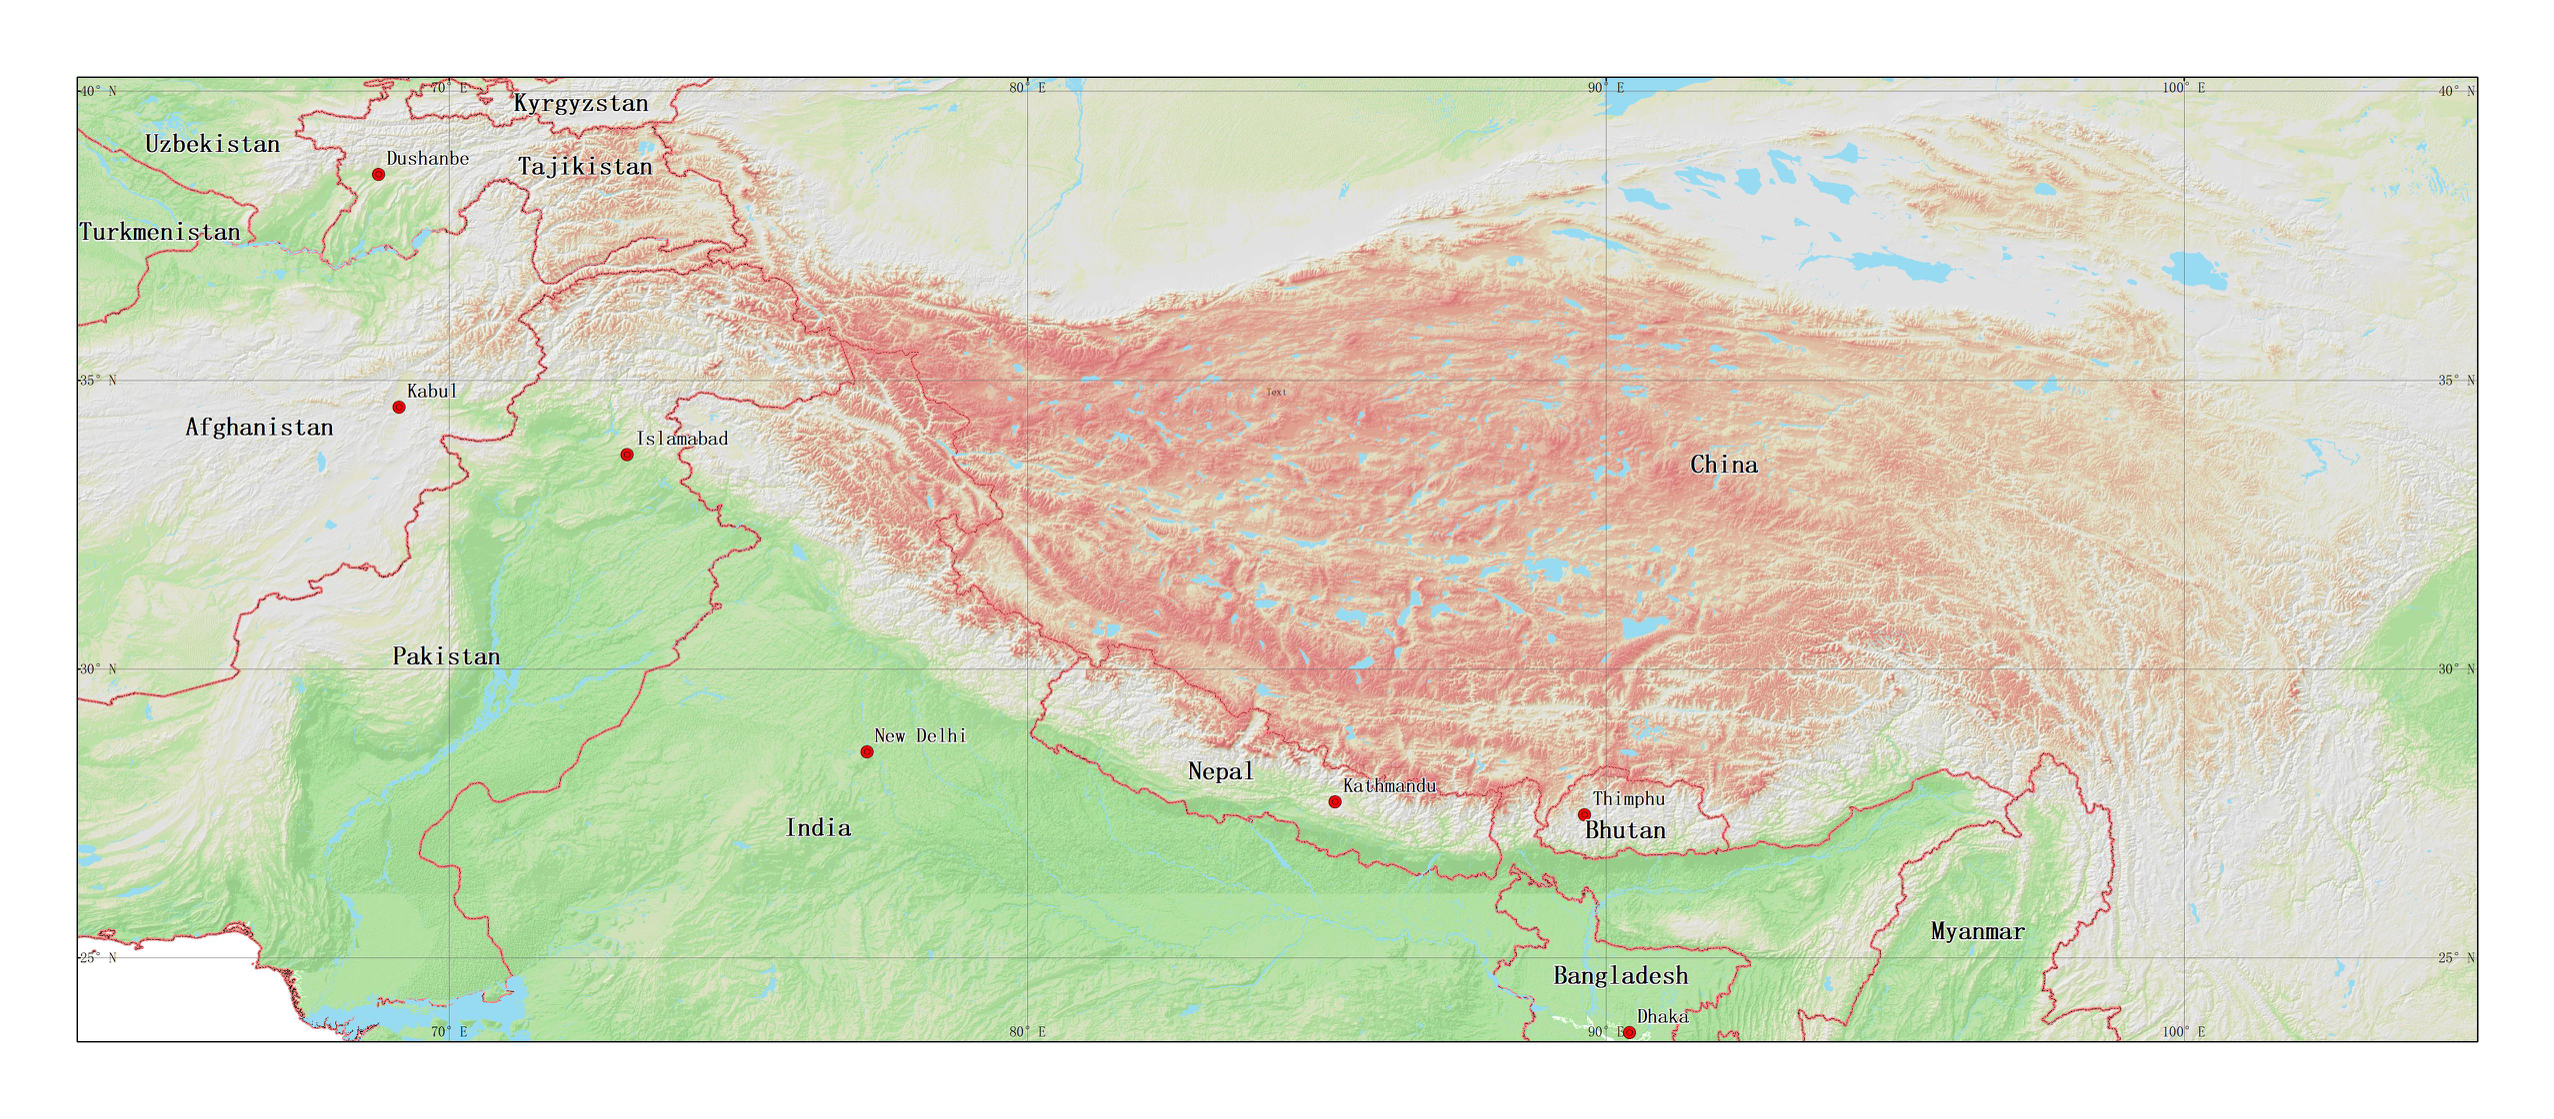
The Third Pole 1:100,000 settlements distribution data set:Settlements(Tibet_Cities)、Capitals(Tibet_Capitals)、Cities up to 75K(Tibet_Cities_up_to_75K)vector space data set and its attribute name:Cities Name(ENG_NAME)、 urban population(CITY_POP) The data comes from the 1:100,000 ADC_WorldMap global data set,The data through topology, warehousing and other data quality inspection,Data through the topology, into the library,It's comprehensive, up-to-date and seamless geodigital data. The world map coordinate system is latitude and longitude, D_WGS_1984 datum surface
2019-11-18 View Details
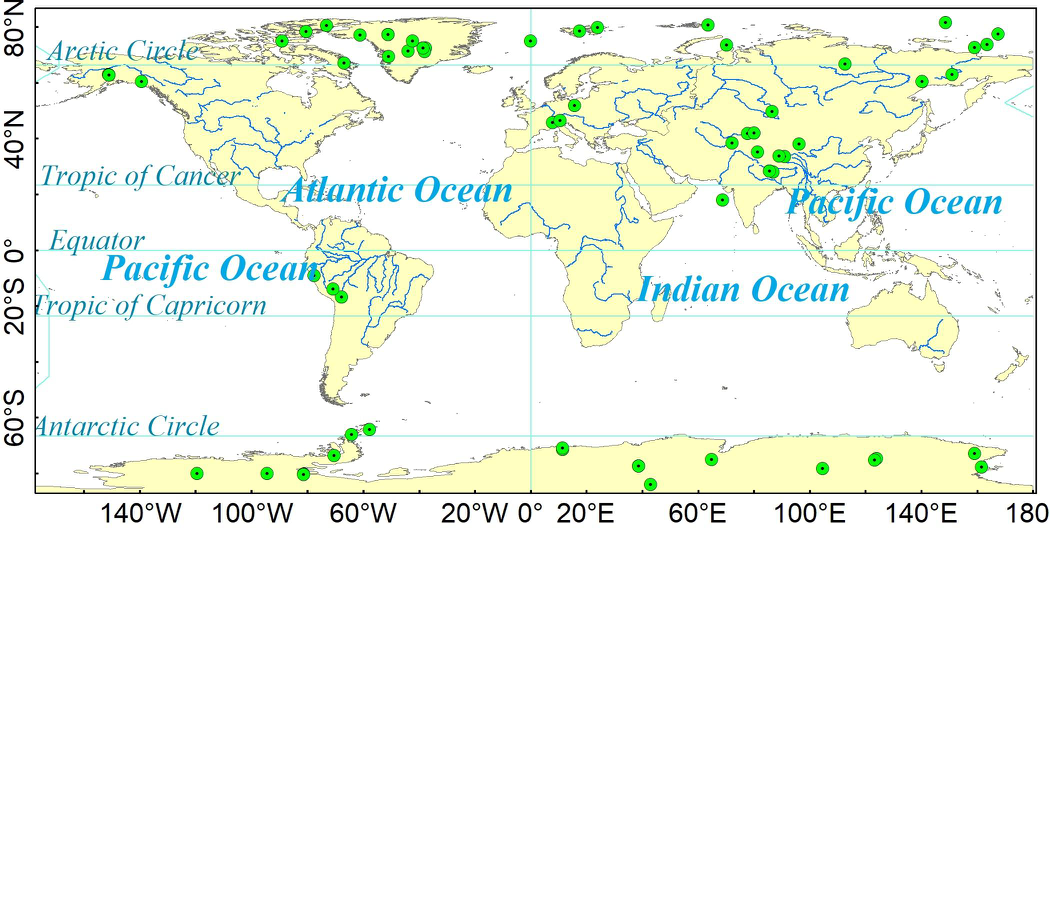
The data of triode ice core mainly comes from NOAA (National Oceanic and Atmospheric Administration, https://www.ncdc.noaa.gov/data-access/paleoclimatology-data/datasets/ice-core). The original data is mainly in text format, which is provided by relevant units and researchers voluntarily. The data mainly includes the original observation data such as oxygen isotope, greenhouse gas concentration, ice core age, etc., as well as the historical temperature, carbon dioxide concentration and methane concentration produced by the researchers according to the observation data. The data are mainly divided into Antarctic, Arctic, Greenland and the third polar region. The database includes drilling address, time, derivative products, corresponding observation site data, references and other elements. Derivative products include product name, type, time and other elements. The space location is divided into the south pole, the north pole and the third pole, including Alaska, Canada, Russia, Greenland and other regions. After sorting and post-processing the collected data, the ice core database is established by using the access database management system of Microsoft office. According to the Antarctic, Arctic, Greenland and the third pole, it is divided into four sub databases. The first table in each database is readme, which contains information and references of each data table.
2019-11-17 View Details

This data set comprises the plateau soil moisture and soil temperature observational data based on the Tibetan Plateau, and it is used to quantify the uncertainty of model products of coarse-resolution satellites, soil moisture and soil temperature. The observation data of soil temperature and moisture on the Tibetan Plateau (Tibet-Obs) are from in situ reference networks at four regional scales, which are the Nagqu network of cold and semiarid climate, the Maqu network of cold and humid climate, and the Ali network of cold and arid climate,and Pali network. These networks provided representative coverage of different climates and surface hydrometeorological conditions on the Tibetan Plateau. - Temporal resolution: 1hour - Spatial resolution: point measurement - Measurement accuracy: soil moisture, 0.00001; soil temperature, 0.1 °C; data set size: soil moisture and temperature measurements at nominal depths of 5, 10, 20, 40 - Unit: soil moisture, cm ^ 3 cm ^ -3; soil temperature, °C
2019-11-14 View Details
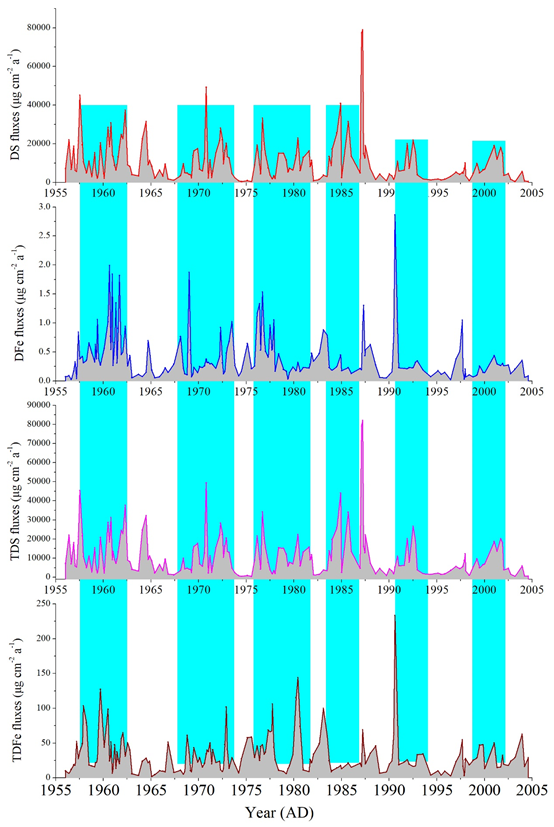
This project is based on the data of bioactive elements such as Fe in miaergou ice core (94 ° 19 ′ e, 43 ° 03 ′ n, 4518 m) of the East Tianshan Mountains, and rebuilt the metal element history of 1956-2004. Data content: 1956-2004 ice core metal elements (including Fe, CD, Pb, as, Ba, Al, s, Mn, CO and Ni); data source, through ICP-MS test; data quality: blank sample is significantly lower than sample value, with better quality; data application results and prospects: data has been published, see Du, Z., Xiao, C., Zhang, W., Handley, M. J., mayewski, P. A., Liu, Y., & Li, X. (20. 19). Iron record associated with sandstorms in a central Asian shallow ice core spanning 1956-2004. Atmospheric environment, 203, 121-130. It can provide comparative study of other ice cores in Central Asia.
2019-10-26 View Details
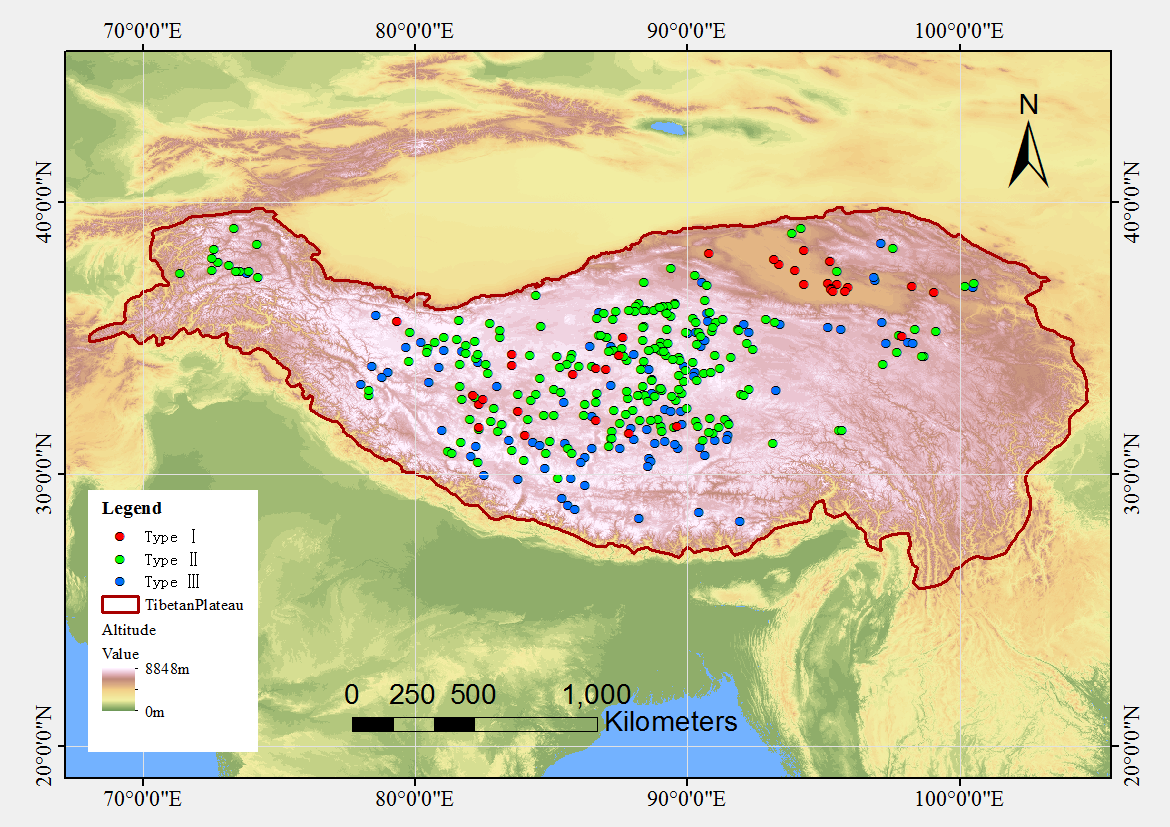
There are many lakes on the Tibetan Plateau. The phenology and duration of lake ice age in this area is very sensitive to regional and global climate change, so it is used as a key indicator of climate change research, especially the comparative study of environmental changes in the Earth's three poles. However, due to its harsh natural environment and sparse population, it lacked routine field measurements of lake ice phenology. Using the Moderate-resolution Imaging Spectroradiometer (MODIS) to normalize the Different Snow Index (NDSI) data, the lake ice was monitored at a resolution of 500 meters to fill the observation gap. The traditional snow map algorithm was used to detect the daily ice volume and coverage extent of lakes under sunny condition. The spatial and temporal continuity of lake surface conditions was applied to re-determine the daily ice volume and coverage extent of lakes under cloud cover condition through a series of steps. Time series analysis was performed on 308 lakes larger than 3 k㎡ to determine effective record of lake ice extent and coverage, then to form a daily lake ice extent and coverage data set. And furthermore, four lake ice phenological parameters: freeze-up start ( FUS), freeze-up end (FUE), break-up start (BUS), and break-up end (BUE) can be obtained from 216 lakes of the data set, and two parameters: FUS and BUE can be obtained from the other 92 lakes.
2019-10-21 View Details
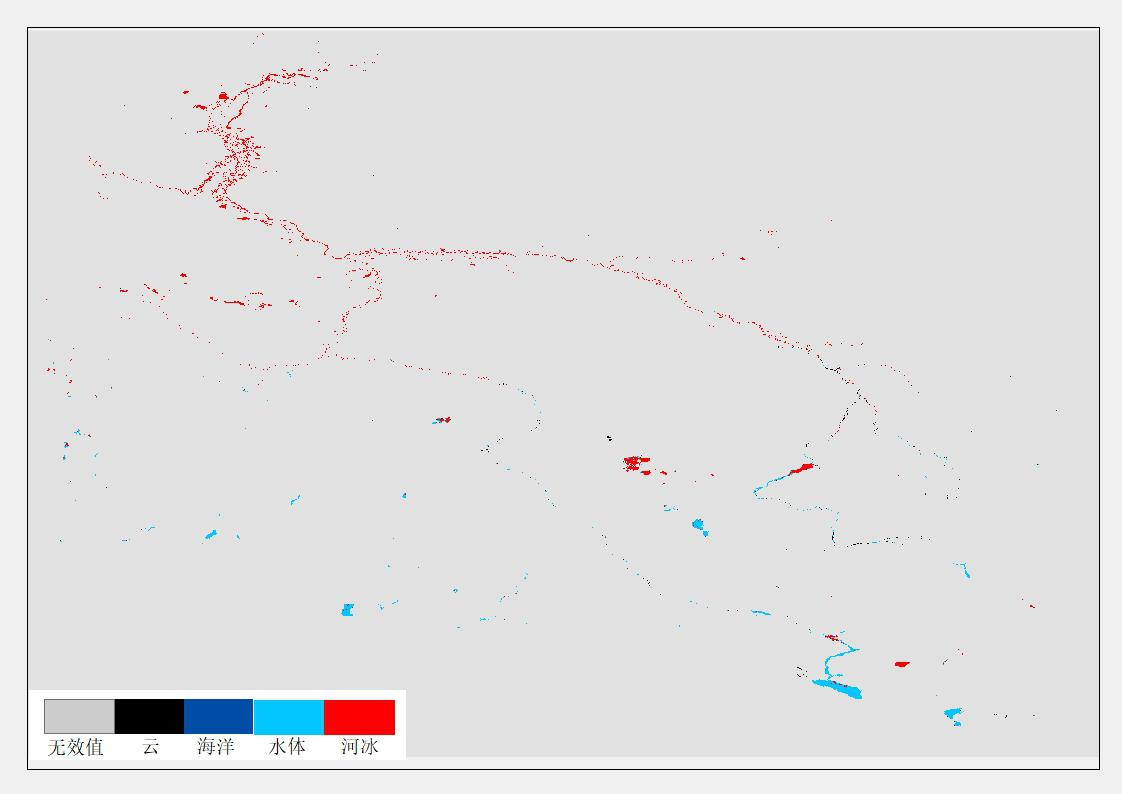
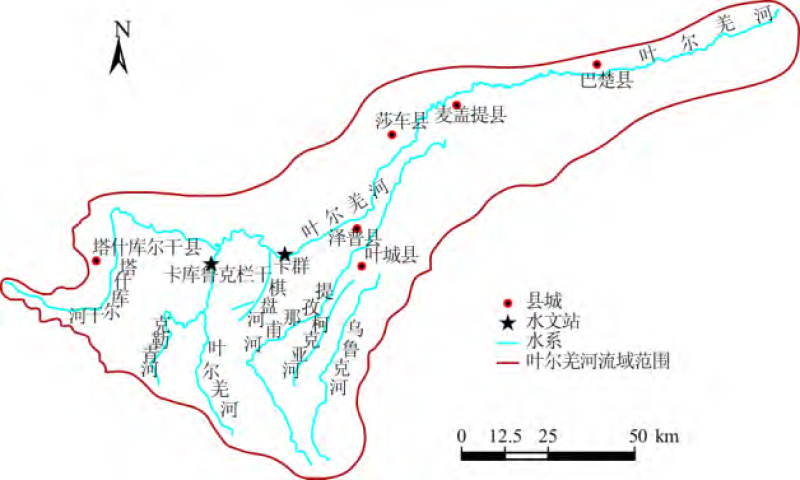
River ice is the main component of the cryosphere, and the freezing of rivers in the polar region has a significant impact on the Arctic shipping and transportation industry. With the construction of "ice silk road" between China and Russia, monitoring the change of river ice in Erqis river basin can provide theoretical basis for river navigation. The sparse distribution of hydrological stations in the Arctic limits the study of river ice. The limited available data of hydrological stations show that the trend of river ice rupture is ahead of schedule, but the specific climate mechanism driving this trend is very complex. Therefore, optical data with high temporal resolution (such as MODIS products) are suitable for monitoring river ice phenology and mapping river ice cover range, which is helpful to understand the process of river ice rupture. Based on MODIS and passive microwave data, a method of monitoring river ice in Erqis River Basin by using different remote sensing data is realized in this study, in order to analyze the phenological parameters of river ice such as the time of river closure, the time of river closure, the speed of river opening, the speed of river closure and the duration of freezing period. At the same time, it is helpful to understand the response of river ice breaking process to Arctic climate warming.
2019-10-21 View Details
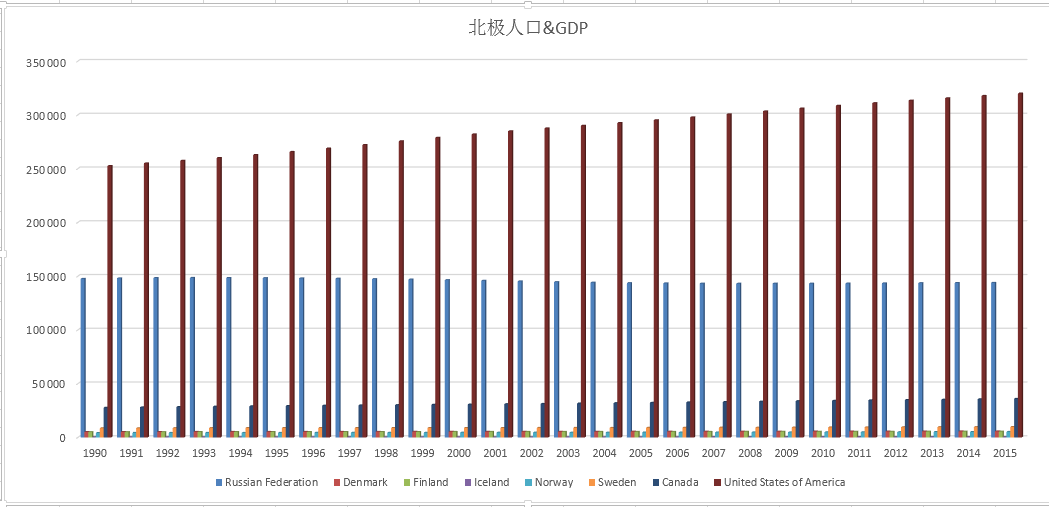
The data set includes: population and GDP data of the arctic (1990-2015) and county-level population and GDP data of the third pole region (gansu, qinghai and Tibet) (1970-2016). Socio-economic statistical attributes include: population (ten thousand), GDP (ten thousand yuan), total industrial and agricultural output (ten thousand yuan), total agricultural output (ten thousand yuan), and total industrial output (ten thousand yuan). The arctic population data are mainly derived from the world populationProspects: 2017 revision by the Department of economic and social affairs, which divides the total population by region and country. The data of the third pole mainly refer to the statistical yearbook of gansu province, qinghai province and Tibet autonomous region.County records of gansu, qinghai and Tibet autonomous regions.
2019-09-29 View Details
The Map of Permafrost on the Qinghai-Tibet Plateau (1:3,000,000) (Shude Li and Guodong Cheng, 1996) was made by the State Key Laboratory of Frozen Soil Engineering, LIGG, CAS (currently called the Cold and Arid Regions Environmental and Engineering Research Institute, Chinese Academy of Sciences). It was based on first-hand information from the study of frozen soil and previous research papers and literature. By detailed study and consultation of aerial photographs, satellite images, the Permafrost Map along the Qinghai-Tibet Highway (1:600,000) (Boliang Tong, et al., 1983), Geomorphological Map of the Qilian Mountains (1:1,000,000) (Institute of Geographic Sciences and Natural Resources Research, Chinese Academy of Sciences, 1985), Natural Landscape Map of Qinghai-Tibetan Plateau (1:3,000,000) (Institute of Geographic Sciences and Natural Resources Research, Chinese Academy of Sciences, 1990), Quaternary Glacial Distribution Map of the Qinghai-Tibetan Plateau (1:3,000,000) (Bingyuan Li and Jijun Li, 1991), Frozen Soil Remote Sensing Map of the Western Channel Project of the South-North Water Diversion in the Region of the Tongtian-Yalong Rivers (1:500,000) (Lanzhou Institute of Glaciology and Cryopedology, Chinese Academy of Sciences, 1995), and Map of Snow, Ice, Frozen Ground in China (1:4,000,000) (Yafeng Shi and Desheng Mi, 1988), with editing on 1,000,000 aerial survey topographic maps, and the 1:3,000,000 Map of Permafrost on the Qinghai-Tibetan Plateau was then generated. It was later digitized by Zhuotong Nan of the Cold and Arid Regions Environmental and Engineering Research Institute, Chinese Academy of Sciences. The data include: 1) Digitized distribution map of frozen soil on the Qinghai-Tibetan Plateau 2) Scanned map of frozen soil map on the Qinghai-Tibetan Plateau The types of frozen soil in the digitized frozen soil map include: 0. Seasonally frozen ground; seasonal frozen soil 1. Permafrost 2. Island permafrost; 3. Continuous permafrost;
2019-09-15 View Details
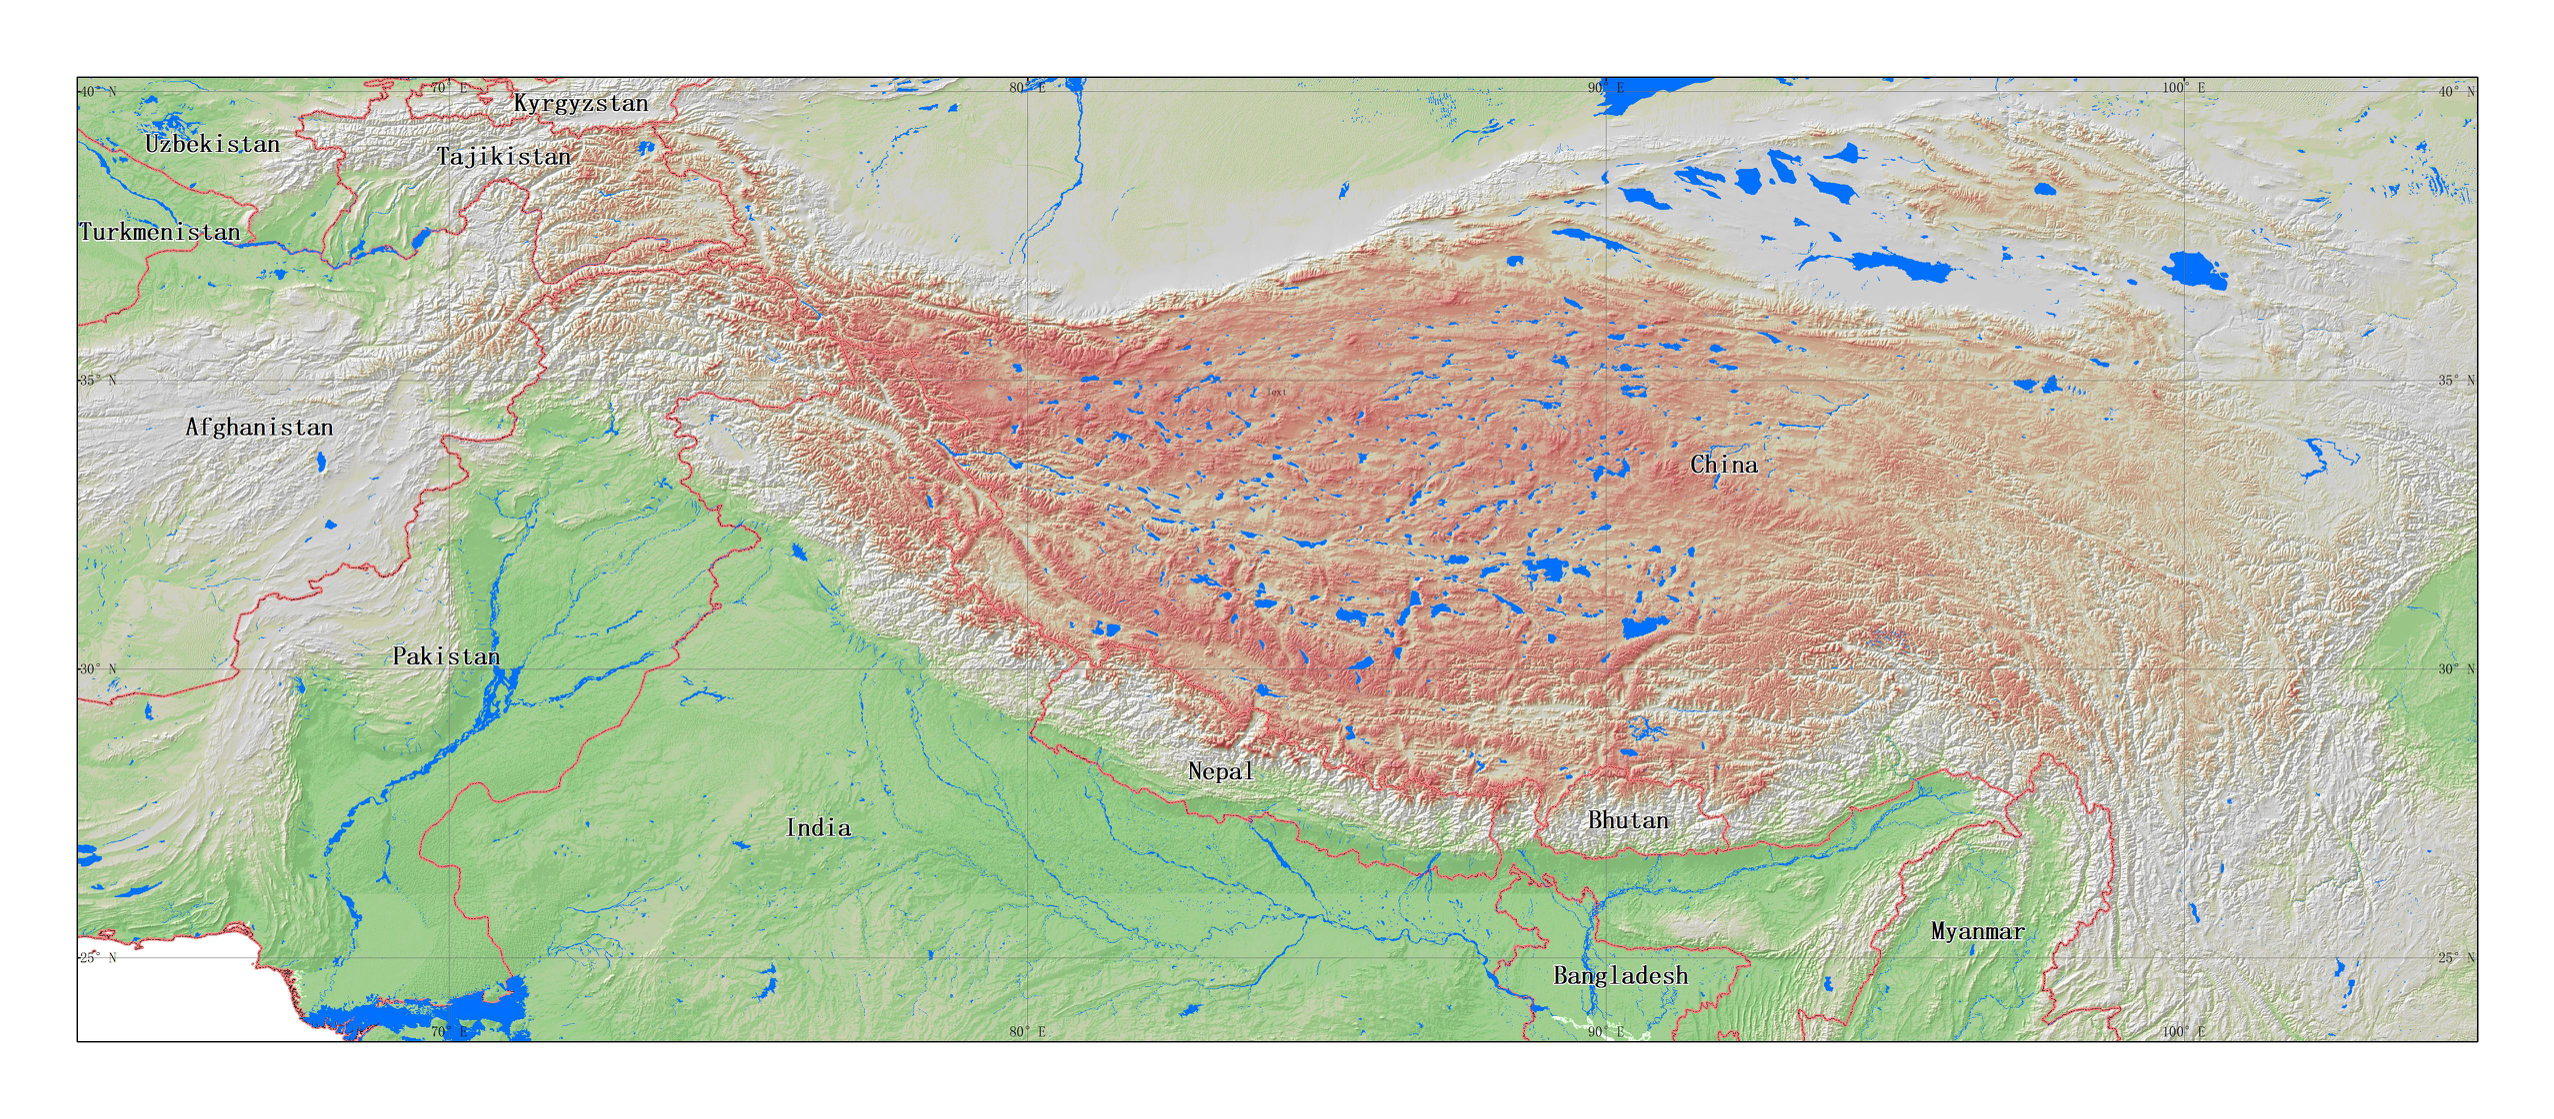
The third pole 1:100,000 Water data set includes:Different grades of river lines(Tibet_River)、Polygonal drainage pattern(Tibet_Water_poly)vector space data set and its attribute name:Name(name)、Type(Type)、water leng(leng)、water area(Area). The data comes from the 1:100,000 ADC_WorldMap global data set,The data through topology, warehousing and other data quality inspection,Data through the topology, into the library,It's comprehensive, up-to-date and seamless geodigital data. The world map coordinate system is latitude and longitude, D_WGS_1984 datum surface
2019-09-15 View Details

Snow duration on the Tibetan Plateau changes relatively quickly, and the mountainous areas around the plateau are characterized by abundant snow and ice resources and active atmospheric convection. Optical remote sensing is often affected by clouds. Snow cover monitoring needs to consider the cloud-removal problem on a daily time scale. Taking full account of the terrain of the Tibetan Plateau and the characteristics of snow on the mountains, this data set adopted a combination of various cloud-removing processes and steps to gradually remove the daily snow cover by maintaining the cloud-classify accuracy of the snow cover. In addition, a step-by-step comprehensive classification algorithm was formed, and the “MODIS daily cloud-free snow cover product over the Tibetan Plateau (2002-2015)” was completed. Two snow seasons from October 1, 2009, to April 30, 2011, were selected as test data for algorithm research and accuracy verification, and the snow depth data provided by 145 ground stations in the study area were used as a ground reference. The results showed that in the plateau region, when the snow depth exceeds 3 cm, the total classification accuracy of the cloud-free snow cover products is 96.6%, and the snow cover classification accuracy is 89.0%. The whole algorithm procedure, based on WGS84 projected MODIS snow products (MOD10A1 and MYD10A1) with medium resolution, results in a small loss of cloud-removal accuracy, which made the data highly reliable.
2019-09-15 View Details
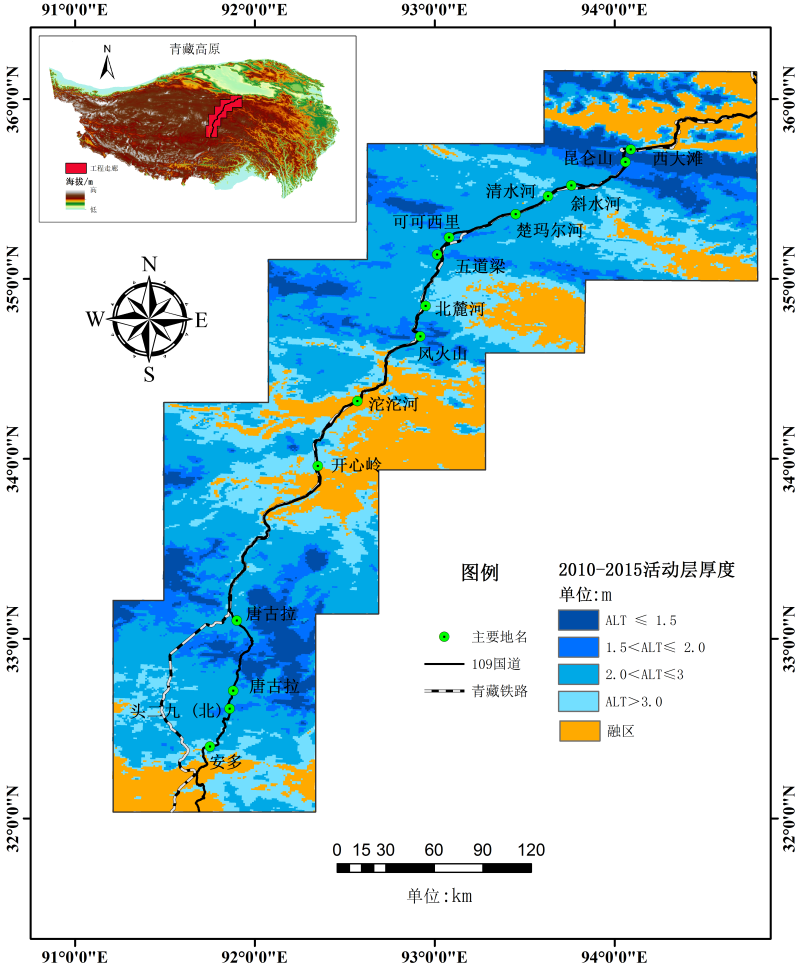
Based on the existing natural hole data of 15 active layer depth monitoring sites in the Qinghai-Tibet Engineering Corridor, the active layer depth distribution map of the Qinghai-Tibet Engineering Corridor was simulated using the GIPL2.0 frozen soil model. The model required synthesis of a temperature data set of time series. The temperature data were divided into two phases according to the time spans, which were 1980-2009 and 2010-2015. The data of the first phase were from the Chinese meteorological driving data set (http://dam. Itpcas.ac.cn/rs/?q=data#CMFD_0.1), and the data of the second phase was the application of MODIS surface temperature products (MOD11A1/A2 and MYD11A1/A2) with a spatial resolution of 1 km. In addition, the soil type data required by the model came from the China Soil Database (V1.1) and have a resolution of 1 km. At the same time, the topography was also considered. The research area was classified into 88 types based on the measured soil thermophysical parameters and land cover types, and then the simulation was performed. The simulation results were compared with the field measured data. The results showed that they were highly consistent, and the correlation coefficient reached 0.75. In alpine areas, the average depth of the active layer is below 2.0 m. However, in the river valleys, the average depth of the active layer is above 4.0 m. In the high plain area, the depth of the active layer is usually between 3.0 m and 4.0 m.
2019-09-15 View Details
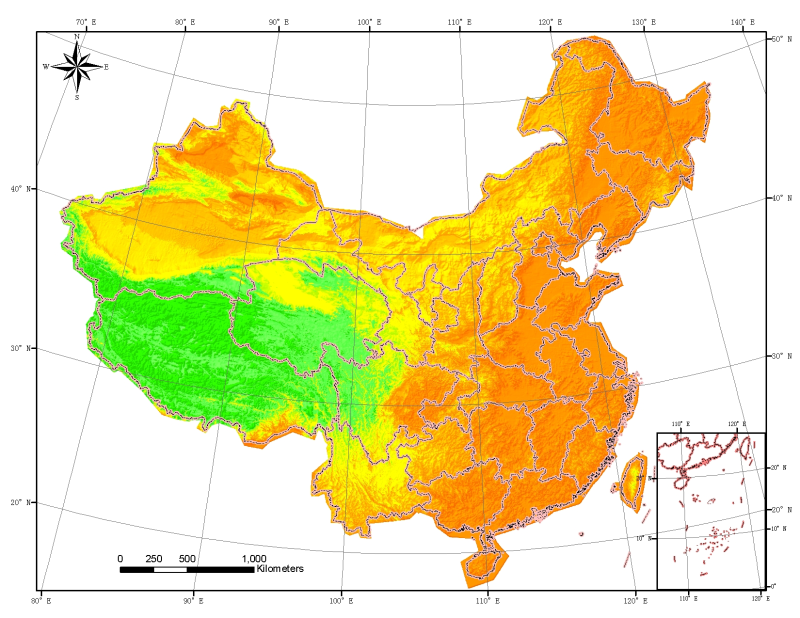
DEM is the English abbreviation of Digital Elevation Model, which is the important original data of watershed topography and feature recognition.DEM is based on the principle that the watershed is divided into cells of m rows and n columns, the average elevation of each quadrilateral is calculated, and then the elevation is stored in a two-dimensional matrix.Since DEM data can reflect local topographic features with a certain resolution, a large amount of surface morphology information can be extracted through DEM, which includes slope, slope direction and relationship between cells of watershed grid cells, etc..At the same time, the surface flow path, river network and watershed boundary can be determined according to certain algorithm.Therefore, to extract watershed features from DEM, a good watershed structure pattern is the premise and key of the design algorithm. Elevation data map 1km data formed according to 1:250,000 contour lines and elevation points in China, including DEM, hillshade, Slope and Aspect maps. Data set projection: Two projection methods: Equal Area projection Albers Conical Equal Area (105, 25, 47) Geodetic coordinates WGS84 coordinate system
2019-09-15 View Details
Taking 2005 as the base year, the future population scenario prediction adopted the Logistic model of population; not only is it better able to describe the change pattern of population and biomass, but it is also widely applied in the economic field. The urbanization rate was predicted using the urbanization Logistic model. Based on the existing urbanization horizontal sequence value, the prediction model was established by acquiring the parameters in the parametric equation applying nonlinear regression. The urban population was calculated by multiplying the predicted population by the urbanization rate. The Logistic model was used to predict the future gross national product of each county (or city), and then according to the economic development level of each county (or city) in each period (in terms of real GDP per capita), the corresponding industrial structure scenarios in each period were set, and the output value of each industry was predicted. The trend of changing industrial structure in China and the research area lagged behind the growth of GDP and was therefore adjusted according to the need of the future industrial structure scenarios of the research area.
2019-09-15 View Details
In the mid-latitude region of Asia, the southeastern region is humid and affected by monsoon circulation (thus, it is referred to as the monsoon region), and the inland region is arid and controlled by the other circulation patterns (these areas include the cold and arid regions in the northern Tibetan Plateau, referred to as the westerly region). Based on the generalization of the climate change records published in recent years, the westerly region was humid in the mid-late Holocene, which was significantly different from the pattern of the Asian monsoon in the early-middle Holocene. In the past few millennia, the westerly region was arid during the Medieval Warm Period but relatively humid during the Little Ice Age. In contrast, the oxygen isotope records derived from a stalagmite in the Wanxiang Karst Cave showed that the monsoon precipitation was high in the Medieval Warm Period and low during the Little Ice Age. In the last century, especially in the last 50 years, the humidity of the arid regions in the northwest has increased, while the eastern areas of northwestern and northern China affected by the monsoon have become more arid. Moreover, in the northern and southern parts of the Tibetan Plateau, which are affected by the westerlies and the monsoon, respectively, the precipitation changes on the interdecadal and century scales have also shown an inverse phase. Based on these findings, we propose that the control zone of the westerly belt in central Asia has different humidity (precipitation) variation patterns than the monsoon region on every time scale (from millennial to interdecadal) in the modern interglacial period. The integrated research project on Holocene climate change in the arid and semi-arid regions of western China was a major research component of the project Environmental and Ecological Science for West China, which was funded by the National Natural Science Foundation of China. The leading executive of the project was Professor Fahu Chen from Lanzhou University. The project ran from January 2006 to December 2009. The data collected by the project include the following: 1. The integrate humidity data over the Holocene in the arid regions of Central-East Asia and 12 lakes (11000-0 cal yr BP): including Lake Van, Aral Sea, Issyk-Kul, Ulunguhai Lake, Bosten Lake, Barkol Lake, Bayan Nuur, Telmen Lake, Hovsgol Nuur, Juyan Lake, Gun Nuur and Hulun Nuur. 2. The integrated humidity data over the past millennium in the arid regions of Central-East Asia and at five research sites (1000-2000): including Aral Sea, Guliya, Bosten Lake, Sugan Lake, and the Badain Juran desert. Data format: excel table.
2019-09-15 View Details
This dataset is the snow cover dataset based on the MODIS fractional snow cover mapping algorithm Coupled Regional Approach (CRA). The CRA algorithm mainly consists of three parts. (1) First, the N-FINDR (Volume Iterative Approach) and OSP (Orthogonal Subspace Projection) are used to automatically extract the endmember according to the settings (extracting 30 end endmembers). (2) On the basis of automatic extraction, combined with the IGBG land cover type map, six types of endmembers of snow, vegetation, cloud, soil, rock and water are selected by the manual screening method, and an annual spectrum database is established according to the 2009 image. There are 3 spectra in the early, middle and late months and 36 spectra a year. (3) The established spectral database is used as a priori knowledge, and based on prior knowledge, the fully constrained linear unmixing method (FCLS) for subpixel decomposition is used to obtain the fractional snow cover products. The NDSI ratio algorithm with improved topographic effect is used to obtain the snow cover area, the spatiotemporal data are then interpolated, and, finally, the multisource data fusion with the AMSR-E microwave snow depth product is undertaken. The dataset adopts a latitude and longitude (Geographic) projection method. The datum is WGS84, and the spatial resolution is 0.005°. It provides the daily cloudless snow cover area map of the Tibetan Plateau from 2008 to 2010. The data set is stored by year and consists of 3 folders from 2008 to 2010. Each folder contains the classification results of the daily snow cover of the current year. It is a tif file with the naming rule YYYY***.tif, in which YYYY represents the year (2008-2010), and *** represents the day (001~365/ 366). It can be opened directly with ARCGIS or ENVI.
2019-09-15 View Details
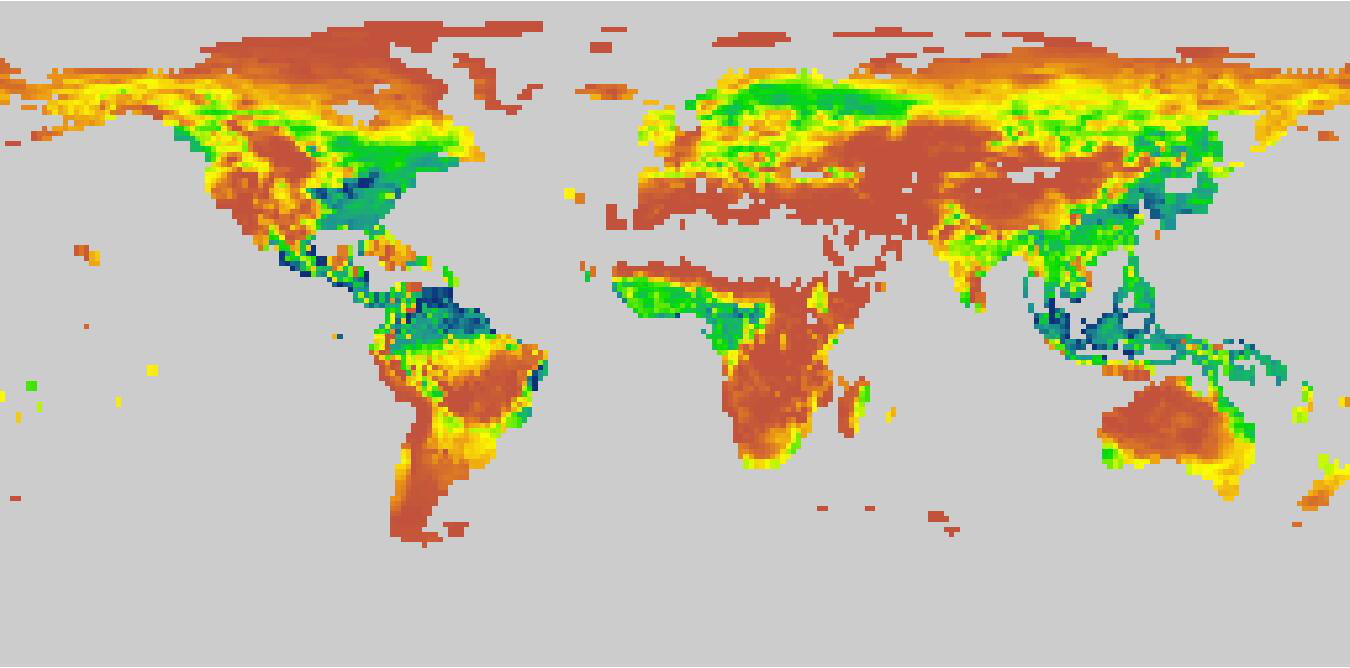
The data set is the global vegetation productivity data, including Gross Primary Productivity(GPP) and Net Primary Productivity (NPP). It was obtained by the CNRM-CM6-1 mode simulation of CMIP6 under the Historical scenario. The time range of the data covers from 1850 to 2014, the time resolution is a month, and the spatial resolution is about 1.406°×1.389°. For the simulated data details, please go to the following link: http://www.umr-cnrm.fr/cmip6/spip.php?article11.
2019-09-15 View Details
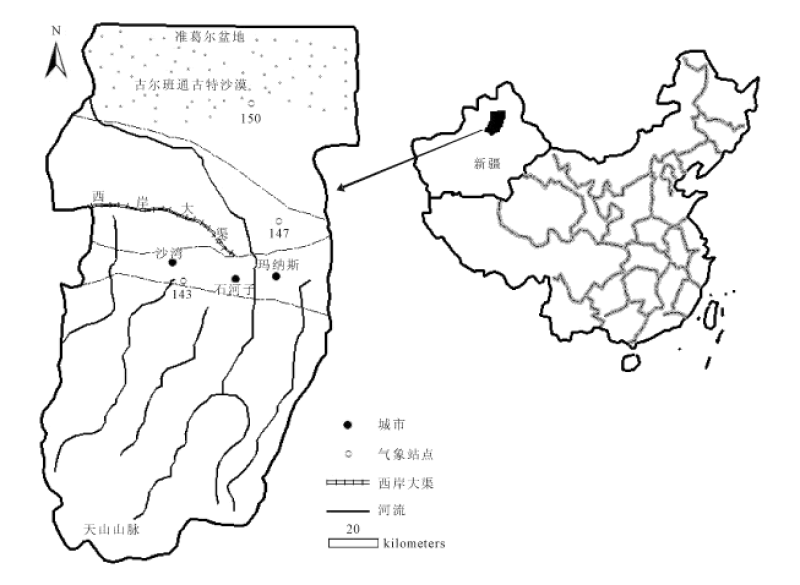
Taking 2005 as the base year, the future population scenario was predicted by adopting the Logistic model of population. It not only can better describe the change pattern of population and biomass but is also widely applied in the economic field. The urbanization rate was predicted by using the urbanization Logistic model. Based on the existing urbanization horizontal sequence value, the prediction model was established by acquiring the parameters in the parametric equation by nonlinear regression. The urban population was calculated by multiplying the predicted population by the urbanization rate. The data adopted the non-agricultural population. The Logistic model was used to predict the future gross national product of each county (or city), and then, according to the economic development level of each county (or city) in each period (in terms of GDP per capita),the corresponding industrial structure scenarios in each period were set, and the output value of each industry was predicted. The trend of changes in industrial structure in China and the research area lagged behind the growth of GDP and was therefore adjusted according to the need of the future industrial structure scenarios of the research area.
2019-09-15 View Details
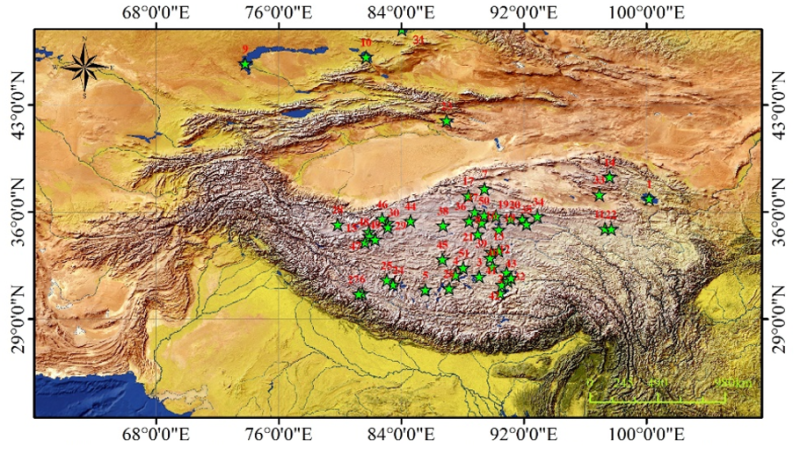
The High Asia region is an area sensitive to global changes in mid-latitude regions and is a hotspot for research. The lakes in the territory are scattered, and the lake freeze-thaw process is one of the key factors sensitive to global change. Due to the large difference in the dielectric constant between ice and water, satellite-borne passive microwave remote sensing is weather insensitive and has a high revisiting rate; thus, it can achieve rapid monitoring of the freeze-thaw state of lakes. According to the area ratio of the lake and the land surface in the sub-pixels of passive microwave radiometer data, this data set represents the lake brightness temperature information of the pixel (sub-pixel level) by applying the hybrid pixel decomposition method in order to monitor the lake freeze-thaw process in the High Asia region. Thus, by adopting a variety of passive microwave data, time series of lake brightness temperature and freeze-thaw status were obtained for a total of 51 medium to large lakes from 2002 to 2016 in the High Asia region. Using cloudless MODIS optical products as validation data, three lakes of different sizes in different regions of High Asia, i.e., Hoh Xil Lake, Dagze Co Lake, and Kusai Lake, were selected for freeze-thaw detection validation. The results indicated that the lake freeze-thaw parameters obtained by microwave and optical remote sensing were highly consistent, and the correlation coefficients reached 0.968 and 0.987. This data set contained the time series brightness temperature of lakes and the freeze-thaw parameters of lake ice, which could be used to further invert the characteristic parameters of lakes and enhance the understanding of lake ice freezing and thawing in the High Asia region. This database will be useful in the assessment of climatic and environmental changes in the High Asia region and in global climatic change response models. The data set consists of two parts: the passive microwave remote sensing brightness temperature data set of 51 lakes in the High Asia region from 2002 to 2016, with an observation interval of 1 to 2 days, and the lake ice freeze-thaw data set obtained by estimation of the lake brightness temperature. The files are the lake brightness temperature data via the nearest neighbour method and pixel decomposition in the form of a .zip file (12 MB) and the lake freeze-thaw data set for 51 lakes in the High Asia region from 2002 to 2016 in the form of an .xls file (0.1 MB).
2019-09-15 View Details
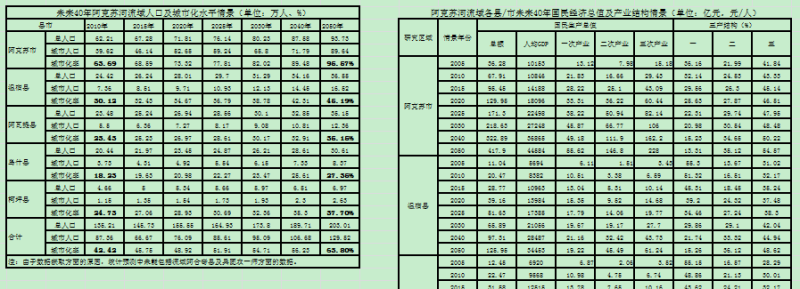
Taking 2005 as the base year, the future population scenario was predicted by adopting the logistic model of population. This model not only effectively describes the pattern of changes in population and biomass but is also widely applied in the field of economics. The urbanization rate was predicted using the urbanization logistic model. Based on the observed horizontal pattern of urbanization, a predictive model was established by determining the parameters in the parametric equation by applying nonlinear regression. The urban population was calculated by multiplying the predicted population by the urbanization rate. The data represent the non-agricultural population. The logistic model was used to predict the future gross domestic product of each county (or city), and then the economic development level of each county (or city) in each period (in terms of GDP per capita). The corresponding industrial structure scenarios in each period were set, and the output value of each industry was predicted. The trend of industrial structure changes in China and the research area lagged behind the growth in GDP, so the changes were adjusted according to the need for future industrial structure scenarios in the research area.
2019-09-15 View Details
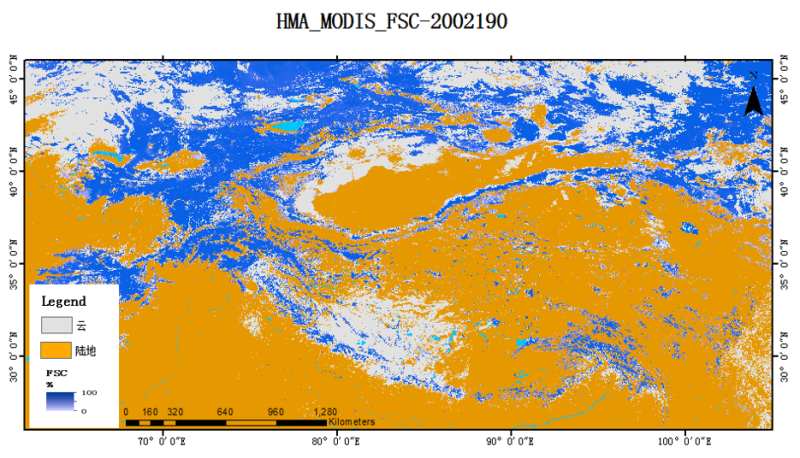
Due to the short snow duration and thin snow layer on the Tibetan Plateau, dynamic monitoring data for daily fractional snow cover are urgently needed in order to better understand water cycling and other processes. This data set is based on MODIS Snow Cover Daily L3 Global 500 m Grid data and includes the Normalized Difference Snow Index (NDSI) data product generated from MODIS/Terra data (MOD10A1) and MODIS/Aqua data (MYD10A1). The data are in the .hdf format. The projection method is sinusoidal map projection. Combining the advantages of 90 m SRTM terrain data and fractional snow cover estimation algorithms under multiple cloud coverage types, the fractional snow cover under different cloud coverage conditions can be re-estimated to meet the production requirements of the daily less cloud (< 10%) data products in High Asia. On the basis of this method, the MODIS daily fractional snow cover data set over High Asia (2002-2016) was constructed. By taking the binary snow product under cloudless conditions as a reference, the spatial and temporal comparisons between snow distribution and snow coverage show that the spatio-temporal characteristics of the product and the binary products are highly consistent. Taking the winter of 2013 as an example, when the fractional snow cover is greater than 50%, the correlation can reach 0.8628. This data set provides daily fractional snow cover data for use in studying snow dynamics, the climate and environment, hydrology, energy balance, and disaster assessment in High Asia.
2019-09-15 View Details
Contact Support
Links
National Tibetan Plateau Data CenterFollow Us

A Big Earth Data Platform for Three Poles © 2018-2020 No.05000491 | All Rights Reserved
|  No.11010502040845
Tech Support: westdc.cn