
Brief Introduction:The Tibetan Plateau, known as the " third pole " of the earth, has always been the focus of attention of the international community because it is an important area driving global environmental change research and has a profound regulatory effect on the ecology, environment and climate of the whole earth. Under the background of global warming, the cryosphere elements such as tripolar glaciers, frozen soils, and freeze-thaw lakes have undergone significant changes, with glaciers shrinking rapidly and permafrost active layers thickening. For a long time, China has carried out systematic and multidisciplinary research in the world ' s third pole with the Qinghai-Tibet Plateau as the main body, forming a rich research accumulation.
Publish Datetime:2022-12-13
Number of Datasets:184
As the third pole of the Earth, the Tibetan Plateau has a significant impact on regional and global weather and climate as a heat source in spring and summer. In order to explore the temporal and spatial variation characteristics of multi-scale thermal forcing in different time on the plateau, it is necessary to establish a set of plateau heat source (collection) data based on observation data of continuous and reliable long-term observation. Based on the meteorological elements (surface temperature, surface air temperature, wind speed at the height of 10m, daily cumulative precipitation, etc.) of the 80 (32) observation stations on the Tibetan Plateau from 1979 to 2016 (1960-2016) of China Meteorological Bureau, the sensible heat(SH) and latent heat(LH) was calculated. Meanwhile, using satellite data processing to obtain the net radiation flux (RC) from 1984 to 2015 on the plateau, and then a set of quality controlled long-term plateau heat source data was obtained. This data set considers the diurnal variation of the overall heat transfer coefficient when calculating the surface sensible heat flux.
2020-10-12 View Details
Original information on the long-term dry-wet index (1500-2000) in western China is obtained by integrating data on dry-wet/drought-flood conditions and precipitation amounts in the western region published over more than a decade. The integrated data sets include tree rings, ice cores, lake sediments, historical materials, etc., and there are more than 50 such data sets. In addition to widely collecting representative data sets on dry-wet changes in the western region, this study also clarifies the main characteristics of the dry-wet changes and climate zones in the western region, and the long-term dry-wet index sequence was generated by extracting representative data from different zones. The data-based dry-wet index sequence has a 10-year temporal resolution for five major characteristic climate zones in the western region over nearly four hundred years and a high resolution (annual resolution) for three regions over the past five hundred years. The five major characteristic climate zones in the western region with a 10-year dry-wet index resolution over the last four hundred years are the arid regions, plateau bodies, northern Xinjiang, Hetao region, and northeastern plateau, and the three regions with a annual resolution over the last five hundred years are the northeastern plateau, Hetao region, and northern Xinjiang. For a detailed description of the data, please refer to the data file named Introduction of Dry-Wet Index Sequence Data for West China.doc.
2020-10-09 View Details
These data are digitized for the Geocryological Regionalization and Classification Map of the Frozen Soil in China (1:10 million) (Guoqing Qiu et al., 2000; Youwu Zhou et al., 2000), adopting a geocryological regionalization and classification dual series system. The geocryological regionalization system and classification system are used on the same map to reflect the commonality and individuality of the formation and distribution of frozen soil at each level. The geocryological regionalization system consists of three regions of frozen soil: (1) the frozen soil region of eastern China; (2) the frozen soil region of northwestern China; and (3) the frozen soil region of southwestern China (Tibetan Plateau). Based on the three large regions, 16 regions and several subregions are further divided. In the division of the geocryological boundary in the frozen soil area, the boundary between major regions I and III mainly consults the results of Bingyuan Li (1987). The boundary between major regions II and III is the northern boundary of the Tibetan Plateau, which is the Kunlun Mountains-Altun Mountains-Northern Qilian Mountains and the piedmont line. The boundary between major regions I and II is in the area of Helan Mountain-Langshan Mountain. The boundary of the secondary region is divided by the geomorphological conditions in regions II and III. However, in region I, it is mainly divided by the ratio of the annual temperature range A to the annual mean temperature T, and the frozen depths of various regions are taken into consideration. The classification system is divided into 8 types based on the continuity of frozen soil, the time of existence of frozen soil and the seasonal frozen depth. The various classifications of boundaries are mainly taken from the "Map of Snow, Ice and Frozen Ground in China" (1:4 million) (Yafeng Shi et al., 1988) and consult some new materials, whereas the seasonal frozen soil boundary is mainly based on the weather station data. The definitions of each classification are as follows: (1) Large permafrost: the continuous coefficient is 90%-70%; (2) Large-island permafrost: the continuous coefficient is 70%-30%; (3) Sparse island-shaped permafrost: the continuous coefficient is <30%; (4) Permafrost in the mountains; (5) Medium-season seasonal frozen soil: the maximum seasonal frozen depth that can be reached is >1 m; (6) Shallow seasonal frozen soil: the maximum seasonal frozen depth that can be reached is <1 m; (7) Short-term frozen soil: less than one month of storage time; and (8) Nonfrozen soil. According to the data, China's permafrost areas sum to approximately 2.19 × 10⁶ km², accounting for 22.83% of China's territory. Among those areas, the mountain permafrost is found over 0.42×10⁶ km2, which is 4.39% of the territory of China. The seasonal frozen soil area is approximately 4.76×10⁶ km², accounting for 49.6% of China's territory, and the instantaneous frozen soil area is approximately 1.86×10⁶ km², i.e., 19.33% of China's territory. For more information, please see the references (Youwu Zhou et al., 2000).
2020-10-09 View Details
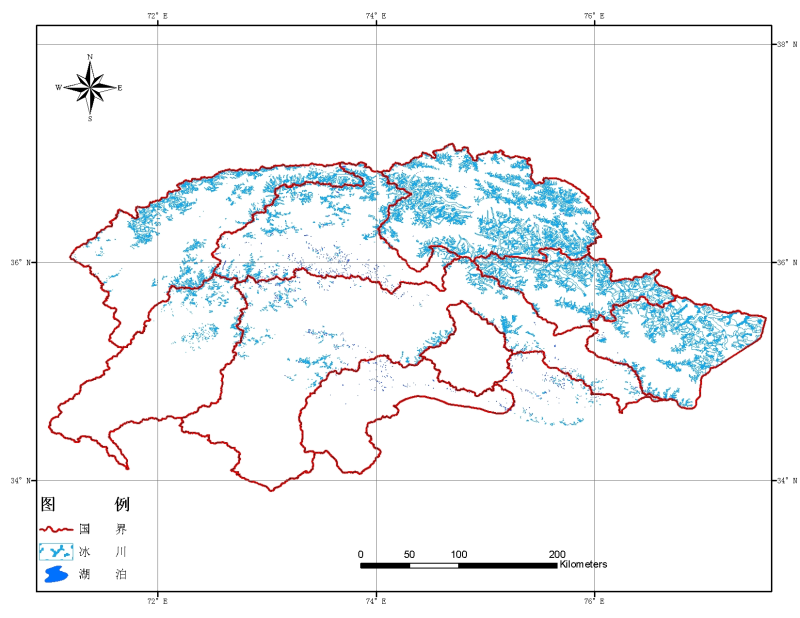
This dataset is the spatial distribution map of the marshes in the source area of the Yellow River near the Zaling Lake-Eling Lake, covering an area of about 21,000 square kilometers. The data set is classified by the Landsat 8 image through an expert decision tree and corrected by manual visual interpretation. The spatial resolution of the image is 30m, using the WGS 1984 UTM projected coordinate system, and the data format is grid format. The image is divided into five types of land, the land type 1 is “water body”, the land type 2 is “high-cover vegetation”, the land type 3 is “naked land”, and the land type 4 is “low-cover vegetation”, and the land type 5 is For "marsh", low-coverage vegetation and high-coverage vegetation are distinguished by vegetation coverage. The threshold is 0.1 to 0.4 for low-cover vegetation and 0.4 to 1 for high-cover vegetation.
2020-10-09 View Details

Based on the data of Keyhole satellite in 1960s, using object-oriented supervised classification and manual visual interpretation and correction, water data products are produced. The total interpretation area is 645,000 km2, accounting for 96.28% of the study area, of which 18,844 km2 is missing in The Three River Headwater region, 4,220 km2 is missing in the Yukon River basin study area in Alaska, and 1,954 km2 is missing in the Pul River basin in West Siberia. The width of the minimum linear figure is more than 8 meters, the area of the minimum surface figure is more than 100 square meters, the trace accuracy is 2 pixels, and the first-class interpretation accuracy is more than 95%. The obtained high spatial resolution surface water data products provide effective data for the study of water changes in the 1960s and reliable basis for the study of frozen soil changes.
2020-09-30 View Details

GLObal WAter BOdies database(GLOWABO)were obtained based on the GeoCoverTM Water bodies Extraction Method, Charles verpoorer et al, by Landsat 7 ETM + image in 2000 ± 3 years. The water extraction method combines the principal component analysis, threshold extraction, texture feature extraction and other methods, with a spatial resolution of 15 m and an overall accuracy of 91%. The data also includes water area, perimeter, shape index, elevation and other information. In this data set, The Three River Headwater region, Pul River Basin and Yukon River Basin, are selected to provide data support for polar hydrological research in the northern hemisphere.
2020-09-30 View Details

The main body of the Tibetan Plateau is Qinghai Province and the Tibetan Autonomous Region. The economic and social data of Qinghai Province and the Tibetan Autonomous Region are the basis for the analysis and assessment of the basic data of sustainable development of populations, resources, environment and economic society on the Tibetan Plateau by integrating the basic data of natural sciences. Under normal circumstances, the statistical yearbooks of all provinces and regions are all in paper and CD-ROM versions, and users need to perform secondary editing before they can use them. This data set mainly relies on the raw data of the Statistical Yearbook of Qinghai Province and the Tibetan Autonomous Region to carry out data conversion and integrate the current economic and social data sets. The temporal coverage of the data is from 2007 to 2016, and the temporal resolution is one year. The spatial coverage is Qinghai Province and the Tibetan Autonomous Region of the Tibetan Plateau. The spatial resolution is the administrative unit of the prefecture or city. The data include information on population, economy, finance, agriculture, forestry, animal husbandry and fishery, investment in fixed assets, education and health.
2020-09-30 View Details
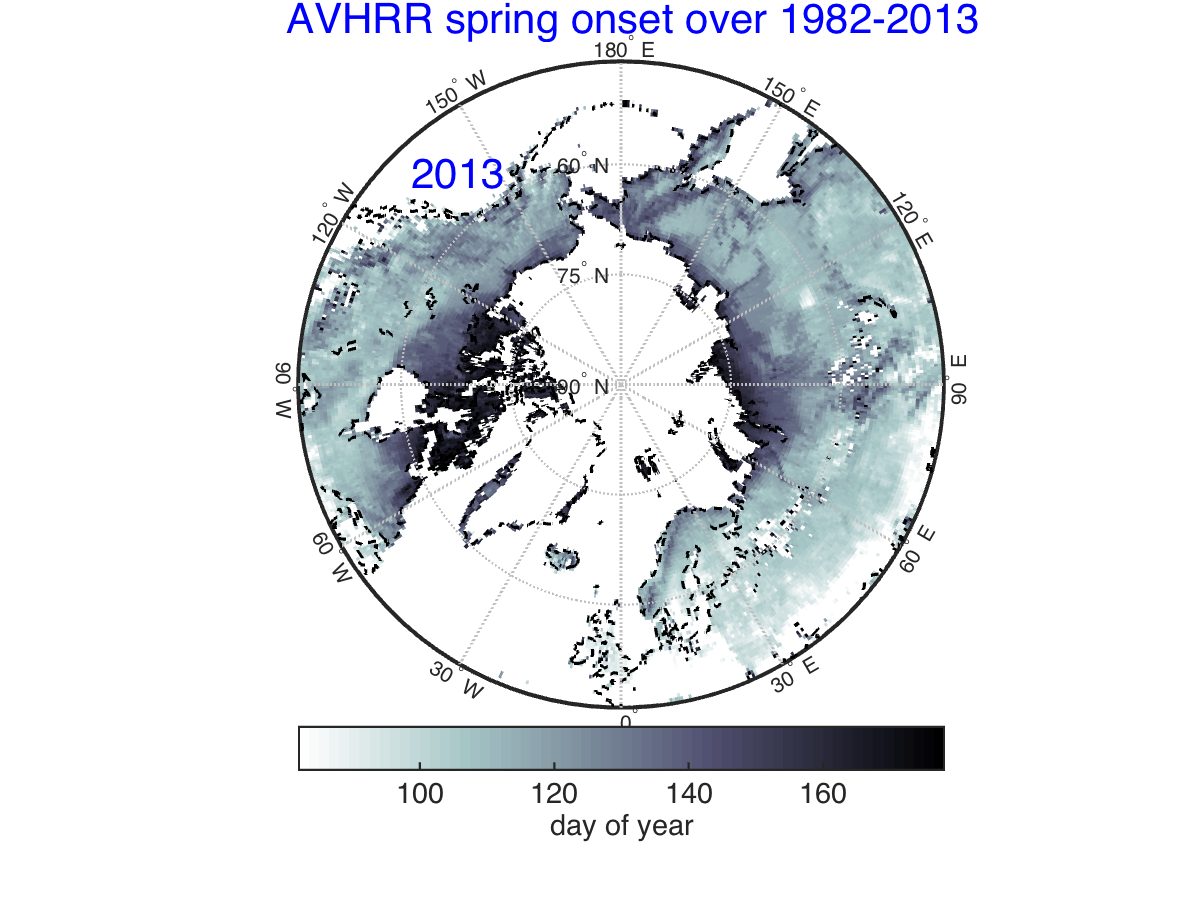
This dataset is based on the long sequence (1981-2013)normalized difference vegetation index product(Version 3) of the latest NOAA Global Inventory Monitoring and Modeling System (GIMMS). First, the NDVI data products were re-sampled from the spatial resolution of 1/12 degree to 0.5 degree, then the time series of every year was smoothed by the double-logistic method, and the smoothed curvature was calculated. The maximum curvature of spring was selected as the returning green stage of the vegetation in Spring. This data can be used to analyze the temporal and spatial characteristics of the Holarctic vegetation phenology in Spring.
2020-09-30 View Details
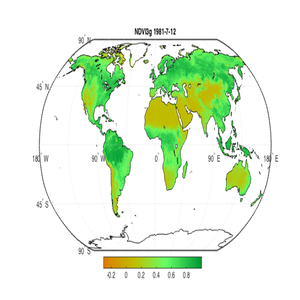
The NDVI data set is the latest release of the long sequence (1981-2015) normalized difference vegetation index product of NOAA Global Inventory Monitoring and Modeling System (GIMMS), version number 3g.v1. The temporal resolution of the product is twice a month, while the spatial resolution is 1/12 of a degree. The temporal coverage is from July 1981 to December 2015. This product is a shared data product and can be downloaded directly from ecocast.arc.nasa.gov. For details, please refer to https://nex.nasa.gov/nex/projects/1349/.
2020-09-30 View Details
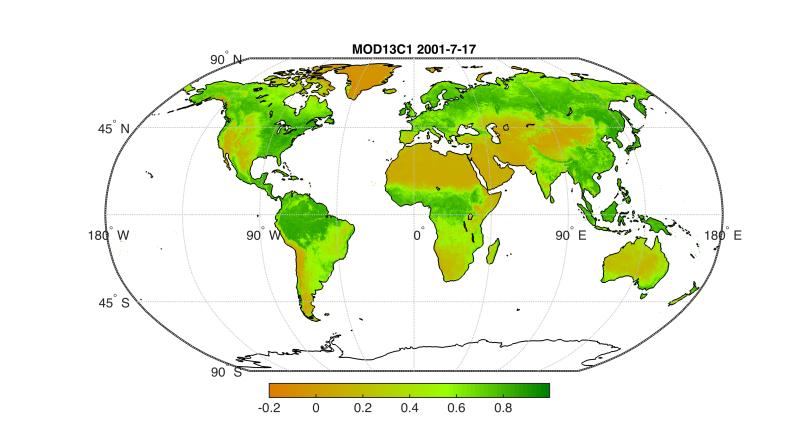
The NDVI data set is the sixth version of the MODIS Normalized Difference Vegetation Index product (2001-2016) jointly released by NASA EOSDIS LP DAAC and the US Geological Survey (USGS EROS). The product has a temporal resolution of 16 days and a spatial resolution of 0.05 degrees. This version is a Climate Modeling Grid (CMG) data product generated from the original NDVI product (MYD13A2) with a resolution of 1 kilometer. Please indicate the source of these data as follows in acknowledgments: The MOD13C NDVI product was retrieved online courtesy of the NASA EOSDIS Land Processes Distributed Active Archive Center (LP DAAC), USGS/Earth Resources Observation and Science (EROS) Center, Sioux Falls, South Dakota, The [PRODUCT] was (were) retrieved from the online [TOOL], courtesy of the NASA EOSDIS Land Processes Distributed Active Archive Center (LP DAAC), USGS/Earth Resources Observation and Science (EROS) Center, Sioux Falls, South Dakota.
2020-09-30 View Details
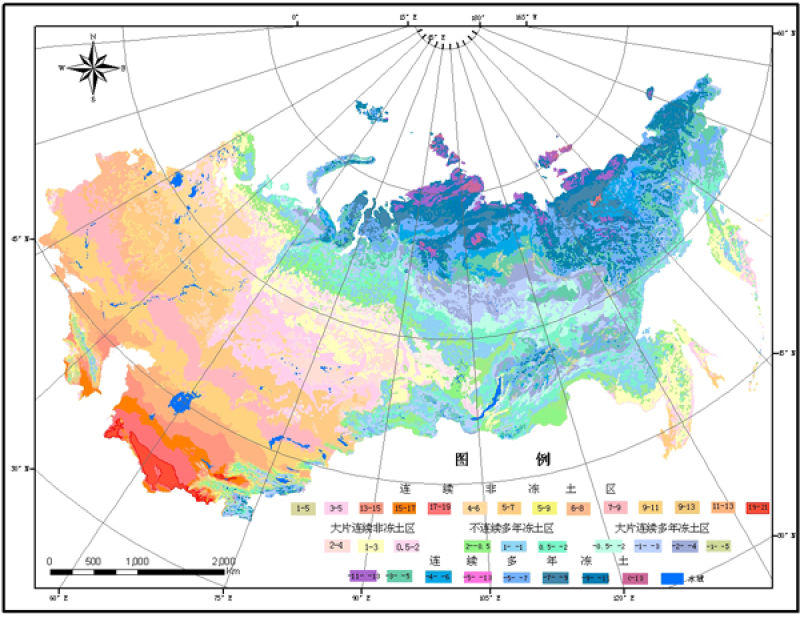
The source of the data is a 1:2500000-scale map series, "Geocryological Map of Russia and Neighboring Republics", published by Russia from 1991 to 1996, which is labelled in Russian and includes a total of 16 images. In 1998, Zaitsev and others translated it into English. In this study, seven of the images were digitized: 1) Distribution of frozen and unfrozen ground, 2) Mean annual temperature of unfrozen ground at the depth of zero annual amplitude (note that there is some uncertainty because the depth of zero amplitude is not provided, and data on this parameter is generally lacking), 3) Thickness of permafrost, 4) Depth from the surface and thickness of relict permafrost, 5) Distribution of permafrost containing cryopegs, 6) Thickness of permafrost containing cryopegs, 7) Distribution of permafrost with depth. 1. The data include multiple vector layers: (1) permafrost distribution, (2) permafrost temperature, (3) permafrost thickness, (4) permafrost formation conditions, and (5) the correction image. 2. The permafrost distribution map includes the following fields: AREA, PERIMETER, FROZEN_, FROZEN_ID: POLY_, POLY_, RINGS_OK, RINGS_NOK, A, FROZEN_SOI (frozen soil layer), and temperature. FROZEN_SOI are the Chinese and English representations of the type of frozen soil, respectively. 4. Frozen soil properties: Frozen soil Continuous predominantly unfrozen 1-5 Continuous permafrost -3- -5 Continuous unfrozen ground 4-6 Discontinuous permafrost 0.5- -2 Predominantly continuous permafrost -1- -3 Predominantly unfrozen ground 1-3 5. Projection information: PROJCS["Asia_North_Equidistant_Conic", GEOGCS["GCS_North_American_1927", DATUM["North_American_Datum_1927", SPHEROID["Clarke_1866",6378206.4,294.9786982]], PRIMEM["Greenwich",0.0], UNIT["Degree",0.0174532925199433]], PROJECTION["Equidistant_Conic"], PARAMETER["False_Easting",0.0], PARAMETER["False_Northing",0.0], PARAMETER["longitude_of_center",100.0], PARAMETER["Standard_Parallel_1",15.0], PARAMETER["Standard_Parallel_2",58.3], PARAMETER["latitude_of_center",60.0], UNIT["Meter",1.0]]
2020-09-15 View Details
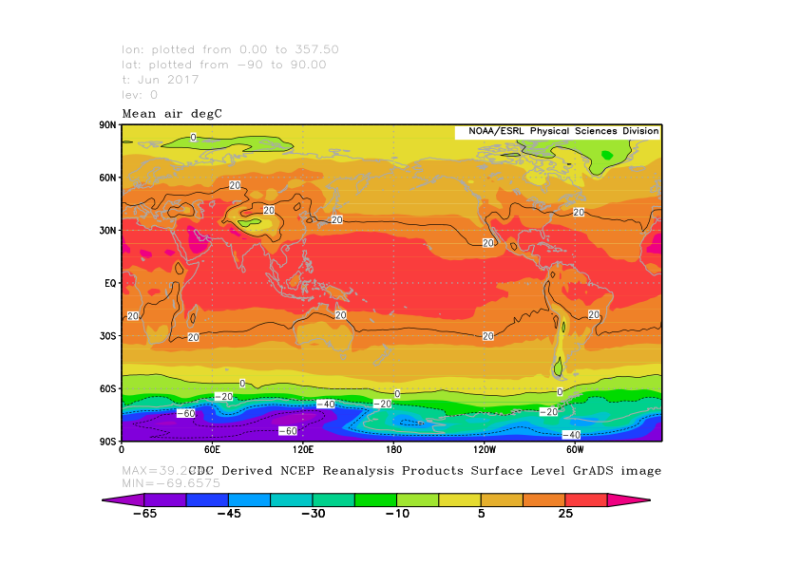
1) The data set is composed of global atmospheric reanalysis data jointly produced by the National Centers for Environmental Prediction (NCEP) and the National Center for Atmospheric Research (NCAR). These grid data are generated by reanalysing the global meteorological data from 1948 to present by applying observation data, forecasting models and assimilation systems. The data variables include surface, near-surface (.995 sigma layer) and multiple meteorological variables in different barospheres, such as precipitation, temperature, relative humidity, sea level pressure, geopotential height, wind field, heat flux, etc. 2) The coverage time is from 1948 to 2018, and the data from 1948 to 1957 are non-Gaussian grid data. The data cover the whole world. The spatial resolution is a 2.5° latitude by 2.5° longitude grid. The vertical resolution is a 17-layer standard pressure barosphere, with layer boundaries at 1000, 925, 850, 700, 600, 500, 400, 300, 250, 200, 150, 100, 70, 50, 30, 20, and 10 hPa, and 28 sigma levels. Some variables are calculated for 8 layers (omega) or 12 layers (humidity), with temporal resolutions of 6 hours, daily, monthly or a long-term monthly average (from 1981 to 2010). The daily data are obtained by averaging the daily values of 0Z, 6Z, 12Z and 18Z. 3) Missing values are assigned a value of -9.99691e+36f. The data are stored in the .nc format with the file name var.time.stat.nc, and each file includes data on latitude, longitude, time, and atmospheric variables. For detailed data specifications, please visit http://www.esrl.noaa.gov/pad/data.
2020-09-14 View Details
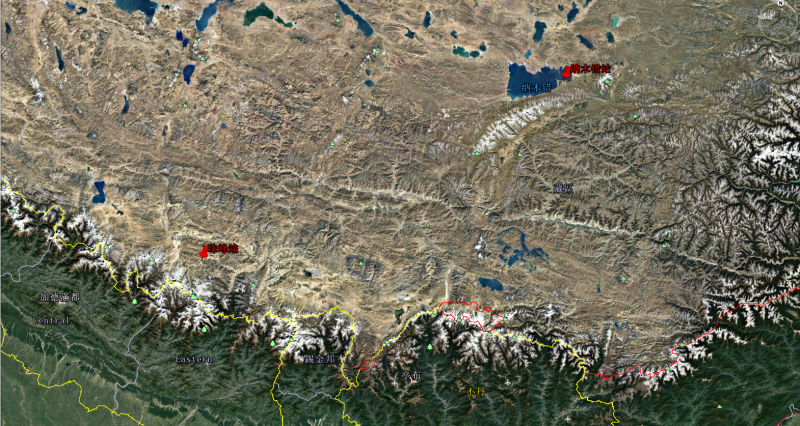
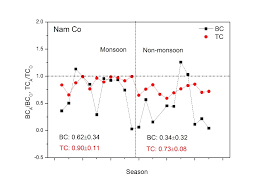
The measurement data of the sun spectrophotometer can be directly used to perform inversion on the optical thickness of the non-water vapor channel, Rayleigh scattering, aerosol optical thickness, and moisture content of the atmospheric air column (using the measurement data at 936 nm of the water vapor channel). The aerosol optical property data set of the Tibetan Plateau by ground-based observations was obtained by adopting the Cimel 318 sun photometer, and both the Mt. Qomolangma and Namco stations were involved. The temporal coverage of the data is from 2009 to 2016, and the temporal resolution is one day. The sun photometer has eight observation channels from visible light to near infrared. The center wavelengths are 340, 380, 440, 500, 670, 870, 940 and 1120 nm. The field angle of the instrument is 1.2°, and the sun tracking accuracy is 0.1°. According to the direct solar radiation, the aerosol optical thickness of 6 bands can be obtained, and the estimated accuracy is 0.01 to 0.02. Finally, the AERONET unified inversion algorithm was used to obtain aerosol optical thickness, Angstrom index, particle size spectrum, single scattering albedo, phase function, birefringence index, asymmetry factor, etc.
2020-08-17 View Details
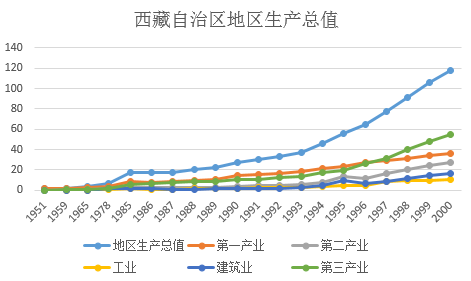
This data contains part of the economic indicators of Qinghai province and Tibet Autonomous Region. The data statistics based on provinces can be used to construct the evaluation index system for the coupling coordination relationship between urbanization and eco-environment on the Tibetan Plateau. The data of the Tibet Autonomous Region contains seven indicators, including the gross domestic product (GDP), the primary, secondary and tertiary industries, industry, construction industry, and the per capita GDP, the time span is 1951-2016. The time span of the data set of Qinghai province is from 1952 to 2015, besides the above seven indicators, there is one more indicator of Qinghai province called agriculture forwdtry animal husbandry and fishery. All data are derived from the statistical yearbook, which is calculated at current prices. The gross domestic product (GDP) for 2005-2008 has been revised based on data from the second economic census.
2020-08-15 View Details
Climate records obtained by most instruments are relatively short in time, which limits the study of climate change, necessitating the use of proxy data to extend records to the past. It was not until the late 1940s that atmospheric data of sufficient quality and spatial resolution were available to determine the main patterns of climate change such as the North American Pacific model and the Pacific Decadal Oscillation. The global ice cores are from the north and south poles and the third pole, and there are also mountain glaciers in Alaska. The ice core data obtained in that area are of great significance for revealing the climate in North America and climate change in the Arctic regions at both low and high latitudes. The physical meaning of each variable: First column: time; second column: accumulation rate data; third column: oxygen isotope data value
2020-08-13 View Details

Chinese Cryospheric Information System is a comprehensive information system for the management and analysis of Chinese cryospheric data. The establishment of Chinese Cryospheric Information System is to meet the needs of earth system science, and provide parameters and verification data for the development of response and feedback models of permafrost, glacier and snow cover to global changes under GIS framework. On the other hand, the system collates and rescues valuable cryospheric data to provide a scientific, efficient and safe management and analysis tool. Chinese Cryospheric Information System contains three basic databases of different research regions. The basic database of Urumqi river basin is one of three basic databases, which covers the Urumqi river basin in tianshan mountain, east longitude 86-89 °, and north latitude 42-45 °, mainly containing the following data: 1. Cryospheric data.Include: Distribution of glacier no. 1 and glacier no. 2; 2. Natural environment and resources.Include: Terrain digital elevation: elevation, slope, slope direction; Hydrology: current situation of water resource utilization;Surface water; Surface characteristics: vegetation type;Soil type;Land resource evaluation map;Land use status map; 3. Social and economic resources: a change map of human action; Please refer to the documents (in Chinese): "Chinese Cryospheric Information System design. Doc" and "Chinese Cryospheric Information System data dictionary. Doc".
2020-07-31 View Details
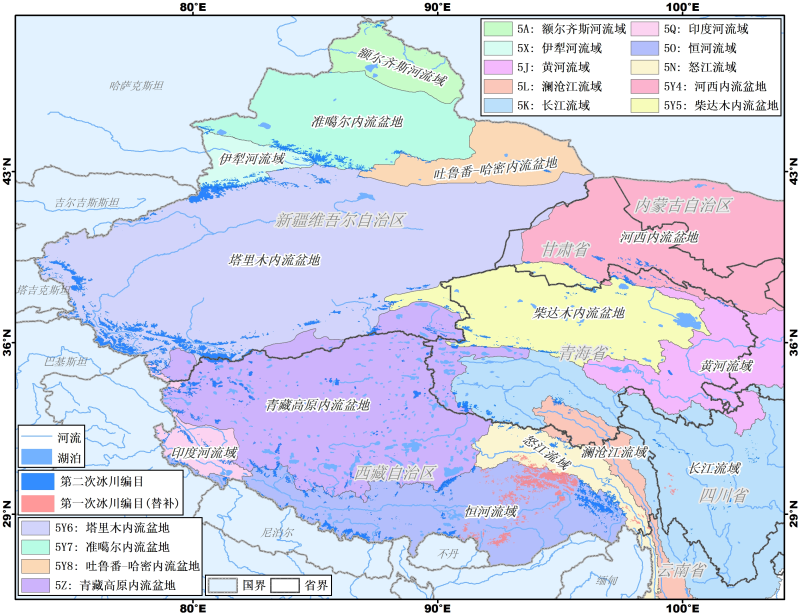
China's second glacier inventory uses the high-resolution Landsat TM/ETM+ remote sensing satellite data as the main glacier boundary data source and extracts the data source with the latest global digital elevation model, SRTM V4, as the glacier attribute, using the current international ratio threshold segmentation method to extract the glacier boundary in bare ice areas. The ice ridge extraction algorithm is developed to extract the glacier ice ridge, and it is used for the segmentation of a single glacier. At the same time, the international general algorithm is used to calculate the glacier attributes, so that the vector data and attribute data that contain the glacier information of the main glacier regions in west China are obtained. Compared with some field GPS field measurement data and higher resolution remote sensing images (such as from QuickBird and WorldView), the glacial vector data in the second glacier inventory data set of China have higher positioning accuracy and can meet the requirements for glacial data in national land, water conservancy, transportation, environment and other fields. Glacier inventory attributes: Glc_Name, Drng_Code, FCGI_ID, GLIMS_ID, Mtn_Name, Pref_Name, Glc_Long, Glc_Lati, Glc_Area, Abs_Accu, Rel_Accu, Deb_Area, Deb_A_Accu, Deb_R_Accu, Glc_Vol_A, Glc_Vol_B, Max_Elev, Min_Elev, Mean_Elev, MA_Elev, Mean_Slp, Mean_Asp, Prm_Image, Aux_Image, Rep_Date, Elev_Src, Elev_Date, Compiler, Verifier. For a detailed data description, please refer to the second glacier inventory data description.
2020-07-29 View Details
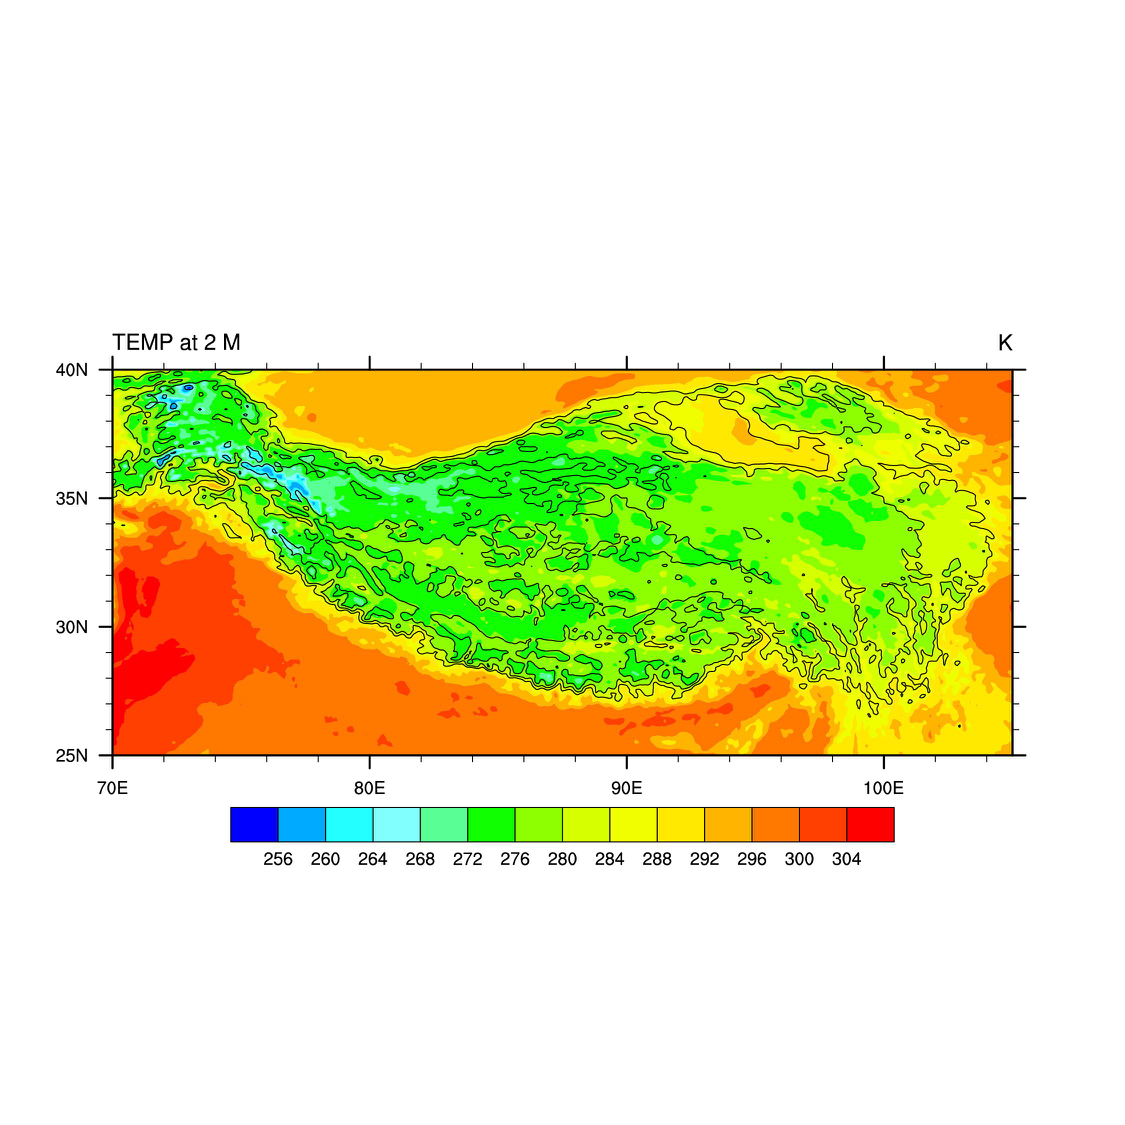
Based on the WRF model, using ERA5 reanalysis data as the initial and boundary fields, the high-resolution low-level atmospheric structure and the earth atmosphere exchange data set of the Qinghai Tibet Plateau are preliminarily obtained by the method of dynamic downscaling. The time range of this data set is from August 1 to August 31, 2014, with a time resolution of 1 hour, a horizontal range of 25 °N-40 °N, 70oE-105oE, and a horizontal resolution of 0.05 °. The data format is NetCDF, and one file is output every hour. The file is named after the date. The lower atmospheric structure data includes temperature, relative humidity, water vapor mixing ratio, potential height, meridional wind and latitudinal wind meteorological elements, with 34 isobaric surfaces in the vertical direction; the surface air exchange data set includes the upward / downward short wave radiation, upward / downward long wave radiation, surface sensible heat and flux, 2m air temperature and water vapor mixing ratio, 10m wind, etc. The data set can provide data support for the study of weather process and climate environment in the Tibetan Plateau.
2020-07-07 View Details

The data set includes meteorological data from the Ngari Desert Observation and Research Station from 2009 to 2017. It includes the following basic meteorological parameters: temperature (1.5 m from the ground, once every half hour, unit: Celsius), relative humidity (1.5 m from the ground, once every half hour, unit: %), wind speed (1.5 m from the ground, once every half hour, unit: m/s), wind direction (1.5 m from the ground, once every half hour, unit: degrees), atmospheric pressure (1.5 m from the ground, once every half hour, unit: hPa), precipitation (once every 24 hours, unit: mm), water vapour pressure (unit: kPa), evaporation (unit: mm), downward shortwave radiation (unit: W/m2), upward shortwave radiation (unit: W/m2), downward longwave radiation (unit: W/m2), upward longwave radiation (unit: W/m2), net radiation (unit: W/m2), surface albedo (unit: %). The temporal resolution of the data is one day. The data were directly downloaded from the Ngari automatic weather station. The precipitation data represent daily precipitation measured by the automatic rain and snow gauge and corrected based on manual observations. The other observation data are the daily mean value of the measurements taken every half hour. Instrument models of different observations: temperature and humidity: HMP45C air temperature and humidity probe; precipitation: T200-B rain and snow gauge sensor; wind speed and direction: Vaisala 05013 wind speed and direction sensor; net radiation: Kipp Zonen NR01 net radiation sensor; atmospheric pressure: Vaisala PTB210 atmospheric pressure sensor; collector model: CR 1000; acquisition interval: 30 minutes. The data table is processed and quality controlled by a particular person based on observation records. Observations and data acquisition are carried out in strict accordance with the instrument operating specifications, and some data with obvious errors are removed when processing the data table.
2020-06-24 View Details
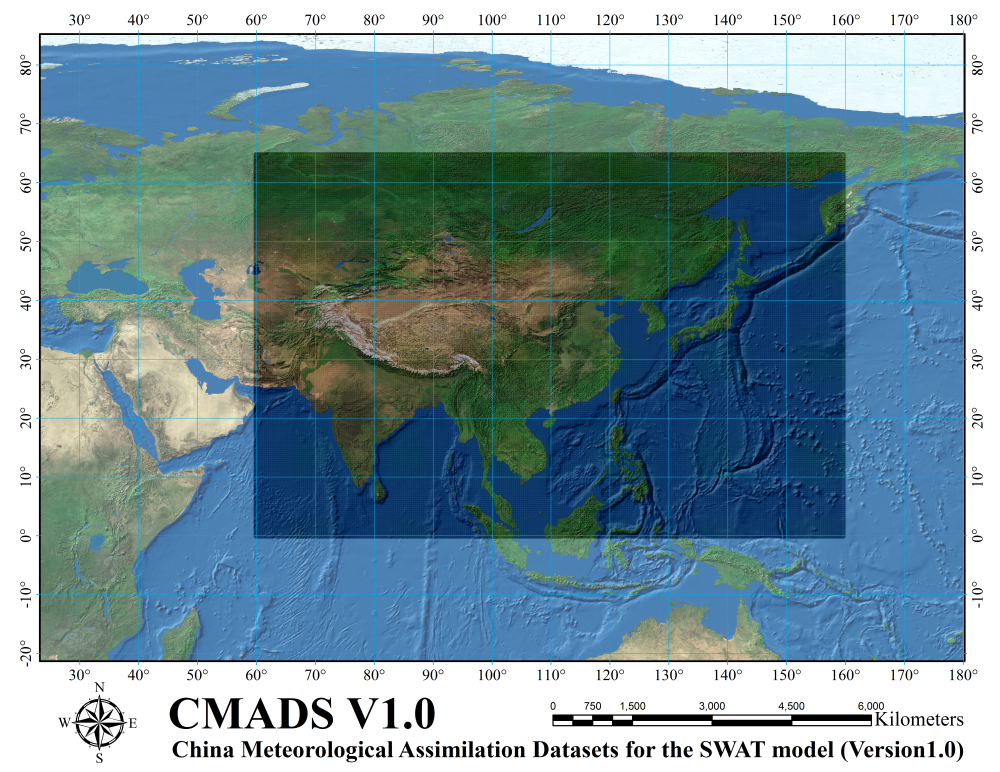
CMADS V1.0(The China Meteorological Assimilation Driving Datasets for the SWAT model Version 1.0)Version of the data set introduces the technology of STMAS assimilation algorithm . It was constructed using multiple technologies and scientific methods, including loop nesting of data, projection of resampling models, and bilinear interpolation. The CMADS series of datasets can be used to drive various hydrological models, such as SWAT, the Variable Infiltration Capacity (VIC) model, and the Storm Water Management model (SWMM). It also allows users to conveniently extract a wide range of meteorological elements for detailed climatic analyses. Data sources for the CMADS series include nearly 40,000 regional automatic stations under China’s 2,421 national automatic and business assessment centres. This ensures that the CMADS datasets have wide applicability within the country, and that data accuracy was vastly improved. The CMADS series of datasets has undergone finishing and correction to match the specific format of input and driving data of SWAT models. This reduces the volume of complex work that model builders have to deal with. An index table of the various elements encompassing all of East Asia was also established for SWAT models. This allows the models to utilize the datasets directly, thus eliminating the need for any format conversion or calculations using weather generators. Consequently, significant improvements to the modelling speed and output accuracy of SWAT models were achieved. Most of the source data in the CMADS datasets are derived from CLDAS in China and other reanalysis data in the world. The integration of air temperature, air pressure, humidity, and wind velocity data was mainly achieved through the LAPS/STMAS system. Precipitation data were stitched using CMORPH’s global precipitation products and the National Meteorological Information Center’s data of China (which is based on CMORPH’s integrated precipitation products). The latter contains daily precipitation records observed at 2,400 national meteorological stations and the CMORPH satellite’s inversion precipitation products.The inversion algorithm for incoming solar radiation at the ground surface makes use of the discrete longitudinal method by Stamnes et al.(1988)to calculate radiation transmission. The resolutions for CMADS V1.0, V1.1, V1.2, and V1.3 were 1/3°, 1/4°, 1/8°, and 1/16°, respectively. In CMADS V1.0 (at a spatial resolution of 1/3°), East Asia was spatially divided into 195 × 300 grid points containing 58,500 stations. Despite being at the same spatial resolution as CMADS V1.0, CMADS V1.1 contains more data, with 260 × 400 grid points containing 104,000 stations. For both versions, the stations’ daily data include average solar radiation, average temperature, average pressure, maximum and minimum temperature, specific humidity, cumulative precipitation, and average wind velocity. The CMADS comprises other variables for any hydrological model(under 'For-other-model' folder ): Daily Average Temperature, Daily Maximum Temperature, Daily Minimum Temperature, Daily cumulative precipitation (20-20h), Daily average Relative Humidity, Daily average Specific Humidity, Daily average Solar Radiation, Daily average Wind, and Daily average Atmospheric Pressure. Introduction to metadata of CMADS CMADS storage path description:(CMADS was divided into two datesets) 1.CMADS-V1.0\For-swat\ --specifically driving the SWAT model 2.CMADS-V1.0\For-other-model\ --specifically driving the other hydrological model(VIC,SWMM,etc.) CMADS--\For-swat-2009\ folder contain:(Station\ and Fork\) 1).Station\ Relative-Humidity-58500\ Daily average relative humidity(fraction) Precipitation-58500\ Daily accumulated 24-hour precipitation(mm) Solar radiation-58500\ Daily average solar radiation(MJ/m2) Tmperature-58500\ Daily maximum and minimum temperature(℃) Wind-58500\ Daily average wind speed(m/s) Where R, P, S, T, W+ dimensional grid number - the number of longitude grid is the station in the above five folders respectively.(Where R,P,S,T,W respective Daily average relative humidity,Daily cumulative precipitation(24h),Daily mean solar radiation(MJ/m2),Daily maximum and minimum temperature(℃) and Daily mean wind speed (m/s)) respectively.Data format is (.dbf) 2).Fork\ (Station index table over East Asia) PCPFORK.txt (Precipitation index table) RHFORK.txt (Relative humidity index table) SORFORK.txt (Solar radiation index table) TMPFORK.txt (Temperature index table) WINDFORK.txt (Wind speed index) CMADS--\For-swat-2012\ folder contain:(Station\ and Fork\) Storage structure is consistency with \For-swat- 2009\.However, all the data in this directory are only available in TXT format and can be readed by SWAT2012. 3)\For-other-model\ (Includes all weather input data required by the any hydrologic model (daily).) Atmospheric-Pressure-txt\ Daily average atmospheric pressure(hPa) Average-Temperature-txt\ Daily average temperature(℃) Maximum-Temperature-txt\ Daily maximum temperature(℃) Minimum-Temperature-txt\ Daily minimum temperature(℃) Precipitation-txt\ Daily accumulated 24-hour precipitation (mm) Relative-Humidity-txt\ Daily average relative humidity(fraction) Solar-Radiation-txt\ Daily average solar radiation(MJ/m2) Specific-Humidity-txt\ Daily average Specific Humidity(g/kg) Wind-txt\ Daily average wind speed(m/s) Data storage information: data set storage format is .dbf and .txt Other data information: Total data: 33.6GB Occupied space: 35.2GB Time: From year 2008 to year 2016 Time resolution: Daily Geographical scope description: East Asia Longitude: 60°E The most east longitude: 160°E North latitude: 65°N Most southern latitude: 0°N Number of stations: 58500 stations Spatial resolution: 1/3 * 1/3 * grid points Vertical range: None
2020-06-23 View Details
Contact Support
Links
National Tibetan Plateau Data CenterFollow Us

A Big Earth Data Platform for Three Poles © 2018-2020 No.05000491 | All Rights Reserved
|  No.11010502040845
Tech Support: westdc.cn