
Brief Introduction:The Tibetan Plateau, known as the " third pole " of the earth, has always been the focus of attention of the international community because it is an important area driving global environmental change research and has a profound regulatory effect on the ecology, environment and climate of the whole earth. Under the background of global warming, the cryosphere elements such as tripolar glaciers, frozen soils, and freeze-thaw lakes have undergone significant changes, with glaciers shrinking rapidly and permafrost active layers thickening. For a long time, China has carried out systematic and multidisciplinary research in the world ' s third pole with the Qinghai-Tibet Plateau as the main body, forming a rich research accumulation.
Publish Datetime:2022-12-13
Number of Datasets:184

The Tibetan Plateau Glacier Data –TPG2013 is a glacial coverage data on the Tibetan Plateau around 2013. 128 Landsat 8 Operational Land Imager (OLI) images were selected with 30-m spatial resolution, for comparability with previous and current glacier inventories. Besides, about 20 images acquired in 2014 were used to complete the full coverage of the TP. The most frequent year in this period was defined as the reference year for the mosaic image: i.e. 2013. Glacier outlines were digitized on-screen manually from the 2013 image mosaic, relying on false-colour image composites (RGB by bands 654), which allowed us to distinguish ice/snow from cloud. Debris-free ice was distinguished from the debris and debris-covered ice by its higher reflectance. Debris-covered ice was not delineated in this data. [To minimize the effects of snow or cloud cover on glacierized areas, high-resolution (30 m spatial resolution and 4-day repetition cycle) images were also used for reference in glacier delineation from the Chinese satellites HJ-1A and HJ-1B, which were launched on Sep.6th 2008. Both carried as payload two 4-band CCD cameras with swath width 700 km (360 km per camera). All HJ-1A/1B data in 2012, 2013 and 2014 (65 scenes, Fig.S1, Table S1) were from China Centre for Resources Satellite Data and Application (CRESDA; http://www.cresda.com/n16/n92006/n92066/n98627/index.html). Each scene was orthorectified with respect to the 30m-resolution digital elevation model (DEM) of the Shuttle Radar Topography Mission (SRTM) and Landsat images.] The delineated glacier outlines were compared with band-ratio (e.g. TM3/TM5) results, and validated by overlapping them onto Google Earth imagery, SRTM DEM, topographic maps and corresponding satellite images. Topographic maps from the 1970s and all available satellite images (including Google EarthTM imagery and HJ-1A/1B satellite data) were used as base reference data. For areas with mountain shadows and snow cover, they were verified by different methods using data from different seasons. For glaciers in deep shadow, Google EarthTM imagery from different dates was used as the reference for manual delineation. Steep slopes or headwalls were also excluded in the TPG2013. Areas that appeared in any of these sources to have the characteristics of exposed ground/basement/bed rock were manually delineated as non-glacier, and were also cross-checked with CGI-1 and CGI-2. Steep hanging glaciers were included in TPG2013 if they were identifiable on images in all three epochs (i.e. TPG1976, TPG2001, and TPG2013). The accuracy of manual digitization was controlled within one half-pixel. All glacier areas were calculated on the WGS84 spheroid in an Albers equal-area map projection centred at (95°E, 30°N) with standard parallels at 15°N and 65°N. Our results showed that the relative deviation of manual interpretation was less than 3.9%.
2021-08-30 View Details
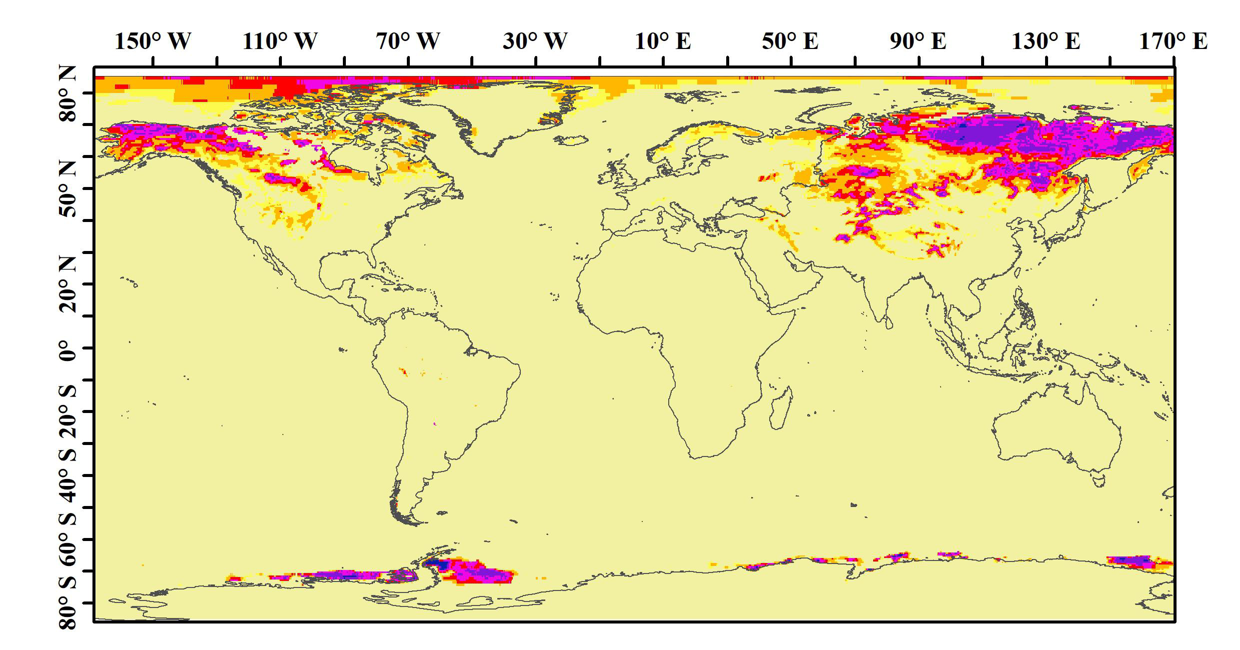
The “Long-term series of daily global snow depth” was produced using the passive microwave remote sensing data. The temporal range is 1980~2018, and the coverage is the global land. The spatial resolutions is 25,067.53 m and the temporal resolution is daily. A dynamic brightness temperature gradient algorithm was used to derive snow depth. In this algorithm, the spatial and temporal variations of snow characteristics were considered and the spatial and seasonal dynamic relationships between the temperature difference between 18 GHz and 36 GHz and the measured snow depth were established. The long-term sequence of satellite-borne passive microwave brightness temperature data used to derive snow depth came from three sensors (SMMR, SSM/I and SSMI/S), and there is a certain system inconsistency among them. So, the inter-sensor calibration was performed to improve the temporal consistency of these brightness temperature data before snow depth derivation. The accuracy analysis shows that the relative deviation of Eurasia snow depth data is within 30%. The data are stored as a txt file every day, each file is a 1383*586 snow depth matrix, and each snow depth represents a 25,067.53m* 25,067.53m grid. The projection of this data is EASE-Grid, and following is the file header which describes the projection detail. File header: ncols 1383 nrows 586 xllcorner -17334193.54 yllcorner -7344787.75 cellsize 25,067.53 NODATA_value -1
2021-08-14 View Details
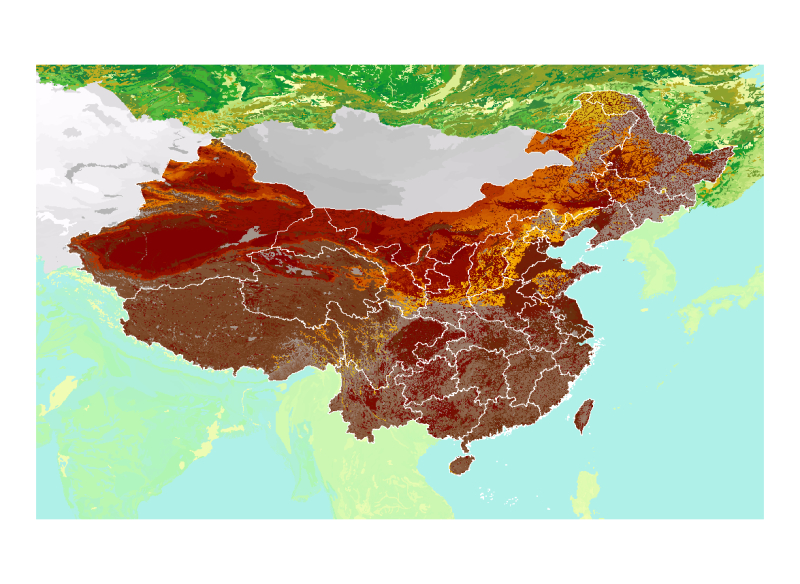
Soil data is important both on a global scale and on a local scale, and due to the lack of reliable soil data, land degradation assessments, environmental impact studies, and sustainable land management interventions have received significant bottlenecks . Affected by the urgent need for soil information data around the world, especially in the context of the Climate Change Convention, the International Institute for Applied Systems Analysis (IIASA) and the Food and Agriculture Organization of the United Nations (FAO) and the Kyoto Protocol for Soil Carbon Measurement and FAO/International The Global Agroecological Assessment Study (GAEZ v3.0) jointly established the Harmonized World Soil Database version 1.2 (HWSD V1.2). Among them, the data source in China is the second national land in 1995. Investigate 1:1,000,000 soil data provided by Nanjing Soil. The resolution is 30 seconds (about 0.083 degrees, 1km). The soil classification system used is mainly FAO-90. The core soil system unit unique verification identifier: MU_GLOBAL-HWSD database soil mapping unit identifier, connected to the GIS layer. MU_SOURCE1 and MU_SOURCE2 source database drawing unit identifiers SEQ-soil unit sequence in the composition of the soil mapping unit; The soil classification system utilizes the FAO-7 classification system or the FAO-90 classification system (SU_SYM74 resp. SU_SYM90) or FAO-85 (SU_SYM85). The main fields of the soil property sheet include: ID (database ID) MU_GLOBAL (Soil Unit Identifier) (Global) SU_SYMBOL soil drawing unit SU_SYM74 (FAO74 classification); SU_SYM85 (FAO85 classification); SU_SYM90 (name of soil in the FAO90 soil classification system); SU_CODE soil charting unit code SU_CODE74 soil unit name SU_CODE85 soil unit name SU_CODE90 soil unit name DRAINAGE (19.5); REF_DEPTH (soil reference depth); AWC_CLASS(19.5); AWC_CLASS (effective soil water content); PHASE1: Real (soil phase); PHASE2: String (soil phase); ROOTS: String (depth classification to the bottom of the soil); SWR: String (soil moisture content); ADD_PROP: Real (specific soil type in the soil unit related to agricultural use); T_TEXTURE (top soil texture); T_GRAVEL: Real (top gravel volume percentage); (unit: %vol.) T_SAND: Real (top sand content); (unit: % wt.) T_SILT: Real (surface layer sand content); (unit: % wt.) T_CLAY: Real (top clay content); (unit: % wt.) T_USDA_TEX: Real (top layer USDA soil texture classification); (unit: name) T_REF_BULK: Real (top soil bulk density); (unit: kg/dm3.) T_OC: Real (top organic carbon content); (unit: % weight) T_PH_H2O: Real (top pH) (unit: -log(H+)) T_CEC_CLAY: Real (cation exchange capacity of the top adhesive layer soil); (unit: cmol/kg) T_CEC_SOIL: Real (cation exchange capacity of top soil) (unit: cmol/kg) T_BS: Real (top level basic saturation); (unit: %) T_TEB: Real (top exchangeable base); (unit: cmol/kg) T_CACO3: Real (top carbonate or lime content) (unit: % weight) T_CASO4: Real (top sulfate content); (unit: % weight) T_ESP: Real (top exchangeable sodium salt); (unit: %) T_ECE: Real (top conductivity). (Unit: dS/m) S_GRAVEL: Real (bottom crushed stone volume percentage); (unit: %vol.) S_SAND: Real (bottom sand content); (unit: % wt.) S_SILT: Real (bottom sludge content); (unit: % wt.) S_CLAY: Real (bottom clay content); (unit: % wt.) S_USDA_TEX: Real (bottom USDA soil texture classification); (unit: name) S_REF_BULK: Real (bottom soil bulk density); (unit: kg/dm3.) S_OC: Real (underlying organic carbon content); (unit: % weight) S_PH_H2O: Real (bottom pH) (unit: -log(H+)) S_CEC_CLAY: Real (cation exchange capacity of the underlying adhesive layer soil); (unit: cmol/kg) S_CEC_SOIL: Real (cation exchange capacity of the bottom soil) (unit: cmol/kg) S_BS: Real (underlying basic saturation); (unit: %) S_TEB: Real (underlying exchangeable base); (unit: cmol/kg) S_CACO3: Real (bottom carbonate or lime content) (unit: % weight) S_CASO4: Real (bottom sulfate content); (unit: % weight) S_ESP: Real (underlying exchangeable sodium salt); (unit: %) S_ECE: Real (underlying conductivity). (Unit: dS/m) The database is divided into two layers, with the top layer (T) soil thickness (0-30 cm) and the bottom layer (S) soil thickness (30-100 cm). For other attribute values, please refer to the HWSD1.2_documentation documentation.pdf, The Harmonized World Soil Database (HWSD V1.2) Viewer-Chinese description and HWSD.mdb.
2021-08-05 View Details
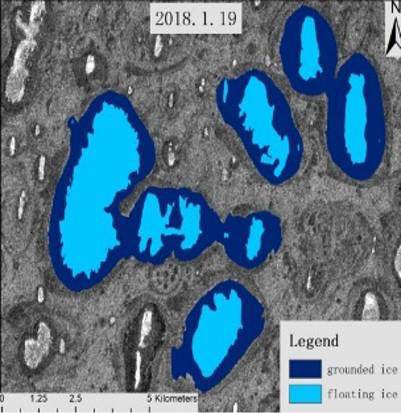
Lake ice is an important parameter of the cryosphere, its change is closely related to the climate parameters such as temperature and precipitation, and can directly reflect the climate change, so it is an important indicator of the regional climate parameter change. However, because the research area is often located in the area with poor natural environment and few population, large-scale field observation is difficult to carry out, so sentinel 1 satellite data is used. The spatial resolution of 10 m and the temporal resolution of better than 30 days are used to monitor the changes of different types of lake ice, which fills the observation gap. Hmrf algorithm is used to classify different types of lake ice. Through time series analysis of the distribution of different types of lake ice in three polar regions with a part area of more than 25km2, a lake ice type data set is formed. The distribution of different types of lake ice in these lakes can be obtained. The data includes the serial number of the processed lake, the year in which it is located and the serial number in the time series, vector and other information. The data set includes the algorithm used, sentinel-1 satellite data used, imaging time, polar area, lake ice type and other information. Users can determine the changes of different types of lake ice in the time series according to the vector file.
2021-04-09 View Details
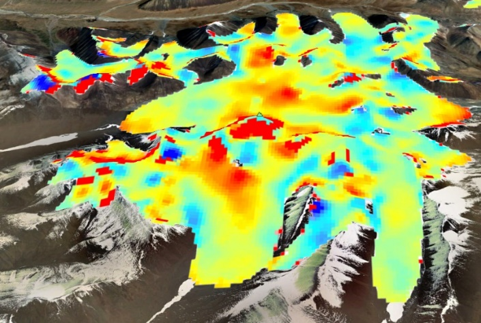
This product is based on multi-source remote sensing DEM data generation. The steps are as follows: select control points in relatively stable and flat terrain area with Landsat ETM +, SRTM and ICESat remote sensing data as reference. The horizontal coordinates of the control points are obtained with Landsat ETM + l1t panchromatic image as the horizontal reference. The height coordinates of the control points are mainly obtained by ICESat gla14 elevation data, and are supplemented by SRTM elevation data in areas without ICESat distribution. Using the selected control points and automatically generated connection points, the lens distortion and residual deformation are compensated by Brown's physical model, so that the total RMSE of all stereo image pairs in the aerial triangulation results is less than 1 pixel. In order to edit the extracted DEM data to eliminate the obvious elevation abnormal value, DEM Interpolation, DEM filtering and DEM smoothing are used to edit the DEM on the glacier, and kh-9 DEM data in the West Kunlun West and West Kunlun east regions are spliced to form products.
2021-04-09 View Details
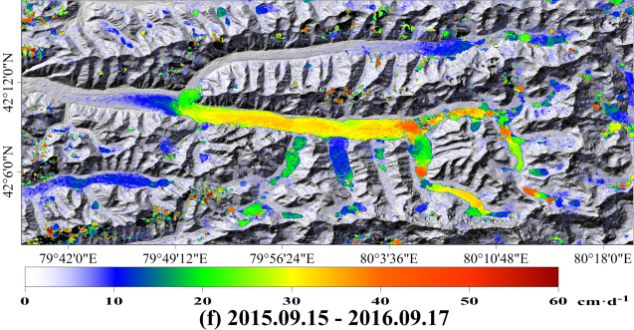
Glaciers are very sensitive to regional and global climate change, so they are often regarded as one of the indicators of climate change, and their relevant parameters are also the key indicators of climate change research. Especially in the comparative study of the three polar environmental changes on the earth, the time and space difference ratio of glacial speed is one of the focuses of climate change research. However, because glaciers are basically located in high altitude, high latitude and high cold areas, the natural environment is poor, and people are rarely seen, and it is difficult to carry out the conventional field measurement of large-scale glacial movement. In order to understand the glacial movement in the three polar areas in a timely, efficient, comprehensive and accurate manner, radar interferometry, radar and optical image pixel tracking are used to obtain the three polar areas. The distribution of surface movement of some typical glaciers in some years from 2000 to 2017 provides basic data for the comparative analysis of the movement of the three polar glaciers. The dataset contains 12 grid files named "glacier movement in a certain period of time in a certain region". Each grid map mainly contains the regional velocity distribution of a typical glacier.
2021-04-09 View Details
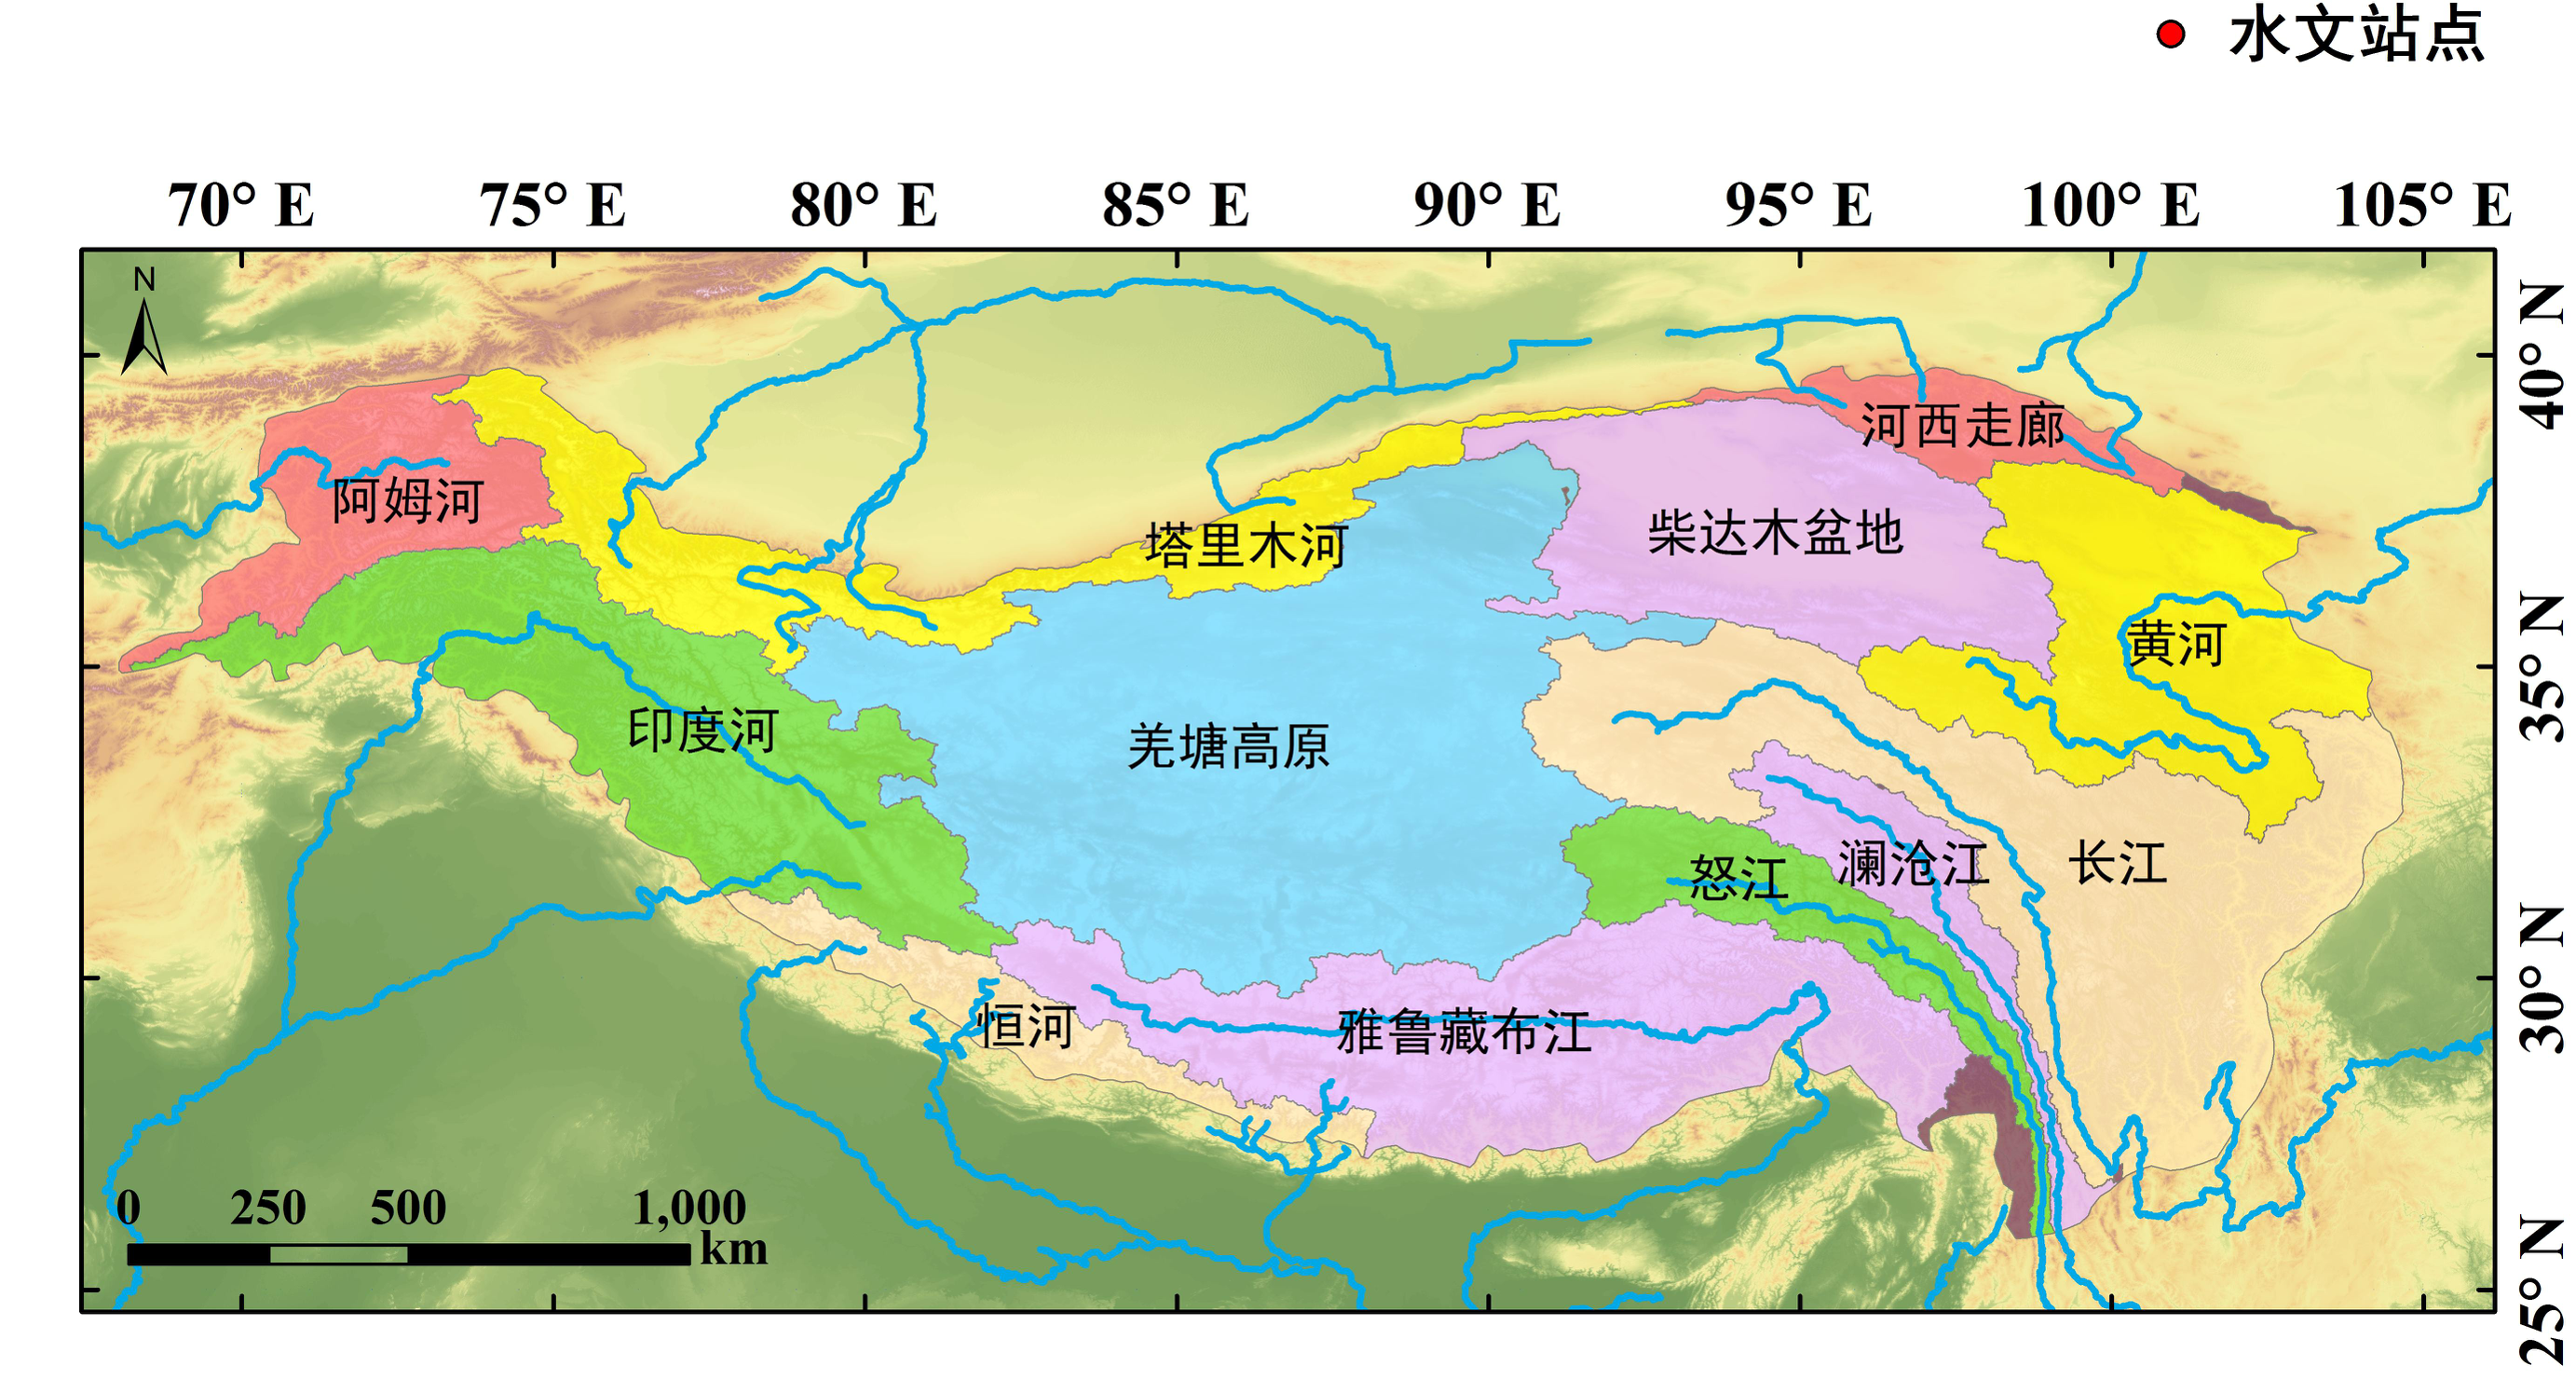
The strong spatial and temporal changes of precipitation often make it impossible to accurately know the spatial distribution and intensity changes of precipitation during the precipitation observation of conventional foundation stations. Satellite microwave remote sensing can overcome this limitation and achieve global scale precipitation and cloud observation. Compared with infrared/visible light, which can only reflect cloud thickness and cloud height, microwave can penetrate the cloud, and also use the interaction between precipitation and cloud particles in the cloud and microwave to detect the cloud and rain more directly. This data use the surface precipitation, obtained by the DPR double wave band precipitation radar carried by GPM, as the true value, soil temperature/humidity of NDVI, DEM and ERA5 as reference data. And the multi-band passive brightness temperature data of GMI is used to invert the instantaneous precipitation intensity during the warm season (May-September) in Tibetan Plateau, then the result is re-sampled to the spatial resolution of 0.1°and accumulated them to a day.
2021-04-09 View Details
The Tibetan Plateau has an average altitude of over 4000 m and is the region with the highest altitude and the largest snow cover in the middle and low latitudes of the Northern Hemisphere regions. Snow cover is the most important underlying surface of the seasonal changes on the Tibetan Plateau and an important composing element of ecological environment. Ice and snow melt water is an important water resource of the plateau and its downstream areas. At the same time, plateau snow, as an important land-surface forcing factor, is closely related to disastrous weather (such as droughts and floods) in East Asia, the South Asian monsoon and in the middle and lower reaches of the Yangtze River. It is an important indicator of short-term climate prediction and one of the most sensitive responses to global climate change. The snow depth refers to the vertical depth from the surface of the snow to the ground. It is an important parameter for snow characteristics and one of the conventional meteorological observation elements. It is the key parameter of snow water equivalent estimation, climate effect studies of snow cover, the basin water balance, the simulation and monitoring of snow-melt, and snow disaster evaluation and grading. In this data set, the Tibetan Plateau boundary was determined by adopting the natural topography as the leading factor and by comprehensive consideration of the principles of altitude, plateau and mountain integrity. The main part of the plateau is in the Tibetan Autonomous Region and Qinghai Province, with an area of 2.572 million square kilometers, accounting for 26.8% of the total land area of China. The snow depth observation data are the monthly maximum snow depth data after quality detection and quality control. There are 102 meteorological stations in the study area, most of which were built during the 1950s to 1970s. The data for some months or years for sites existing during this period were missing, and the complete observational records from 1961 to 2013 were adopted. The temporal resolution is daily, the spatial coverage is the Tibetan Plateau, and all the data were quality controlled. Accurate and detailed plateau snow depth data are of great significance for the diagnosis of climate change, the evolution of the Asian monsoon and the management of regional snow-melt water resources.
2021-04-09 View Details

River lake ice phenology is sensitive to climate change and is an important indicator of climate change. 308 excel file names correspond to Lake numbers. Each excel file contains six columns, including daily ice coverage information of corresponding lakes from July 2002 to June 2018. The attributes of each column are: date, lake water coverage, lake water ice coverage, cloud coverage, lake water coverage and lake ice coverage after cloud treatment. Generally, the ice cover area ratio of 0.1 and 0.9 is used as the basis to distinguish the lake ice phenology. The excel file contained in the data set can further obtain four lake ice phenological parameters: Fus, fue, bus, bue, and 92 lakes. Two parameters, Fus and bue, can be obtained.
2021-04-09 View Details
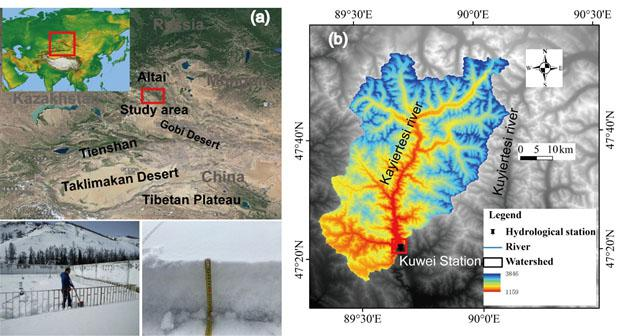
Soluble organic carbon (DOC) in snow and ice can effectively absorb the solar radiation in the ultraviolet and near ultraviolet band, which is also one of the important factors leading to the enhancement of snow and ice ablation. Through the continuous snow samples from November 2016 to April 2017 in Altay area, the data of DOC, TN and BC of snow in kuwei station in Altay area were obtained through the experimental analysis and test with the instrument. The time resolution was weeks and the ablation period was daily. 1. Unit: Doc and TN unit μ g-1 (PPM), BC unit ng g-1 (ppb), MAC unit M2 g-1
2021-03-29 View Details
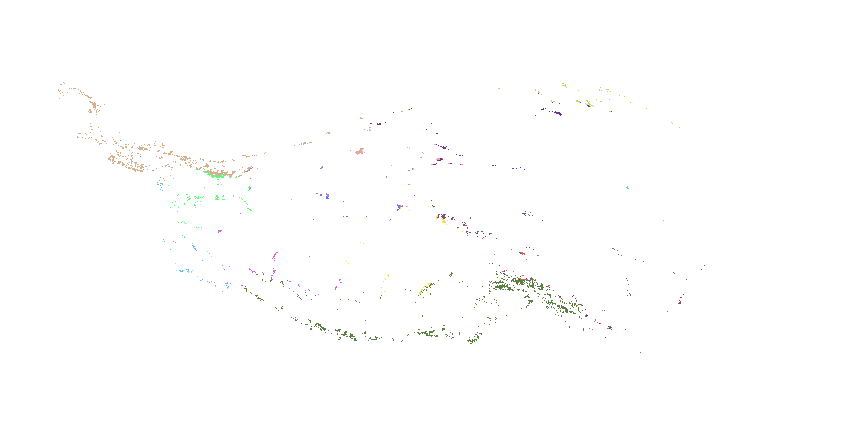
The Tibetan Plateau Glacial Data –TPG2001 is a glacial coverage data on the Tibetan Plateau in around 2000 from 150 scenes of Landsat7 TM/ETM+ images by 30 m spatial resolution. The selected Landsat7 TM/ETM+ images were within the period between 1999 and 2002, including 61 scenes (41%) in 2001 and 47 scenes (31%) in 2000. Among all the images, 71% was taken in winter. The most frequent year in this period was defined as the reference year for the mosaic image: i.e. 2001. Glacier outlines were digitized on-screen manually from the 2001 image mosaic, relying on false-colour image composites (RGB by bands 543), which allowed us to distinguish ice/snow from cloud. Debris-free ice was distinguished from the debris and debris-covered ice by its higher reflectance. Debris-covered ice was not delineated in this data. The delineated glacier outlines were compared with band-ratio (e.g. TM3/TM5) results, and validated by overlapping them onto Google Earth imagery, SRTM DEM, topographic maps and corresponding satellite images. Topographic maps from the 1970s and all available satellite images (including Google EarthTM imagery) were used as base reference data. For areas with mountain shadows and snow cover, they were verified by different methods using data from different seasons. For glaciers in deep shadow, Google EarthTM imagery from different dates was used as the reference for manual delineation. Steep slopes or headwalls were also excluded in the TPG2001. Areas that appeared in any of these sources to have the characteristics of exposed ground/basement/bed rock were manually delineated as non-glacier, and were also cross-checked with CGI-1 and CGI-2. Steep hanging glaciers were included in TPG2001 if they were identifiable on images in all three epochs (i.e. TPG1976, TPG2001, and TPG2013). The accuracy of manual digitization was controlled within one half-pixel. All glacier areas were calculated on the WGS84 spheroid in an Albers equal-area map projection centred at (95°E, 30°N) with standard parallels at 15°N and 65°N. Our results showed that the relative deviation of manual interpretation was less than 3.8%.
2021-01-20 View Details
By applying Supply-demand Balance Analysis, the water resource supply and demand of the whole river basin and each county or district were calculated, on which basis the vulnerability of the water resources system of the basin was evaluated. The IPAT equation was used to set a future water resource demand scenario, setting variables such as future population growth rate, economic growth rate, and unit GDP water consumption to establish the scenario. By taking 2005 as the base year and using assorted forecasting data of population size and economic scale, the future water demand scenarios of various counties and cities from 2010 to 2050 were predicted. By applying the basic structure of the HBV conceptual hydrological model of the Swedish Hydrometeorological Institute, a model of the variation tendency of the basin under climate change was designed. The glacial melting scenario was used as the model input to construct the runoff scenario under climate change. According to the national regulations for the water resources allocation of the basin, a water distribution plan was set up to calculate the water supply comprehensively. Considering the supply and demand situation, the water resource system vulnerability was evaluated by the water shortage rate. By calculating the (grain production) land pressure index of the major counties and cities in the basin, the balance of supply and demand of land resources under the climate change, glacial melt and population growth scenarios was analyzed, and the vulnerability of the agricultural system was evaluated. The Miami formula and HANPP model were used to calculate the human appropriation of net primary biomass and primary biomass in the major counties and cities for the future, and the vulnerability of ecosystems from the perspective of supply and demand balance was assessed.
2021-01-08 View Details
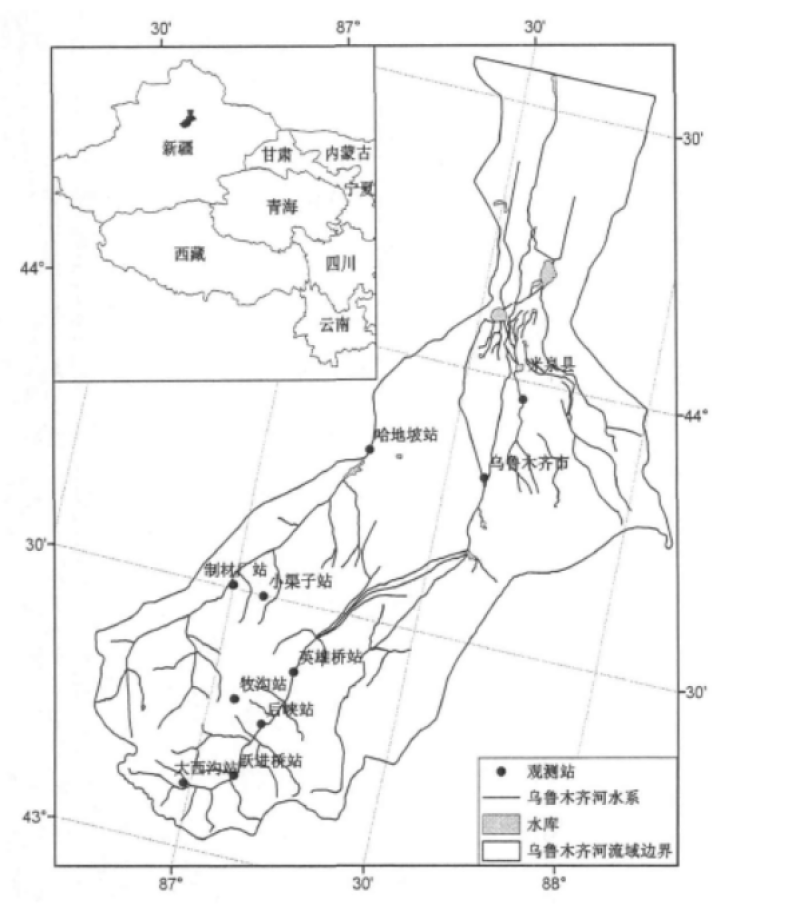
By applying Supply-demand Balance Analysis, the water resource supply and demand of the whole river basin and each county or district were calculated, based on which the vulnerability of the water resources system of the basin was evaluated. The IPAT equation was used to set a future water resource demand scenario, which was to establish the scenario by setting variables such as future population growth rate, economic growth rate, and unit GDP water consumption. By taking 2005 as the base year and using assorted forecasting data of population size and economic scale, the future water demand scenarios of various counties and cities from 2010 to 2050 were predicted. By applying the basic structure of the HBV conceptual hydrological model of the Swedish Hydrometeorological Institute, a model of the variation tendency of the basin under climate change was designed. The glacial melting scenario was used as the model input to construct the runoff scenario under climate change. According to the national regulations of the water resources allocation of the basin, a water distribution plan was set up to calculate the water supply comprehensively. Considering the supply and demand situation, the water resource system vulnerability was evaluated by the water shortage rate. By calculating the (grain production) land pressure index of the major counties and cities in the basin, the balance of supply and demand of land resources under the climate change, glacial melt and population growth scenarios was analyzed, and the vulnerability of the agricultural system was evaluated. The Miami formula and HANPP model were used to calculate the human appropriation of net primary biomass and primary biomass in the major counties and cities for the future, and the vulnerability of ecosystems from the perspective of supply and demand balance was assessed.
2021-01-08 View Details
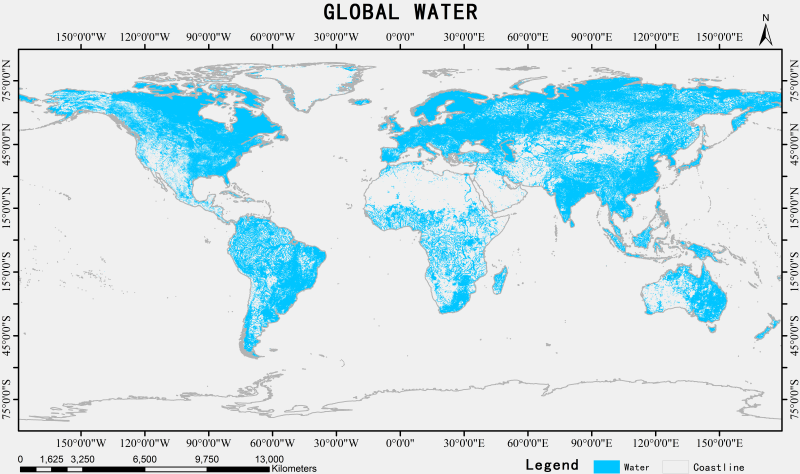
River and lake resources are important components for studying the Earth ecological environment, affecting global ecosystems, heat, material exchange and balance and serving as an important basis for studying changes in the global environmental mechanism. At present, the lack of global lake vector data with large-scale, high-precision, and large-range has hindered hydrological research on rivers and lakes. Taking the data collection of global rivers and lakes of Jun Chen as the source data and combining the domestic high-resolution image GF data of 2 to 3 years before and after 2010, a data set of global rivers and lakes was generated. This data set makes up for the shortcomings of low precision in some areas and is an editable lake and river vector data set with high accuracy.
2020-12-22 View Details
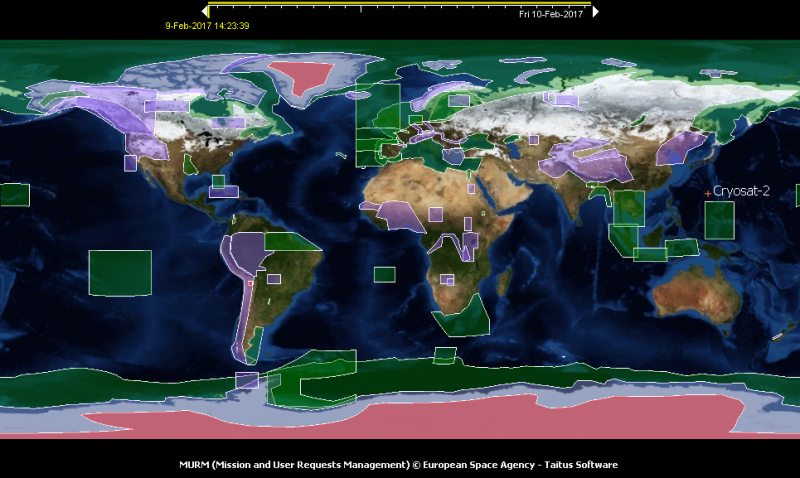
The global Cryosat-2 GDR dataset is generated by the European Space Agency (ESA); it has a temporal coverage from 2010 to 2016 and covers the globe. On April 8, 2010, the ESA launched the Cryosat-2 high-tilt polar orbit satellite. The satellite is equipped with an SAR Interferometer Radar Altimeter (SIRAL), which is mainly used to monitor polar ice thickness and sea ice thickness changes, and, furthermore, to study the effects of melting polar ice on global sea level rise and that of global climate change on Antarctic ice thickness. The altimeter operates in the Ku-band and at a frequency of 13.575 GHz, it includes three measurement modes. One is a low-resolution altimeter measurement mode (LRM) that points to the subsatellite point to obtain all surface observations for land, sea, and ice sheets; its processing is similar to ENVISAT/RA-2, with an orbital resolution of 5 to 7 km. The second is the Synthetic Aperture Radar (SAR) measurement mode, which is mainly used to improve the accuracy and resolution of sea ice observations; it can make the resolution along the orbit reach approximately 250 m. The third is the Interferometric Synthetic Aperture Radar (InSAR), which is mainly used to improve the accuracy of areas with complex terrain such as the edges of ice sheets or ice shelves. The CryoSat -2/SIRAL data products mainly include 0-level data, 1b-level data, 2-level data and high-level data. The Cryosat-2/SIRAL products consist of two files: an XML head file (.HDR) and a data product file (.DBL). The HDR file is an auxiliary ASCII file for fast identification and retrieval of the data files. 1b-level products are stored separately according to the measurement modes, and the data recording formats of different modes are also different. Each waveform in LRM mode and SAR mode has 128 sampling points, while that in SARIn mode has 512 sampling points. 2-level GDR products are available for most scientific applications, including measurement time, geographic location, altitude, and more. In addition, the altitude information in GDR products has been obtained through instrumental calibration, transmission delay corrections, geometric corrections, and geophysical corrections (such as atmospheric corrections and tidal corrections). The GDR products are single global full-track data, that is, the measurement results of the three modes. After different processing, they are combined in chronological order; thereby, the data recording formats are unified. The data in the three modes use different waveform retracking algorithms to obtain altitude values. In the latest updated Baseline C data, the LRM mode data use three algorithms: Refined CFI, UCL and Refined OCOG.
2020-12-17 View Details
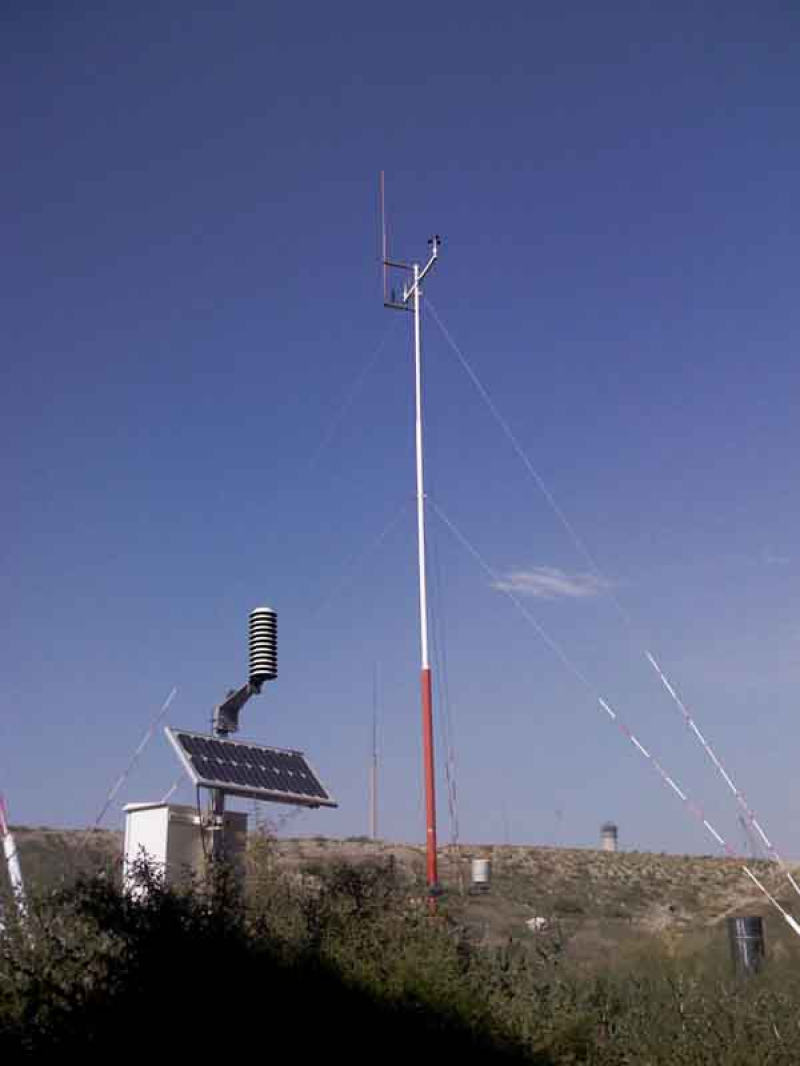
The China Meteorological Forcing Dataset (CMFD) is a high spatial-temporal resolution gridded near-surface meteorological dataset that was developed specifically for studies of land surface processes in China. The dataset was made through fusion of remote sensing products, reanalysis dataset and in-situ observation data at weather stations. Its record starts from January 1979 and keeps extending (currently up to December 2018) with a temporal resolution of three hours and a spatial resolution of 0.1°. Seven near-surface meteorological elements are provided in CMFD, including 2-meter air temperature, surface pressure, specific humidity, 10-meter wind speed, downward shortwave radiation, downward longwave radiation and precipitation rate.
2020-11-13 View Details
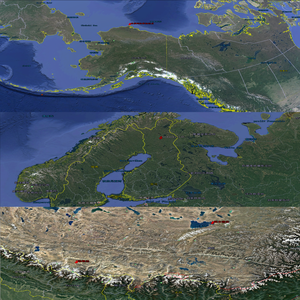
Solar radiation data were obtained using the internationally accepted solar radiation meter (LI200SZ, LI-COR, Inc., USA). The measured data are total solar radiation, including direct and diffuse solar radiation, with a wavelength range of 400-1100 nm. The units of the measurement results are W/㎡, and the typical error under natural lighting is ±3% (within an incident angle of 60°). Data from different locations in the three poles (Everest Station and Namco Station on the Tibetan Plateau, Sodankylä Station in the Arctic, and Dome A Station in the Antarctic) are derived from site cooperation and website downloads. The temporal coverage of data from the Everest Station and Namco Station on the Tibetan Plateau is from 2009 to 2016, that from the Sodankylä Station in the Arctic is from 2001 to 2017, and that from the Dome A Station in the Antarctic is from 2005 to 2014.
2020-10-14 View Details
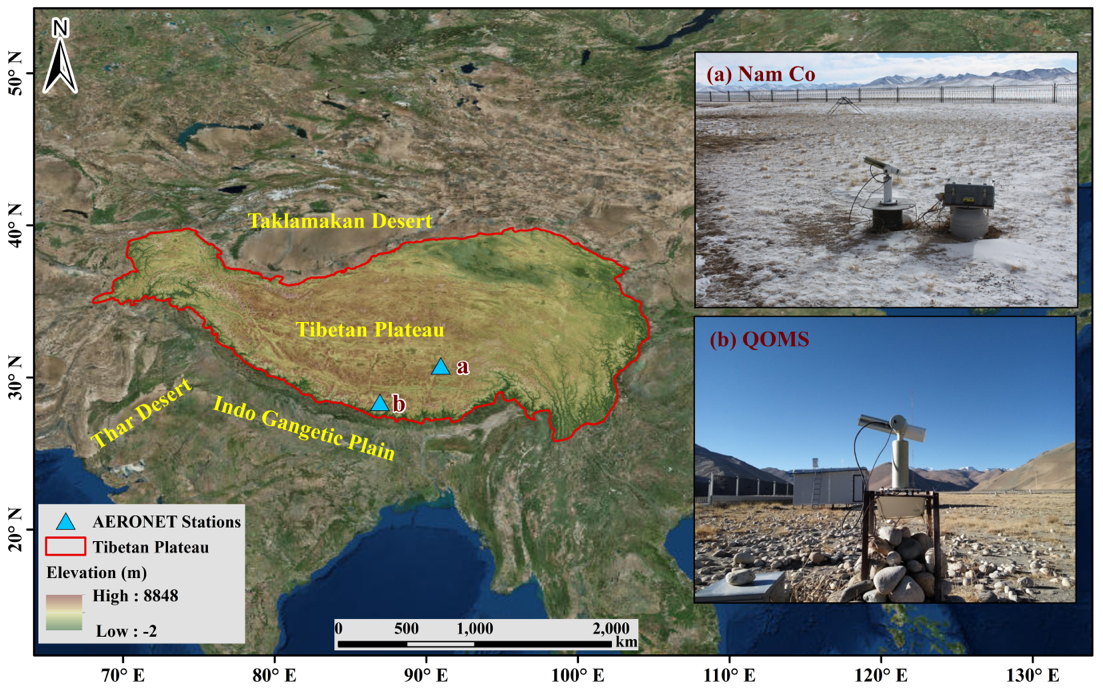
The aerosol optical thickness data of Qomolangma station and Namuco station in the Qinghai Tibet Plateau is based on the observation data products of Qomolangma station and Namuco station from the atmospheric radiation view of the Institute of Qinghai Tibet Plateau of the Chinese Academy of Sciences. The data coverage time is from 2017 to 2019, the time resolution is hour by hour, the coverage sites are Qomolangma station and Namuco station, the longitude and latitude coordinates are (Qomolangma station: 28.365n, 86.948e, Namuco station Mucuo station: 30.7725n, 90.9626e). The source of the observed data is retrieved from the radiation data observed by mfrsr instrument. The characteristic variable is aerosol optical thickness, and the error range of the observed inversion is about 15%. The data format is TXT.
2020-10-14 View Details
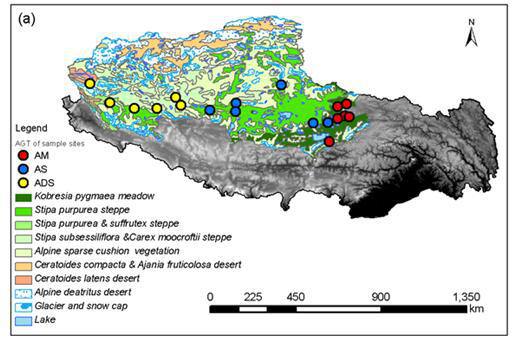
Vegetation survey data is essential to study the structure and function of the ecosystems. The North Tibet is abundant in grassland ecosystems, including alpine meadow, alpine grassland, and alpine degraded grassland. Due to the unique geographical location, high altitude and anoxic environment, the community survey data in the North Tibetan Plateau is relatively rare. Based on the accumulation of preliminary work, the research team carried out a more comprehensive vegetation survey in 15 counties of the North Tibetan Plateau in the growing season of 2017. This data set includes biomass data inside and outside the fences of the 23 sampling plots from Nagqu to Ritu of the North Tibet Transect. This data set can be used for productivity spatial analysis and mode calibration.
2020-10-14 View Details
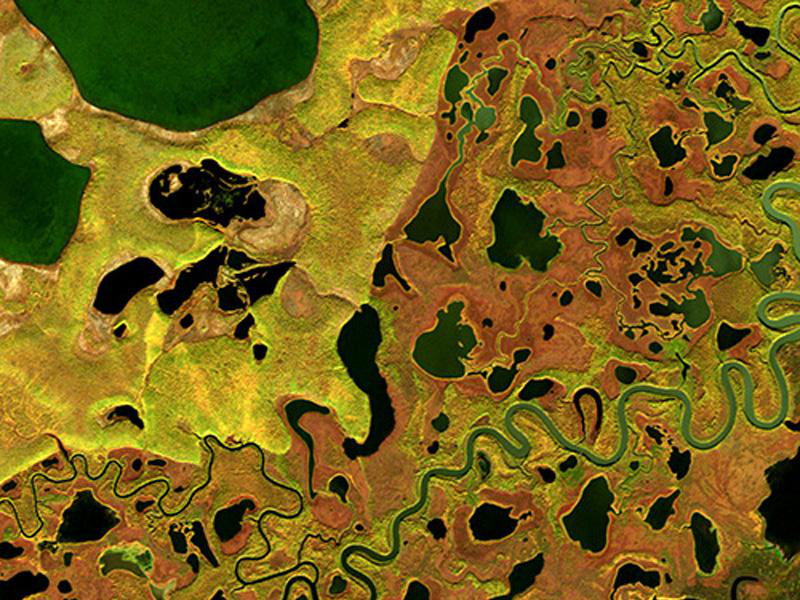
Lake ice phenology is a seasonal cyclical feature that describes lake ice coverage. The change of lake ice phenology is an important part of carbon, water and energy process study, and one of the sensitive factors of climate change. This dataset is a lake ice phenology based on passive microwave inversion, including lake ice phenology of 200 lakes in the Tibetan Plateau and high latitudes area of the Northern Hemisphere from 2002 to 2018 (including freeze-up start date, freeze-up end date, break-up start date, and break-up end date of the lakes), data of some lakes can date back to 1978. This data is basically consistent with the MODIS monitoring results from the same time with an interpretation error of 2-4 days. Users can use this data to conduct climate change study in the Northern Hemisphere.
2020-10-13 View Details
Contact Support
Links
National Tibetan Plateau Data CenterFollow Us

A Big Earth Data Platform for Three Poles © 2018-2020 No.05000491 | All Rights Reserved
|  No.11010502040845
Tech Support: westdc.cn