
Brief Introduction:The Tibetan Plateau, known as the " third pole " of the earth, has always been the focus of attention of the international community because it is an important area driving global environmental change research and has a profound regulatory effect on the ecology, environment and climate of the whole earth. Under the background of global warming, the cryosphere elements such as tripolar glaciers, frozen soils, and freeze-thaw lakes have undergone significant changes, with glaciers shrinking rapidly and permafrost active layers thickening. For a long time, China has carried out systematic and multidisciplinary research in the world ' s third pole with the Qinghai-Tibet Plateau as the main body, forming a rich research accumulation.
Publish Datetime:2022-12-13
Number of Datasets:184
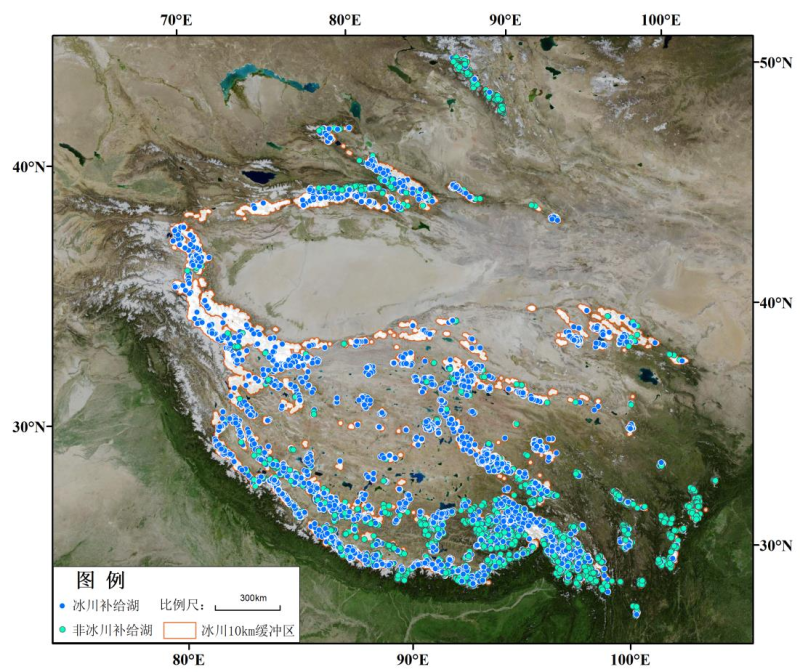
This data set is based on China's second inventory data, Landsat series optical image data with a spatial resolution of 30 meters and cloud coverage of less than 10% and SRTM and other data using ArcGIS, ENVI, Google Earth and other processing software and extracting the glacial lake boundary within 10 km of the glacier boundary by artificial visual interpretation. In addition, the data set adds attributes such as glacial lake type, the mountain range, the province, and the basin to the data as well as quality checking and accuracy verification for the interpreted data. The spatial resolution is 30 meters. It consists of two parts: the glacial lake distribution area vector file and the Inventory Data set of glacial lakes in west China in 2015. It can provide reference data for glacial lake-glacier coupling, water resource utilization and management in west China and can also be used as basic data for regional climate change and cryospheric studies.
2019-09-15 View Details
The project “The impact of the frozen soil environment on the construction of the Qinghai-Tibet Railway and the environmental effects of the construction” is part of the “Environmental and Ecological Science in West China” programme supported by the National Natural Science Foundation of China. The person in charge of the project is Wei Ma, a researcher at the Cold and Arid Regions Environmental and Engineering Research Institute, Chinese Academy of Sciences. The project ran from January 2002 to December 2004. Data collected in this project included the following: Monitoring data of the active layer in the Beiluhe River Basin (1) Description of the active layer in the Beiluhe River Basin (2) Subsurface moisture data from the Beiluhe River Basin, 2002.9.28-2003.8.10 (Excel file) * Site 1 - Grassland moisture data * Site 2 – Removed turf moisture data * Site 3 - Natural turf moisture data * Site 4 - Gravel moisture data * Site 5 - Insulation moisture data (3) Subsurface temperature data from the Beiluhe River Basin, 0207-0408 Excel file * Temperature data for the ballast surface * Temperature data for insulation materials * Temperature data for a surface without vegetation * Temperature data for a grassland surface * Temperature data for a grit and pebble surface Data on the impact of construction on the ecological environment were obtained at Fenghuoshan, Tuotuohe, and Wudaoliang. Sample survey included plant type, abundance, community coverage, total coverage, aboveground biomass ratio and soil structure. The moisture content at different depths of the soil was detected using a time domain reflectometer (TDR). A set of soil samples was collected at a depth of 0-100 cm at each sample site. An EKKO100 ground-penetrating radar detector was used to continuously sample 1-1.5 km long sections parallel to the road to determine the upper limit depth of the frozen soil. 3. Predicted data: The temperature of the frozen soil at different depths and times was predicted in response to temperature increases of 1 degree and 2 degrees over the next 50 years based on initial surface temperatures of -0.5, -1.5, -2.5, -3.5, and -4.5 degrees. 4. The frozen soil parameters of the Qinghai-Tibet Railway were as follows: location, railway mileage, total mileage (km), frozen soil type mileage, mileage of zones with an average temperature conducive to permafrost, frozen soil with high temperatures and high ice contents, frozen soils with high temperatures and low ice contents, frozen soils with low temperatures and high ice contents, frozen soils with low temperatures and low ice contents, and melting area.
2019-09-14 View Details
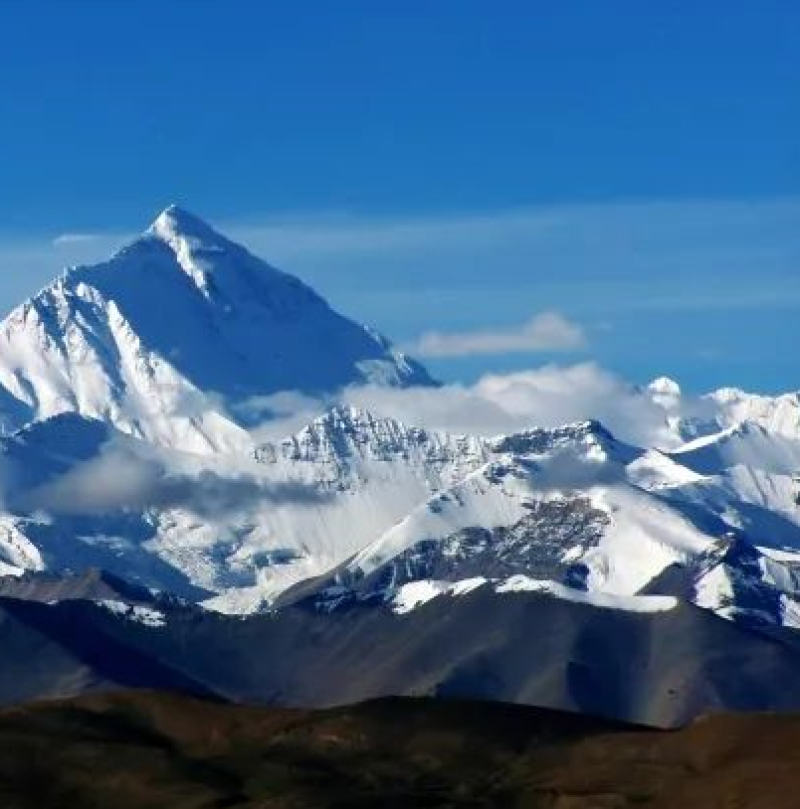
The data set collects the long-term monitoring data on atmosphere, hydrology and soil from the Integrated Observation and Research Station of Multisphere in Namco, the Integrated Observation and Research Station of Atmosphere and Environment in Mt. Qomolangma, and the Integrated Observation and Research Station of the Alpine Environment in Southeast Tibet. The data have three resolutions, which include 0.1 seconds, 10 minutes, 30 minutes, and 24 hours. The temperature, humidity and pressure sensors used in the field atmospheric boundary layer tower (PBL) were provided by Vaisala of Finland. The wind speed and direction sensor was provided by MetOne of the United States. The radiation sensor was provided by APPLEY of the United States and EKO of Japan. Gas analysis instrument was provided by Licor of the United States, and the soil moisture content, ultrasonic anemometer and data collector were provided by CAMPBELL of the United States. The observing system is maintained by professionals on a regular basis (2-3 times a year), the sensors are calibrated and replaced, and the collected data are downloaded and reorganized to meet the meteorological observation specifications of the National Weather Service and the World Meteorological Organization (WMO). The data set was processed by forming a time continuous sequence after the raw data were quality-controlled, and the quality control included eliminating the systematic error caused by missing data and sensor failure.
2019-09-14 View Details
The research area is located in the middle section o the northern slope of the Tianshan Mountains. The research area extends from Wusu in the Tacheng District of Xinjiang in the west to Mulei County in Changji Prefecture in the east. It is approximately 500 km long from east to west. The vertical vegetation gradient on the northern slope of the Tianshan Mountains can be divided into six different belts: alpine cushion vegetation belt (>3400 m), sub-alpine meadow belt (3400~2700 m), mid-mountain forest belt (2700~1720 m), forest steppe belt (1720~1300 m), semi-desert belt (1300~700 m) and typical desert belt (<700 m). Based on the characteristics of the vertical vegetation belts on the northern slope of the Tianshan Mountains, five sedimentary sections with different elevations, different vegetation belts and different sedimentary ages were selected for analysis. Five mid-late Holocene sections were measured to calculate the composite dissimilarity index of sporopollen, and the index was used to explain the sporopollen diversity. The index was then combined with integrated multiple analysis data, such as particle size, magnetic susceptibility, and ignition loss, and the changes in biodiversity and environmental characteristics since the mid-late Holocene in the area were assessed. The data include the following: 1. Sporopollen grain number data for the Daxigou section (8-110 cm, a total of 52 layers were analysed for sporopollen grain number, 3640±60 a BP to 890±60 a BP) 2. Sporopollen grain number data for the Xiaoxigou section (0-90 cm, a total of 38 layers were analysed for sporopollen grain number, 3240±60 a BP) 3. Sporopollen grain number data for the Huashuwozi section (0-106 cm, a total of 52 layers were analysed for sporopollen grain number, 2170±185 a BP to 450±155 a BP) 4. Sporopollen grain number data for the Sichanghu section (10-84 cm, a total of 19 layers were analysed for sporopollen grain number, 1000±50 a BP to 665±65 a BP) 5. Sporopollen grain number data for the Dongdaohaizi section (0-190 cm, a total of 64 layers were analysed for sporopollen grain number, 4500±310 a BP to 305±130 a BP) For detailed descriptions of the data, please refer to the following study: "Palaeo-biodiversity at the Northern Piedmont of Tianshan Mountains in Xinjiang During the Middle to Late Holocene"
2019-09-13 View Details
The project studying the evolution pattern and development trend of the arid environment in western China was a major research component of the project Environmental and Ecological Science for West China, which was funded by the National Natural Science Foundation of China. The leading executive of the project was Academician Zhisheng An from the Institute of Earth Environment of the Chinese Academy of Sciences. The project ran from January 2002 to December 2004. The data collected by the project include the following: 1. History and variability data for arid regions in western China: 1) Chinese Loess Plateau mass accumulation rate data (3600-0 kyr BP): Fields include age and mass accumulation rate (MAR) (txt file). 2) Chinese Loess Plateau grain size and magnetic susceptibility data (3600-0 kyr BP): Fields include age, stacked mean grain size, and stacked magnetic susceptibility (txt file). 2. Sporopollen content data of different loess strata since 12 kyr BP in the Yaozhou District of Shanxi Province (excel table): The distributions of 27 species of sporopollen (0-397 cm) from 67 different layers of loess samples are included. 3. 10Be record data (table) 10Be concentration, magnetic susceptibility and bulk density data of loess with different thicknesses (79.67- 0.09 kyr BP). 4. Simulation data on the modulation of the East Asian monsoon resulting from orbital variability driven by the uplift of the Tibetan Plateau: ah0-sum.nc nc file, hh0-sum.nc nc file, jfh0-sum.nc nc file, kdh0-sum.nc nc file, lfh0-sum.nc nc file, mask.nc nc file, phis.nc nc file.
2019-09-13 View Details
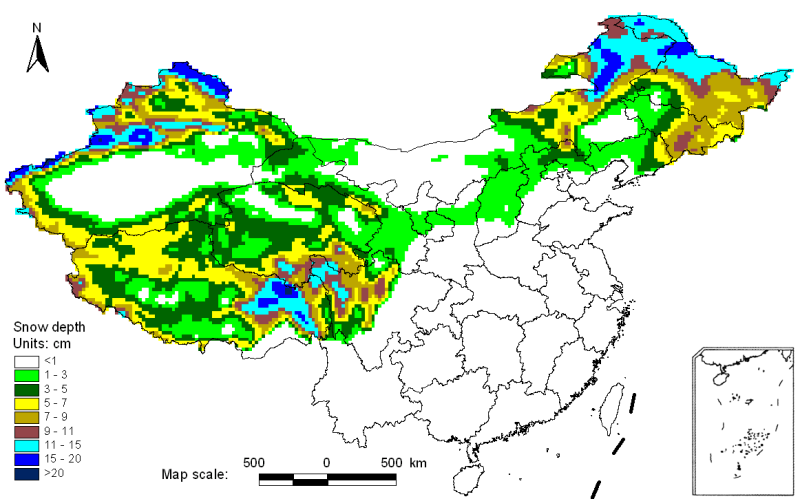
This data set provides daily snow thickness distribution data of China from October 24, 1978 to December 31, 2012, with a spatial resolution of 25km.The original data used for the inversion of the snow depth data set came from SMMR (1978-1987), SSM/I (1987-2008) and amsr-e (2002-2012) daily passive microwave bright temperature data processed by the national snow and ice data center (NSIDC).As the three sensors are mounted on different platforms, there is a certain system inconsistency in the obtained data.The time consistency of bright temperature data is improved by cross calibration of bright temperature of different sensors.Then, based on Chang algorithm, Dr. Che tao is used to carry out snow depth inversion.Refer to the data description document for specific inversion methods.
2019-09-13 View Details
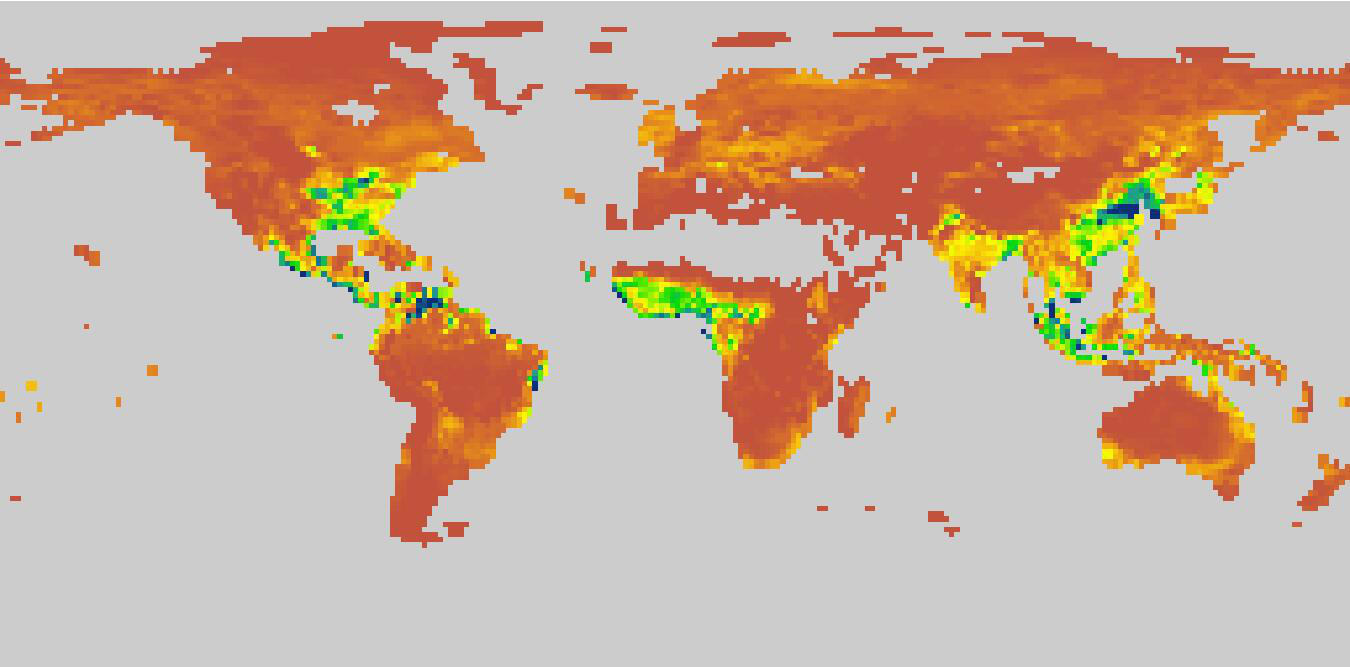
The data set is the global ecosystem respiratory data, including the ecosystem autotrophic respiration (Ra) and heterotrophic respiration (Rh). It was obtained by the CNRM-CM6-1 mode simulation of CMIP6 under the Historical scenario. The time range of the data covers from 1850 to 2014, the time resolution is a month, and the spatial resolution is about 1.406°×1.389°. For the simulated data details, please go to the following link: http://www.umr-cnrm.fr/cmip6/spip.php?article11.
2019-09-13 View Details
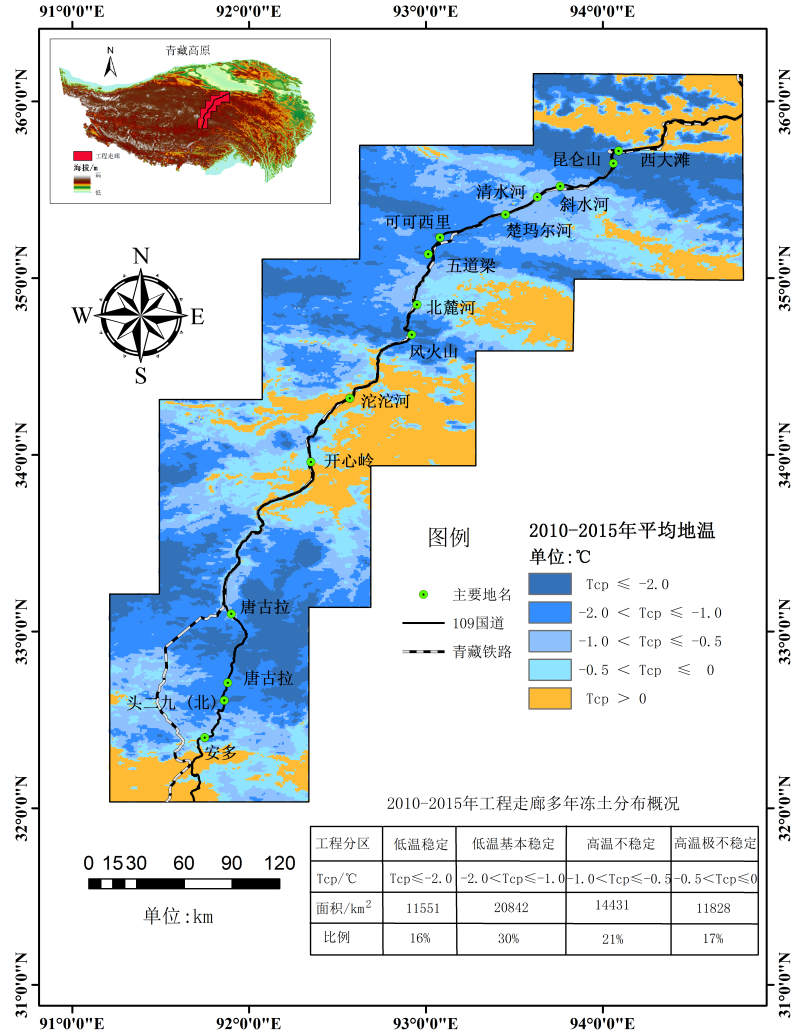
The GIPL2.0 frozen soil model was used to simulate the average ground temperature distribution map of the Qinghai-Tibet Engineering Corridor. The model required to synthesize temperature data set of time series. In addition, the temperature data were divided into two phases according to the time spans, which were 1980-2009 and 2010-2015. The data of the first phase were from the Chinese meteorological driving data set (http://dam. Itpcas.ac.cn/rs/?q=data#CMFD_0.1), the data of the second phase were the application of MODIS surface temperature products (MOD11A1/A2 and MYD11A1/A2) with a spatial resolution of 1 km. In addition, the soil type data required by the model came from the China Soil Database (V1.1) and have a resolution of 1 km. At the same time, the topography was also considered. The research area was classified into 88 types based on the measured soil thermophysical parameters and land cover types, and then the simulation was performed. The annual average ground temperature simulation results were compared with the field measured data, and the results showed that they were highly consistent. The simulation results show that the annual average ground temperature is lower than -2.0 °C in high mountain areas such as Kunlun Mountain and Tanggula Mountain, while that in the higher river valleys such as Tuotuohe is above 0 °C. In the high plain areas (such as Beiluhe Basin and Wudaoliang Basin), the annual average ground temperatures are between -2.0 °C and 0 °C. If taking an annual average ground temperature lower than 0 °C as the threshold for the presence or absence of permafrost, the permafrost of the Qinghai-Tibet Engineering Corridor accounts for 78.9% of the entire area. In the meantime, according to the different ground temperatures, the frozen soils of the Qinghai-Tibet Engineering Corridor are divided into four types: low-temperature stable permafrost, low-temperature basically stable permafrost, high-temperature unstable permafrost and high-temperature extremely unstable permafrost.
2019-09-13 View Details

This data set contains the daily values of temperature, air pressure, relative humidity, wind speed, precipitation, and total radiation observed at the Namco station from 1 October 2005 to 31 December 2016. The data set was processed as a continuous time series after the original data were quality controlled. After the systematic error caused by missing data points and sensor failure was eliminated, the data set reaches the accuracy of raw meteorological observation data required by the National Weather Service and the World Meteorological Organization (WMO). The data can provide information for professionals engaged in scientific research and training related to atmospheric physics, atmospheric environment, climate, glaciers, frozen soils and other disciplines. This data set has mainly been applied in the fields of glaciology, climatology, environmental change, cold zone hydrological processes, frozen soil science, etc. The measured parameters had the following units and accuracies: Air temperature, unit: °C, accuracy: 0.1 °C; air relative humidity, unit: %, accuracy: 0.1%; wind speed, unit: m/s, accuracy: 0.1 m/s; wind direction, unit: °, accuracy: 0.1 °; air pressure, unit: hPa, accuracy: 0.1 hPa; precipitation, unit: mm, accuracy: 0.1 mm; total radiation, unit: W/m2, accuracy: 0.1 W/m2.
2019-09-12 View Details
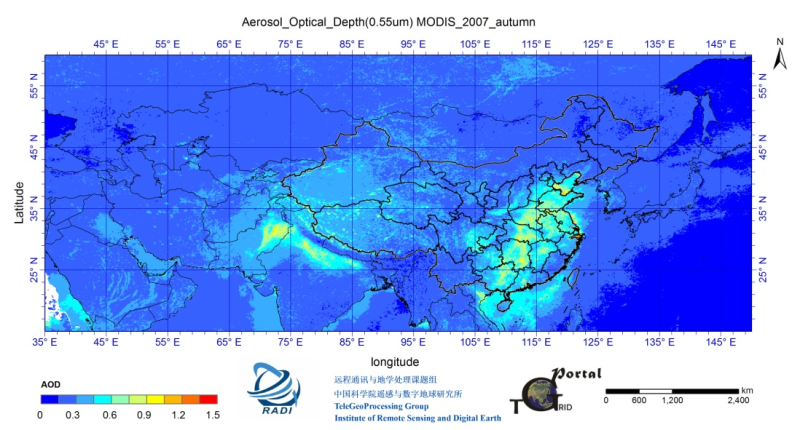
The “China Collection 1.0" aerosol optical depth (AOD) data set was produced using visible light wave remote sensing inversion. The raw data come from the MODIS sensors on Terra and Aqua. The temporal coverage of the data is from 2002 to 2011, the temporal resolution is daily, the spatial coverage is the Asian continent, and the spatial resolution is 0.1°. The remote sensing inversion method uses the independently developed SRAP algorithm to invert the aerosol optical depth over the land. The algorithm takes the BRDF characteristics of the surface into consideration, which makes it applicable to aerosol optical depth inversion on bright and dark surfaces. In addition, aerosol products over the ocean of MOD04/MYD04 are superimposed. The verification of the measured site shows that the relative deviation of the aerosol optical depth data in Asia is within 20%. The data are stored as an hdf file each day, each consisting of Terra AOD and Aqua AOD at 550 nm.
2019-09-12 View Details
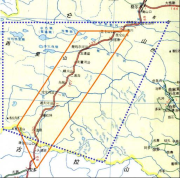
The GAME/Tibet project conducted a short-term pre-intensive observing period (PIOP) at the Amdo station in the summer of 1997. From May to September 1998, five consecutive IOPs were scheduled, with approximately one month per IOP. More than 80 scientific workers from China, Japan and South Korea went to the Tibetan Plateau in batches and carried out arduous and fruitful work. The observation tests and plans were successfully completed. After the completion of the IOP in September, 1998, five automatic weather stations (AWS), one Portable Atmospheric Mosonet (PAM), one boundary layer tower and integrated radiation observatory (Amdo) and nine soil temperature and moisture observation stations have been continuously observed to date and have obtained extremely valuable information for 8 years and 6 months consecutively (starting from June 1997). The experimental area is located in Nagqu, in northern Tibet, and has an area of 150 km × 200 km (Fig. 1), and observation points are also established in D66, Tuotuohe and the Tanggula Mountain Pass (D105) along the Qinghai-Tibet Highway. The following observation stations (sites) are set up on different underlying surfaces including plateau meadows, plateau lakes, and desert steppe. (1) Two multidisciplinary (atmosphere and soil) observation stations, Amdo and NaquFx, have multicomponent radiation observation systems, gradient observation towers, turbulent flux direct measurement systems, soil temperature and moisture gradient observations, radiosonde, ground soil moisture observation networks and multiangle spectrometer observations used as ground truth values for satellite data, etc. (2) There are six automatic weather stations (D66, Tuotuohe, D105, D110, Nagqu and MS3608), each of which has observations of wind, temperature, humidity, pressure, radiation, surface temperature, soil temperature and moisture, precipitation, etc. (3) PAM stations (Portable Automated Meso - net) located approximately 80 km north and south of Nagqu (MS3478 and MS3637) have major projects similar to the two integrated observation stations (Amdo and NaquFx) above and to the wind, temperature and humidity turbulence observations. (4) There are nine soil temperature and moisture observation sites (D66, Tuotuohe, D110, WADD, NODA, Amdo, MS3478, MS3478 and MS3637), each of which has soil temperature measurements of 6 layers and soil moisture measurement of 9 layers. (5) A 3D Doppler Radar Station is located in the south of Nagqu, and there are seven encrypted precipitation gauges in the adjacent (within approximately 100 km) area. The radiation observation system mainly studies the plateau cloud and precipitation system and serves as a ground true value station for the TRMM satellite. The GAME-Tibet project seeks to gain insight into the land-atmosphere interaction on the Tibetan Plateau and its impact on the Asian monsoon system through enhanced observational experiments and long-term monitoring at different spatial scales. After the end of 2000, the GAME/Tibet project joined the “Coordinated Enhanced Observing Period (CEOP)” jointly organized by two international plans, GEWEX (Global Energy and Water Cycle Experiment) and CL IVAR (Climate Change and Forecast). The Asia-Australia Monsoon Project (CAMP) on the Tibetan Plateau of the Global Coordinated Enhanced Observation Program (CEOP) has been started. The data set contains POP data for 1997 and IOP data for 1998. Ⅰ. The POP data of 1997 contain the following. 1. Precipitation Gauge Network (PGN) 2. Radiosonde Observation at Naqu 3. Analysis of Stable Isotope for Water Cycle Studies 4. Doppler radar observation 5. Large-Scale Hydrological Cycle in Tibet (Link to Numaguchi's home page) 6. Portable Automated Mesonet (PAM) [Japanese] 7. Ground Truth Data Collection (GTDC) for Satellite Remote Sensing 8. Tanggula AWS (D105 station in Tibet) 9. Syamboche AWS (GEN/GAME AWS in Nepal) Ⅱ. The IOP data of 1998 contain the following. 1. Anduo (1) PBL Tower, 2) Radiation, 3) Turbulence SMTMS 2. D66 (1) AWS (2) SMTMS (3) GTDC (4) Precipitation 3. Toutouhe (1) AWS (2) SMTMS (3 )GTDC 4. D110 (1) AWS (2) SMTMS (3) GTDC (4) SMTMS 5. MS3608 (1) AWS (2) SMTMS (3) Precipitation 6. D105 (1) Precipitation (2) GTDC 7. MS3478(NPAM) (1) PAM (2) Precipitation 8. MS3637 (1) PAM (2) SMTMS (3) Precipitation 9. NODAA (1) SMTMS (2) Precipitation 10. WADD (1) SMTMS (2) Precipitation (3) Barometricmd 11. AQB (1) Precipitation 12. Dienpa (RS2) (1) Precipitation 13. Zuri (1) Precipitation (2) Barometricmd 14. Juze (1) Precipitation 15. Naqu hydrological station (1) Precipitation 16. MSofNaqu (1) Barometricmd 16. Naquradarsite (1)Radar system (2) Precipitation 17. Syangboche [Nepal] (1) AWS 18. Shiqu-anhe (1) AWS (2) GTDC 19. Seqin-Xiang (1) Barometricmd 20. NODA (1)Barometricmd (2) Precipitation (3) SMTMS 21. NaquHY (1) Barometricmd (2) Precipitation 22. NaquFx(BJ) (1) GTDC(2) PBLmd (3) Precipitation 23. MS3543 (1) Precipitation 24. MNofAmdo (1) Barometricmd 25. Mardi (1) Runoff 26. Gaize (1) AWS (2) GTDC (3) Sonde A CD of the data GAME-Tibet POP/IOP dataset cd (vol. 1) GAME-Tibet POP/IOP dataset cd (vol. 2)
2019-09-12 View Details

The data set recorded the total investment in fixed assets in Qinghai from 1980 to 2016. The data were derived from the Qinghai Society and Economics Statistical Yearbook and the Qinghai Statistical Yearbook. The accuracy of the data is consistent with that of the statistical yearbook. The table contains 11 fields. Field 1: Year Interpretation: Year of the data Field 2: Total Interpretation: Total investment in fixed assets Unit: 100,000,000 yuan Field 3: State-owned economy Interpretation: State-owned economic investment in fixed assets Unit: 100,000,000 yuan Field 4: Collective Economy Interpretation: Collective economic investment in fixed assets Unit: 100,000,000 yuan Field 5: Individual Economy Interpretation: Individual economic investment in fixed assets Unit: 100,000,000 yuan Field 6: Other types of economy Interpretation: Other economic investment in fixed assets Unit: 100,000,000 yuan Field 7: Total Growth Interpretation: Total growth of investment in fixed assets Unit: % Field 8: State-owned growth Interpretation: Growth of state-owned economic investment in fixed assets Unit: % Field 9: Collective growth Interpretation: Growth of collective economic investment in fixed assets Unit: % Field 10: Individual Growth Interpretation: Growth of individual economic investment in fixed assets Unit: % Field 11: Other growth Interpretation: Growth of other economic investment in fixed assets Unit: %
2019-09-12 View Details

The scanned picture of the Map of Snow Ice and Frozen Ground in China (1:4,000,000) (Shi Yafeng, Meidesheng, 1988) is geometrically corrected and then digitized in the data set, and by taking altitude and latitude into account in combination with the continuity of permafrost, the frozen soil is divided into the predominant permafrost of high-latitude permafrost, island talik permafrost and island permafrost; high-altitude permafrost and mountain permafrost (including Altai, Tianshan Mountain, Qilian Mountain, Hengduan, the Himalayas and Taibai Mountain in East China, Huanggangliang and Changbai Mountain), and the plateau permafrost (the Tibetan Plateau), which is divided into predominant permafrost and island permafrost; and seasonal frozen soil, instantaneous frozen soil and nonfrozen areas.
2019-09-12 View Details
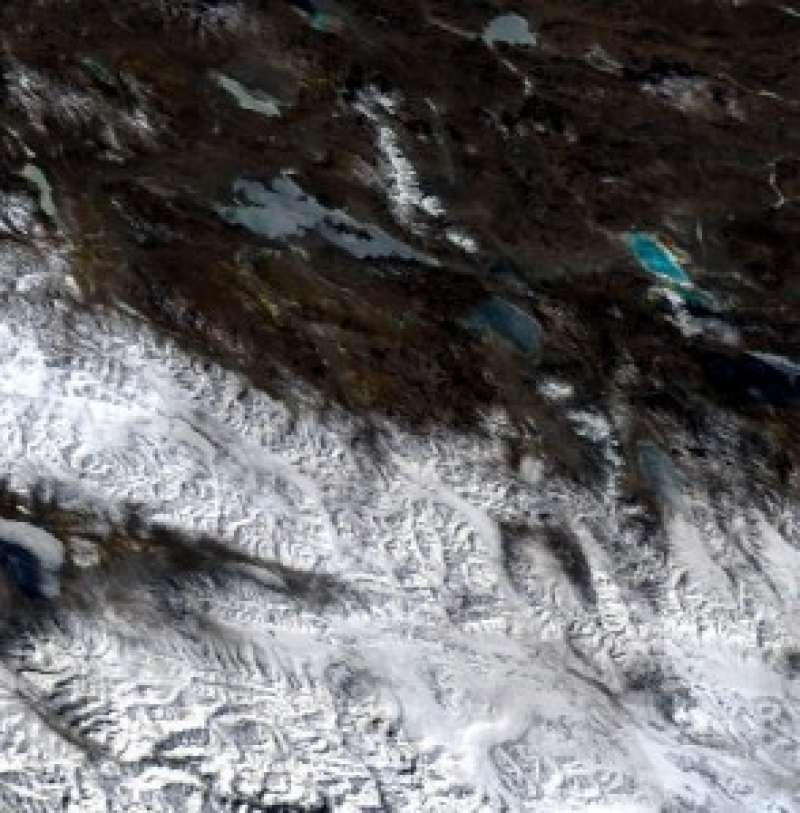
The parameter inversion study project of soil moisture and snow water equivalent on the Tibetan Plateau in the past 20 years is part of the key research plan of Environmental and Ecological Science for West China of the National Natural Science Foundation of China. The person in charge is Jiancheng Shi, a researcher at the Institute of Remote Sensing Applications of the Chinese Academy of Sciences. The project ran from January 2004 to December 2007. The data collection of the project: the Monthly MODIS Snow Cover Product of Tibetan Plateau (2001-2005). Based on the image data acquired by MODIS, combined with ASTER image data, the data set carried out snow cover area classification and change analysis at a subpixel level on the Tibetan Plateau. The research mainly focused on studying the subpixel snow cover area classification algorithm, including the statistical regression method and the mixed-pixel decomposition method using the normalized snow index. In the mixed-pixel decomposition, a linear mixed model was adopted, and snow and non-snow end members were automatically extracted using the normalized snow index and the normalized vegetation index. On the basis of the subpixel snow cover area classification algorithm, the snow cover area variation on the Tibetan Plateau was analyzed. Using the method of establishing a decision tree, clouds and snow were detected, cloud-removal was performed, and the subpixel of the Tibetan Plateau was formed by synthesis and mosaicking of the time series images. The snow cover area classification database analyzes and describes the spatial distribution and variation characteristics of the snow cover area of the Tibetan Plateau.
2019-09-12 View Details
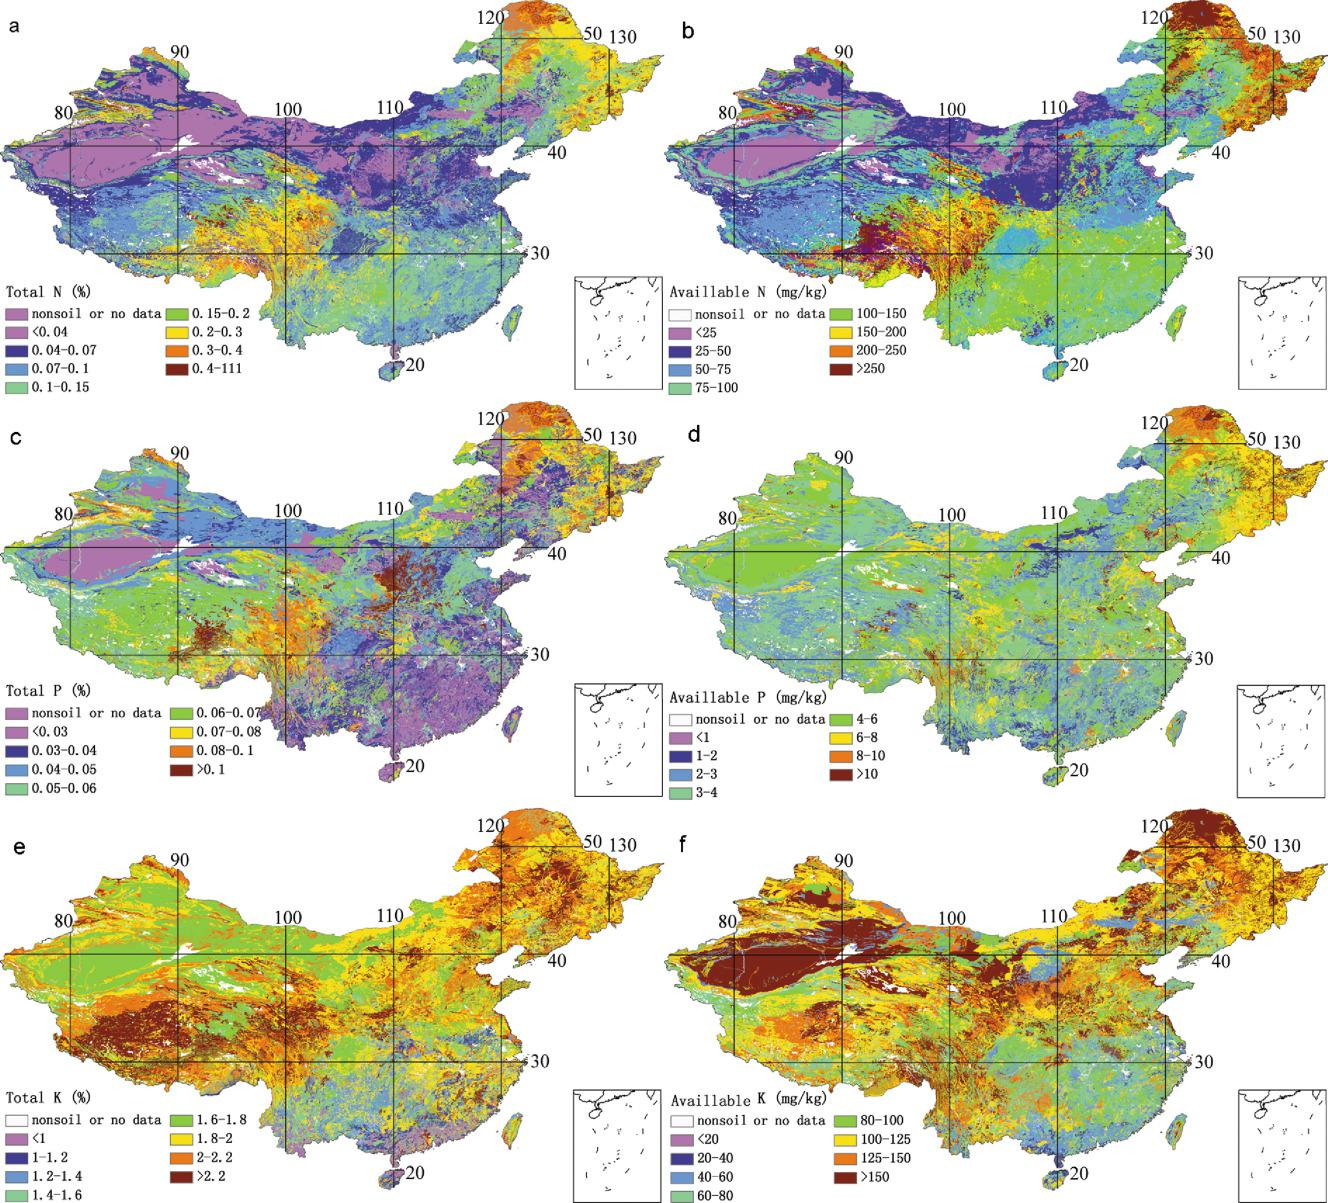
The dataset includes soil physical and chemical attributes: pH value, organic matter fraction, cation exchange capacity, root abundance, total nitrogen (N), total phosphorus (P), total potassium (K), alkali-hydrolysable N, available P, available K, exchangeable H+, Al3+, Ca2+, Mg2+, K+ , Na+, horizon thickness, soil profile depth, sand, silt and clay fractions, rock fragment, bulk density, porosity, structure, consistency and soil color. Quality control information (QC) was provided. The resolution is 30 arc-seconds (about 1 km at the equator). The vertical variation of soil property was captured by eight layers to the depth of 2.3 m (i.e. 0- 0.045, 0.045- 0.091, 0.091- 0.166, 0.166- 0.289, 0.289- 0.493, 0.493- 0.829, 0.829- 1.383 and 1.383- 2.296 m) for convenience of use in the Common Land Model and the Community Land Model (CLM). 1.THSCH.nc: Saturated water content of FCH 2.PSI_S.nc: Saturated capillary potential of FCH 3.LAMBDA.nc: Pore size distribution index of FCH 4.K_SCH.nc: Saturate hydraulic conductivity of FCH 5.THR.nc: Residual moisture content of FGM 6.THSGM.nc: Saturated water content of FGM 7.ALPHA.nc: The inverse of the air-entry value of FGM 8.N.nc: The shape parameter of FGM 9.L.nc: The pore-connectivity parameter of FGM 10.K_SVG.nc: Saturated hydraulic conductivity of FGM 11.TH33.nc: Water content at -33 kPa of suction pressure, or field capacity 12.TH1500.nc: Water content at -1500 kPa of suction pressure, or permanent wilting point
2019-09-12 View Details
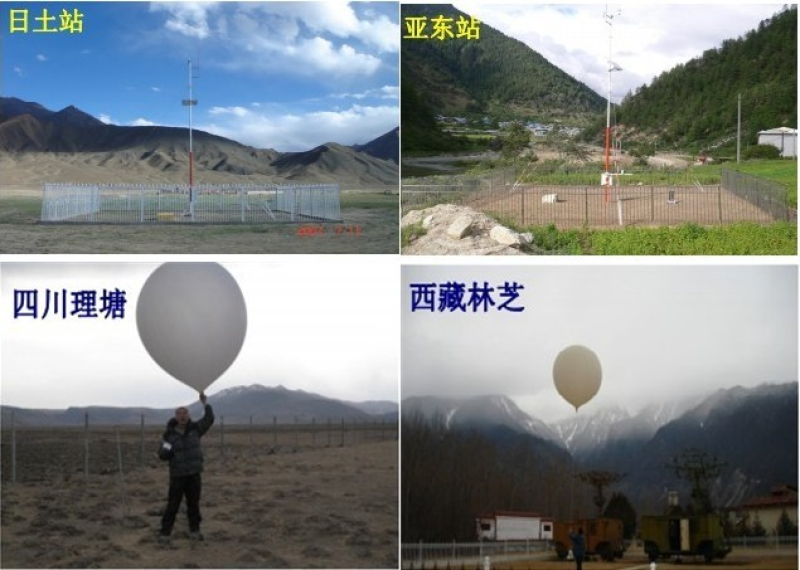
The assessment of changes in the atmospheric water cycle and the associated impacts in a key area of the Tibetan Plateau under the background of the global warming was a major component of the research project “The Environmental and Ecological Science of West China” run by the National Natural Science Foundation of China. The leading executive of the project was Xiangde Xu from the Chinese Academy of Meteorological Sciences. The project ran from January 2006 to December 2008. The following data were collected by the project of the Sino-Japan Joint Research Center of Meteorological Disaster (JICA Project): 1. Observation category, time period and number of stations 1) JICA AWS data: From January to July of 2008, 73 automatic stations (including 5 automatic stations of the Chinese Academy of Sciences) collected data in Tibet, Yunnan, Sichuan and other provinces or autonomous regions. 2) JICA GPS water vapour data: From January to October of 2008, 24 observation stations collected data in Tibet, Yunnan, Sichuan and other provinces or autonomous regions. 3) JICA encrypted observation GPS sonde data: From March to July of 2008, observations were made in Tibet, Yunnan, Sichuan and other provinces or autonomous regions (detailed observation time and location data can be found in the data catalogue). 2. Observation categories, data content 1) GPS water vapour Data content: serial number, station name (Chinese), station number, longitude, latitude, altitude, year, month, day, time, surface pressure, surface air temperature, relative humidity, total delay (m), precipitation (cm) (Measurement interval: 1 hour). 2) GPS encrypted sonde Data content: air pressure P, temperature T, relative humidity RH, V component, U component, vertical height H, dew point temperature Td, water vapour content Mr, wind direction Wd, wind speed Ws, longitude Lon, latitude Lat, radar height RdH. A value of "-999.90" means no observation data. 3) AWS Data content: station number, longitude, latitude, elevation, site level, total cloud volume, wind direction, wind speed, sea level pressure, 3-hour pressure variable, past weather 1, past weather 2, 6-hour precipitation, low cloud form, low cloud volume, low cloud height, dew point, visibility, current weather, temperature, medium cloud form, high cloud form, 24-hour temperature variable, 24-hour pressure variable. Project Science Advisers: Guoguang Zheng, Xiaofeng Xu, Xiuji Zhou, Zechun Li, Jifan Niu, Jianmin Xu, Lianshou Chen, Dahe Qin, Yihui Ding Project Superintendent: Jixin Yu Project Executives: Renhe Zhang, Xiangde Xu Data set hosting organizations: Chinese Academy of Meteorological Sciences, JICA Project Implementation Expert Group, State Key Laboratory of Severe Weather, JICA Project Implementation Office. Collaborative organizations involved in the production of the data set: Chinese Academy of Meteorological Sciences, State Key Laboratory of Severe Weather, National Satellite Meteorological Center, The Research Center for Atmospheric Sounding Techniques, National Meteorological Center, National Meteorological Information Center, National Climate Center, Sichuan Meteorological Department, Yunnan Meteorological Department, Tibet Autonomous Region Meteorological Department, Institute of Tibetan Plateau Research, Chinese Academy of Sciences, Cold and Arid Regions Environmental and Engineering Research Institute, Chinese Academy of Sciences, Tianjin Meteorological Department. Data set implementation organizations: Beijing Headquarters of JICA Project; JICA Project Sub-center in Sichuan Province, Yunnan Province, Tibet Autonomous Region and Institute of Tibetan Plateau Research, Chinese Academy of Sciences.
2019-09-12 View Details
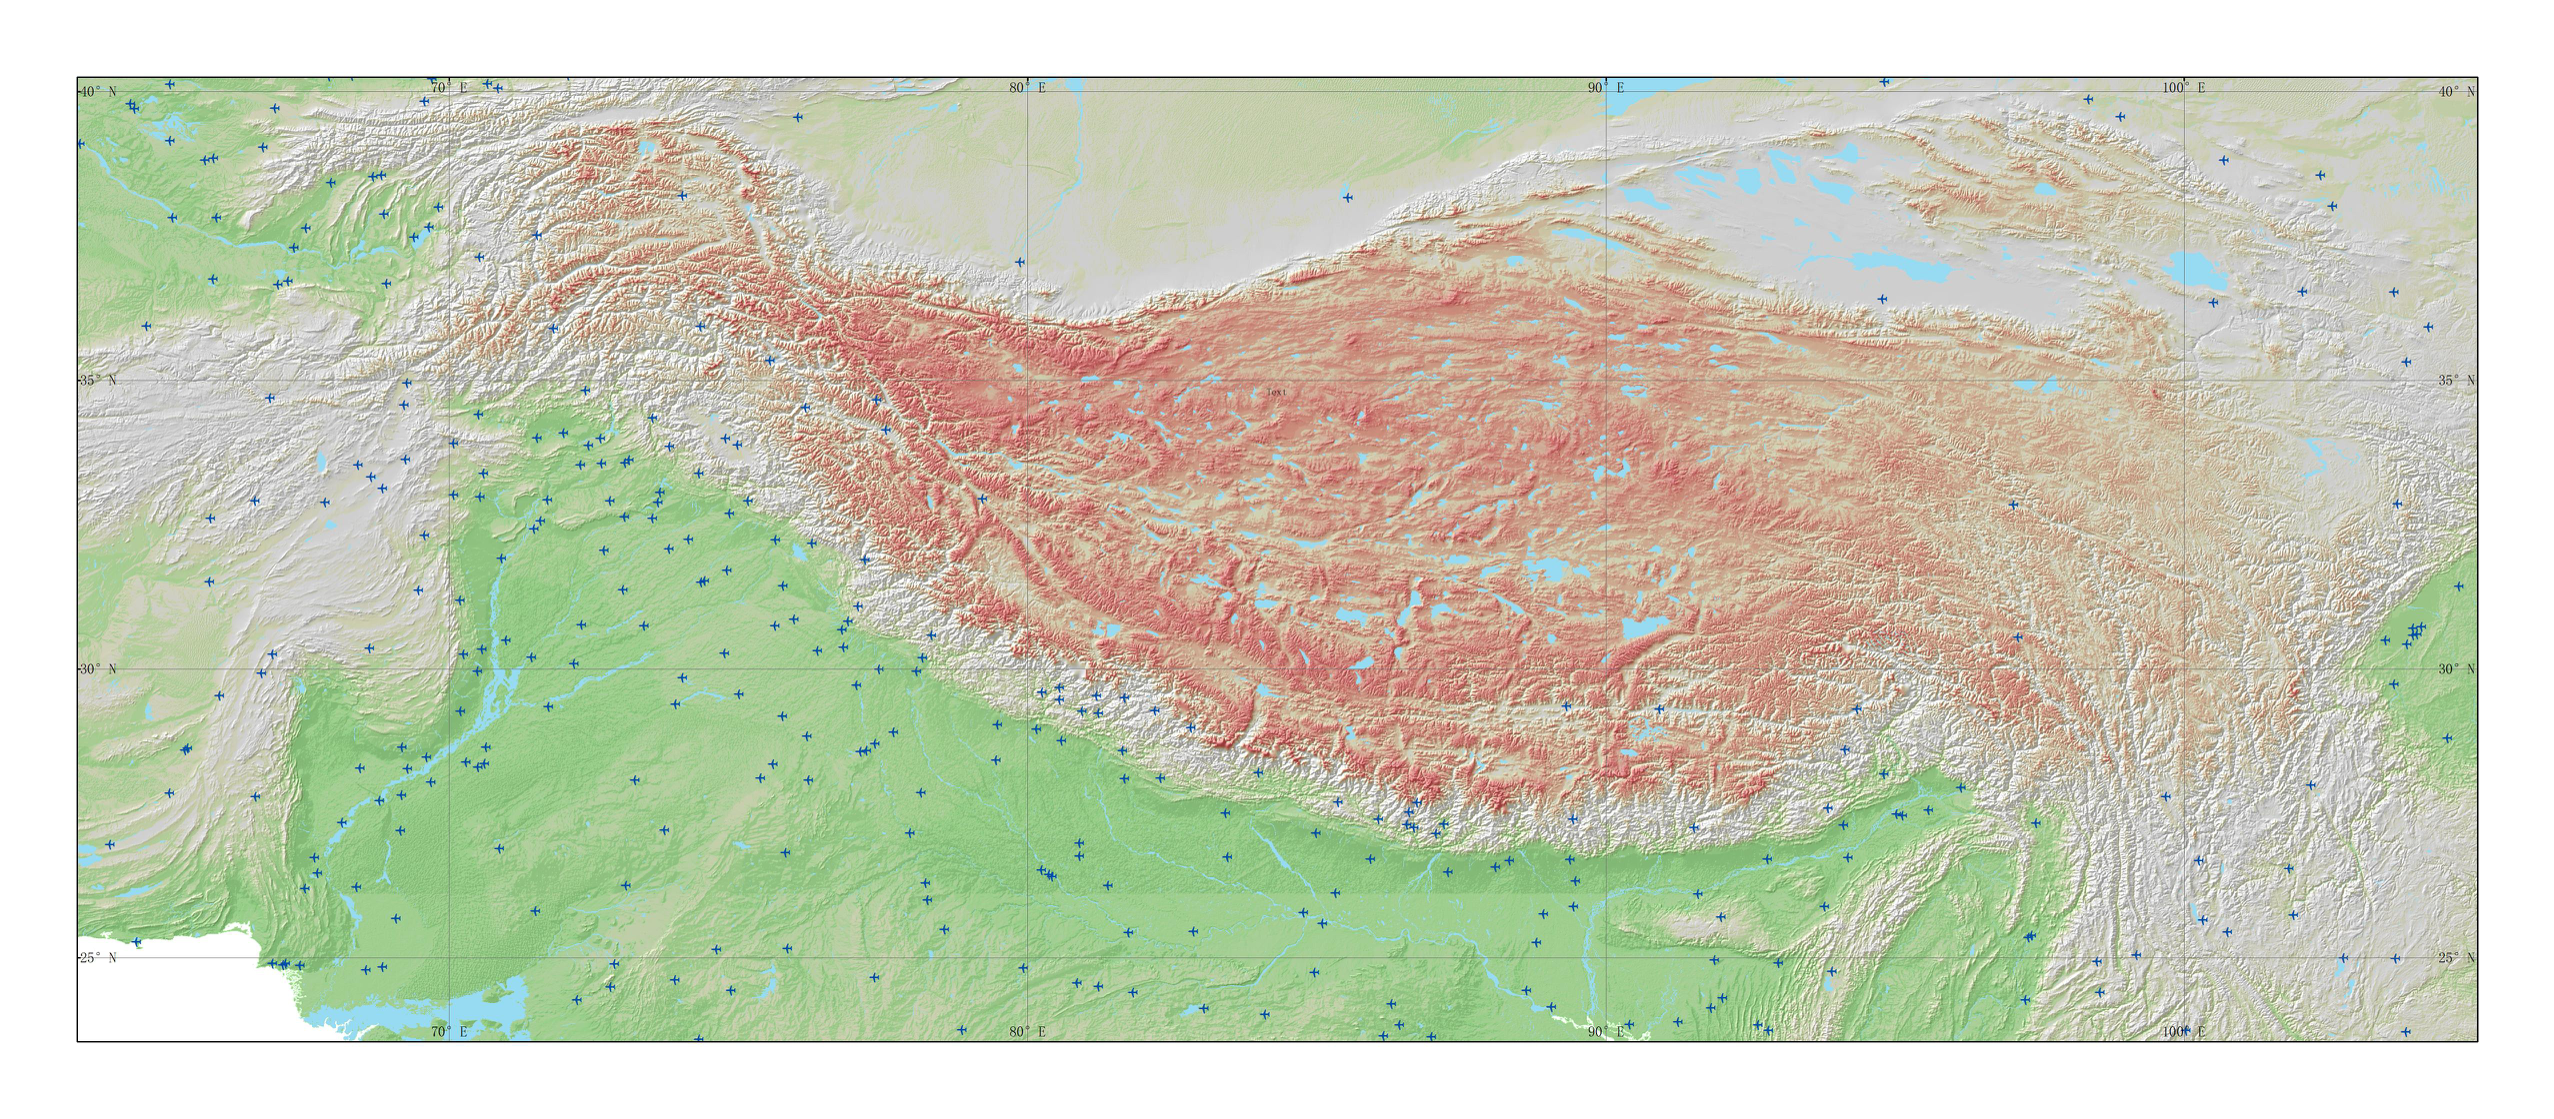
Third Pole 1:100,000 airport and runway data set include:airport(Tibet_Airport)and(Tibet_Airport_runways) vector space data set and its attribute name:Airport name(Name)、Name of airport(CNTRY_NAME)、Airport country abbreviation(CNTRY_CODE)、latitude(LATITUDE)、longitude(LONGITUDE). The data comes from the 1:100,000 ADC_WorldMap global data set,The data through topology, warehousing and other data quality inspection,Data through the topology, into the library,It's comprehensive, up-to-date and seamless geodigital data. The world map coordinate system is latitude and longitude, D_WGS_1984 datum surface
2019-09-12 View Details
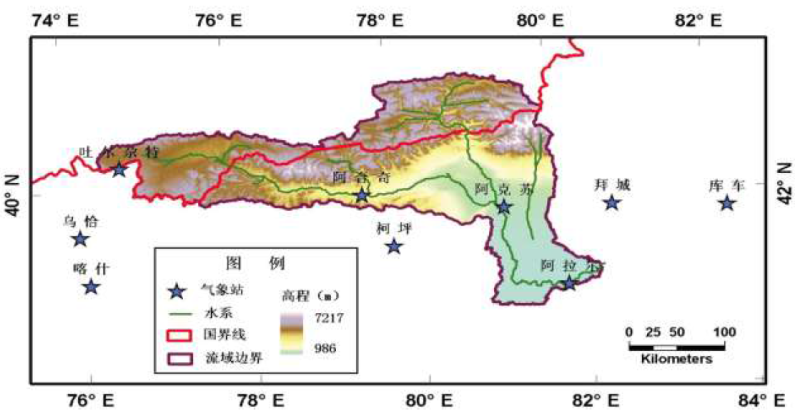
By applying supply-demand balance analysis, the water resource supply and demand of the whole river basin and each county or district were calculated, and the results were used to assess the vulnerability of the water resources system in the basin. The IPAT equation was used to establish a future water resource demand scenario, which involved setting various variables, such as the future population growth rate, economic growth rate, and water consumption per unit GDP. By taking 2005 as the base year and using assorted forecasting data of population size and economic scale, the future water demand scenarios of various counties and cities from 2010 to 2050 were predicted. By applying the basic structure of the HBV conceptual hydrological model of the Swedish Hydro-meteorological Institute, a model of the variation trends of the basin under a changing climate was designed. The glacial melting scenario was used as the model input to construct the runoff scenario in response to climate change. According to the national regulations of the water resource allocation in the basin, a water distribution plan was set up to calculate the water supply comprehensively. Considering the supply and demand situation, the water resource system vulnerability was evaluated by the water shortage rate. By calculating the grain production-related land pressure index of the major counties and cities in the basin, the balance of supply and demand of land resources in scenarios of climate change, glacial melting and population growth was analysed, and the vulnerability of the agricultural system was evaluated. The Miami formula and HANPP model were used to calculate the human appropriation of net primary biomass and primary biomass in the major counties and cities in the future, and the vulnerability of ecosystems from the perspective of supply and demand balance was assessed.
2019-09-12 View Details
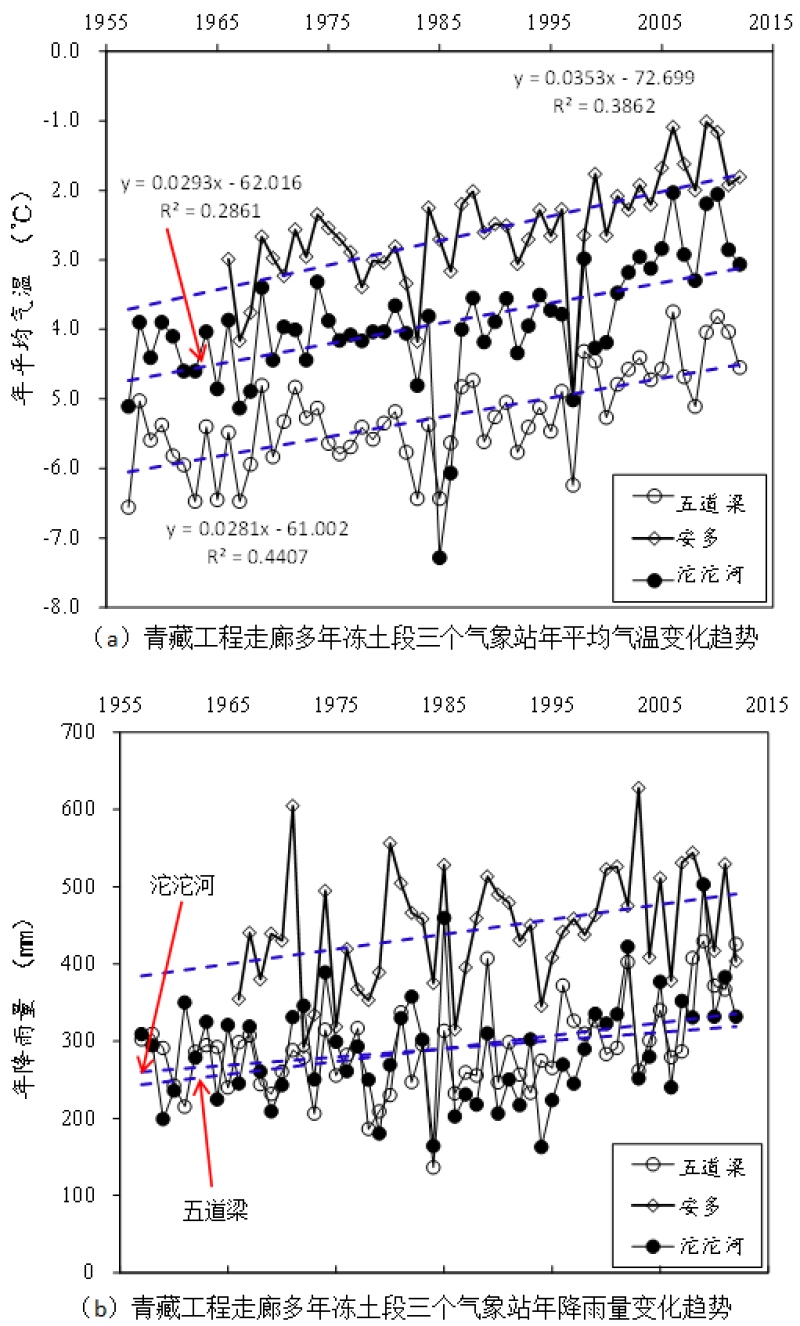
The data set includes the trends of annual average temperature and rainfall changes at the three meteorological stations in the permafrost section of the Qinghai-Tibet Engineering Corridor over the past 50 years. According to the recorded data, the annual average temperature is experiencing a gradually rising process. The annual average temperature change over the past 56 years in Wudaoliang and Tuotuohe has a good correlation (r2=0.83). In 1957, the average annual temperatures of Wudaoliang and Tuotuohe were -6.6 °C and -5.1 °C, respectively. By 2012, the temperatures of the two stations were -4.6 and -3.1 °C, and the total temperature has risen by approximately 2 °C. The annual average temperature rises by 0.03-0.04 °C. The annual average temperature changes over the past 47 years in Wudaoliang and Anduo also have a good correlation (r2=0.84). In 1966, the average annual temperature in Anduo was -3.0 °C. By 2012, the temperature has risen to -1.8 °C, corresponding to a total temperature rise of approximately 1.2 °C and an annual average temperature rise of 0.02-0.03 °C. The annual average temperature in Wudaoliang and Tuotuohe rose slightly faster than that in Anduo. However, the change in rainfall was more volatile than that of temperature. The correlation between the rainfall change in Wudaoliang and Tuotuohe over the past 56 years is relatively poor (r2=0.60). In 1957, the annual rainfall amounts in Wudaoliang and Tuotuohe were 302 and 309 mm, respectively. By 2012, the annual rainfall amounts at the two stations were 426 and 332 mm. Thus, the rainfall in Wudaoliang had increased by 124 mm, with an annual rainfall increase of approximately 2 mm. In contrast, the annual rainfall in Tuotuohe only increased by 0.4 mm. The correlation between the rainfall change in Wudaoliang and Anduo over the past 47 years is also poor (r2=0.35). In 1966, and 2012, the annual average rainfall amounts in Anduo were 354 and 404 mm. The total increase was approximately 50 mm, and the annual average increase was 1 mm. The annual rainfall in Wudaoliang increased the fastest. The observation data from the three meteorological stations reveal climate changes in the permafrost sections of the Qinghai-Tibet Engineering Corridor. Judging from the overall trend of temperature and rainfall changes, the temperature in the northern and central parts of the corridor has increased rapidly over the past 50 years, exceeding the global average of 0.02 °C/a (IPCC). The rainfall increase in the northern part of the corridor is also obvious, especially the rate of rainfall increase at the Wudaoliang meteorological station. Increases in both temperature and rainfall have a great impact on accelerating the spatial variation in permafrost, and they are the leading cause of permafrost degradation on the Tibetan Plateau.
2019-09-12 View Details

Third pole 1:100,000 road data set includes: main road (Tibet_main_highways), road (Tibet_Road)and railway (Tibet_railway) vector space data set and its related attribute data :road names(Name), Type(Type) The data comes from the 1:100,000 ADC_WorldMap global data set,The data through topology, warehousing and other data quality inspection,Data through the topology, into the library,It's comprehensive, up-to-date and seamless geodigital data. The world map coordinate system is latitude and longitude, D_WGS_1984 datum surface
2019-09-11 View Details
Contact Support
Links
National Tibetan Plateau Data CenterFollow Us

A Big Earth Data Platform for Three Poles © 2018-2020 No.05000491 | All Rights Reserved
|  No.11010502040845
Tech Support: westdc.cn