
Brief Introduction:Located in the hinterland of the Tibetan Plateau, Sanjiangyuan region has an important strategic position in the national ecological civilization construction. To effectively promote the construction of a national park system, the National Development and Reform Commission and 13 other ministries and commissions jointly issued the Pilot plan for establishing national park system, and chose Qinghai Province to carry out the pilot program. On December 9, 2015, the General Secretary presided over the 19th meeting of the Central Leading Group for Comprehensively Deepening Reform, at which “The General Plan for Piloting China's Sanjiangyuan National Park System” was reviewed and approved. In March 2016, the State Office of the Office of the People's Republic of China issued a pilot plan, clarifying that Sanjiangyuan National Park consists of the Yellow River Source Park, the Yangtze River Source Park and the Lancang River Source Park, thus establishing the real beginning of the exploration of the national park system in China. In order to better support the construction of Sanjiangyuan National Park, with the support of the major science and technology project " Sanjiangyuan National Park Star-Space-Ground Integrated Ecological Monitoring and Data Platform Construction and Development and Application " in Qinghai Province, the Sanjiangyuan Star-Space-Ground Integrated Ecological Monitoring Data Platform was constructed to significantly improve the ecological monitoring coverage and multi-source heterogeneous data fusion capabilities of Sanjiangyuan National Park.
Publish Datetime:2022-12-13
Number of Datasets:53
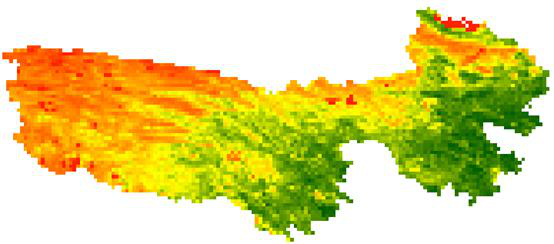
The data set is NDVI data of long time series acquired by NOAA's Advanced Very High Resolution Radiometer (AVHRR) sensor. The time range of the data set is from 1982 to 2015. In order to remove the noise in NDVI data, maximum synthesis and multi-sensor contrast correction are carried out. A NDVI image is synthesized every half month. The data set is widely used in the analysis of long-term vegetation change trend. The data set is cut out from the global data set, so as to carry out the research and analysis of the source areas of the three rivers separately. The data format of this data set is GeoTIFF with spatial resolution of 8 km and temporal resolution of 2 weeks, ranging from 1982 to 2015. Data transfer coefficient is 10000, NDVI = ND/10000.
2021-03-28 View Details
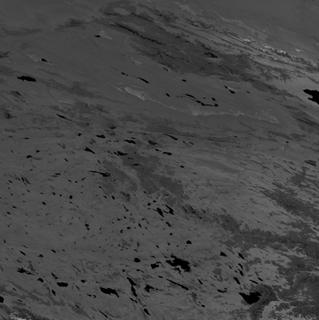
The data set is MODIS vegetation index data (MOD13Q1). The source areas of the three rivers are extracted to carry out the research and analysis of the source areas of the three rivers separately. MOD13Q1 is a 16-day composite vegetation index, including normalized vegetation index (NDVI) and enhanced vegetation index (EVI). The spatial scope of Sanjiang Source covers two MODIS files (h25v05 and h26v05). Data storage format is hdf. Each file contains 12 bands: Normalized Vegetation Index (NDVI), Enhanced Vegetation Index (EVI), Data Quality (VI Quality), Red Reflectance, Near Infrared Reflectance (NIR Reflectance), Blue Reflectance, Mid Infrared Reflectance, Observation. Viewzenith angle, sun zenith angle, relative azimuth angle, composite day of the year and pixel reliability. The data format of this data set is hdf, spatial resolution is 250m, temporal resolution is 16 days, time range: February 2000 to October 2018.
2021-03-28 View Details
This is the vegetation index (NDVI) for Maduo County in July, August and September of 2016. It is obtained through calculation based on the multispectral data of GF-1. The spatial resolution is 16 m. The GF-1 data are processed by mosaicking, projection coordinating, data subsetting and other methods. The maximum synthesis is then conducted every month in July, August, and September.
2021-03-28 View Details

The dataset is the ground verification point dataset of land cover and vegetation type in the Source Region of Yellow River (in the north of Zaling Lake, Qinghai Province) which collected during August 2018. In the dataset, the homogeneous patches are considered as the main targets of this collection. They are easy to be recognized out and distinguished from other vegetation types. And these samples have high representativeness comparing with other land surface features. In each sample, the geographical references, longitude and latitude (degree, minute, second), time (24h) and elevation (0.1m) are recorded firstly according to GPS positioning. Vegetation types, constructive species, characteristics, land types and features, landmarks, etc. are recorded into the property table manually for checking in laboratory. At last, each sample place has been taken at least 1 photography. In this dataset, 90% or more samples have been taken 2 or more in field landscape photographs for land use type and vegetation classification examination. We have carefully examined the position accuracy of each sample in Google Earth. After 2 rounds of checking and examination, the accuracy and reliability of the property of each sample have been guaranteed.
2020-10-13 View Details
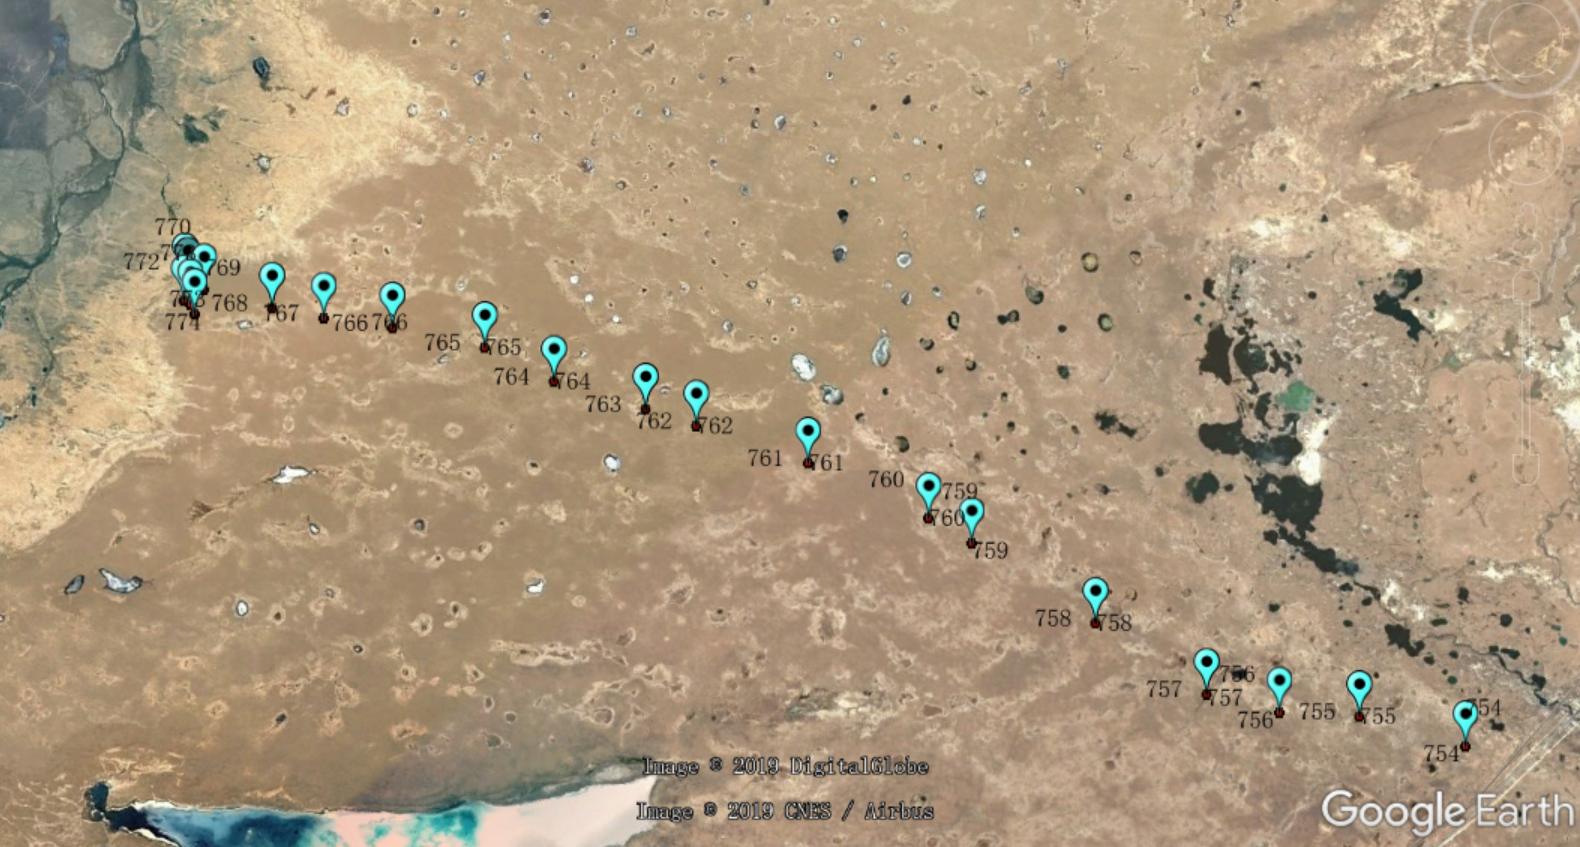
The dataset is the ground verification point dataset of land cover and vegetation type in the Hoh Xil (in the northwest of Qinghai Province) which collected during August 2018. In the dataset, the homogeneous patches are considered as the main targets of this collection. They are easy to be recognized out and distinguished from other vegetation types. And these samples have high representativeness comparing with other land surface features. In each sample, the geographical references, longitude and latitude (degree, minute, second), time (24h) and elevation (0.1m) are recorded firstly according to GPS positioning. Vegetation types, constructive species, characteristics, land types and features, landmarks, etc. are recorded into the property table manually for checking in laboratory. At last, each sample place has been taken at least 1 photography. In this dataset, 90% or more samples have been taken 2 or more in field landscape photographs for land use type and vegetation classification examination. We have carefully examined the position accuracy of each sample in Google Earth. After 2 rounds of checking and examination, the accuracy and reliability of the property of each sample have been guaranteed.
2020-10-13 View Details

The dataset is the ground verification point dataset of land cover and vegetation type in the Source Region of the Yangtze River (in the south of Qinghai Province) which collected during August 2018. In the dataset, the homogeneous patches are considered as the main targets of this collection. They are easy to be recognized out and distinguished from other vegetation types. And these samples have high representativeness comparing with other land surface features. In each sample, the geographical references, longitude and latitude (degree, minute, second), time (24h) and elevation (0.1m) are recorded firstly according to GPS positioning. Vegetation types, constructive species, characteristics, land types and features, landmarks, etc. are recorded into the property table manually for checking in laboratory. At last, each sample place has been taken at least 1 photography. In this dataset, 90% or more samples have been taken 2 or more in field landscape photographs for land use type and vegetation classification examination. We have carefully examined the position accuracy of each sample in Google Earth. After 2 rounds of checking and examination, the accuracy and reliability of the property of each sample have been guaranteed.
2020-10-13 View Details

The permafrost stability map was created based on the classification system proposed by Guodong Cheng (1984), which mainly depended on the inter-annual variation of deep soil temperature. By using the geographical weighted regression method, many auxiliary data was fusion in the map, such as average soil temperature, snow cover days, GLASS LAI, soil texture and organic from SoilGrids250, soil moisture products from CLDAS of CMA, and FY2/EMSIP precipitation products. The permafrost stability data spatial resolution is 1km and represents the status around 2010. The following table is the permafrost stability classification system. The data format is Arcgis Raster.
2020-10-13 View Details
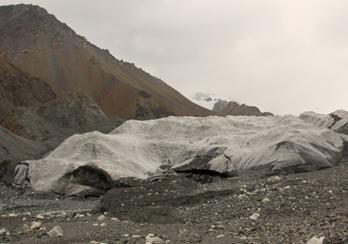
This data set is extracted from the second Glacier Inventory Data Set of China for Three River Source area. The file is SHP format. The attribute data are as follows: Glc_Name (glacier name), Drng_Code (basin code), FCGI_ID (first glacier catalogue code), GLIMS_ID (GLIMS glacier code), Mtn_Name (mountain system name), Pref_Name (administrative division), Glc_Long (glacier longitude), Glc_Lati (glacier latitude), Glc_Area (glacier area), Abs_Accu (absolute area accuracy), Rel_Accu (relative area accuracy), Deb_Area (surface Moraine Area), Deb_A_Accu (absolute accuracy of surface moraine Area), Deb_R_Accu (relative accuracy of surface moraine area)、Glc_Vol_A (estimation of glacier volume 1)、Glc_Vol_B (estimation of glacier volume 2)、Max_Elev (maximum glacier elevation)、Min_Elev (minimum glacier elevation)、Mean_Elev (average glacier elevation)、MA_Elev (median area height of glacier)、Mean_Slp (average glacier slope)、Mean_Asp (average glacier slope direction)、Prm_Image (major remote sensing data)、Aux_Image (auxiliary remote sensing data)、Rep_Date (glacier catalogue represents date)、Elev_Src (elevation data source)、Elev_Date (elevation represents date)、Compiler (glacier cataloguing editor)、Verifier (glacier cataloguing verifier).
2020-07-28 View Details
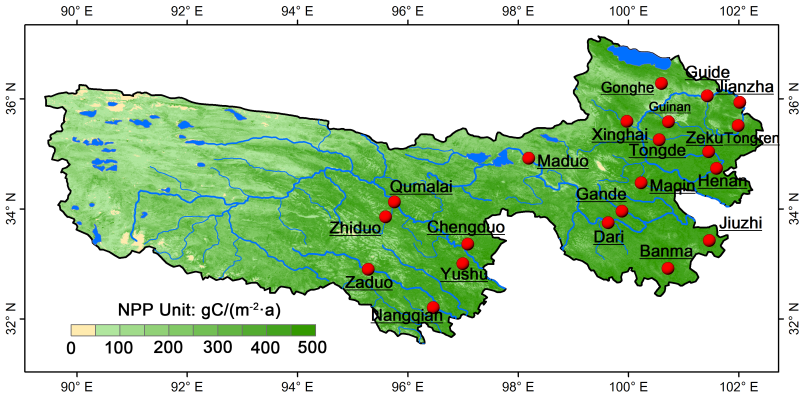
The data set contains NPP products data produced by the maximum synthesis method of the three source regions of the Yellow River, the Yangtze River and the Lancang River. The data of remote sensing products MOD13Q1, MOD17A2, and MOD17A2H are available on the NASA website (http://modis.gsfc.nasa.gov/). The MOD13Q1 product is a 16-d synthetic product with a resolution of 250 m. The MOD17A2 and MOD17A2H product data are 8-d synthetic products, the resolution of MOD17A2 is 1 000 m, and the resolution of MOD17A2H is 500 m. The final synthetic NPP product of MODIS has a resolution of 1 km. The downloaded MOD13Q1, MOD17A2, and MOD17A2H remote sensing data products are in HDF format. The data have been processed by atmospheric correction, radiation correction, geometric correction, and cloud removal. 1) MRT projection conversion. Convert the format and projection of the downloaded data product, convert the HDF format to TIFF format, convert the projection to the UTM projection, and output NDVI with a resolution of 250 m, EVI with a resolution 250 m, and PSNnet with resolutions of 1 000 m and 500 m. 2) MVC maximum synthesis. Synthesize NDVI, EVI, and PSNnet synchronized with the ground measured data by the maximum value to obtain values corresponding to the measured data. The maximum synthesis method can effectively reduce the effects of clouds, the atmosphere, and solar elevation angles. 3) NPP annual value generated from the NASA-CASA model.
2020-06-03 View Details
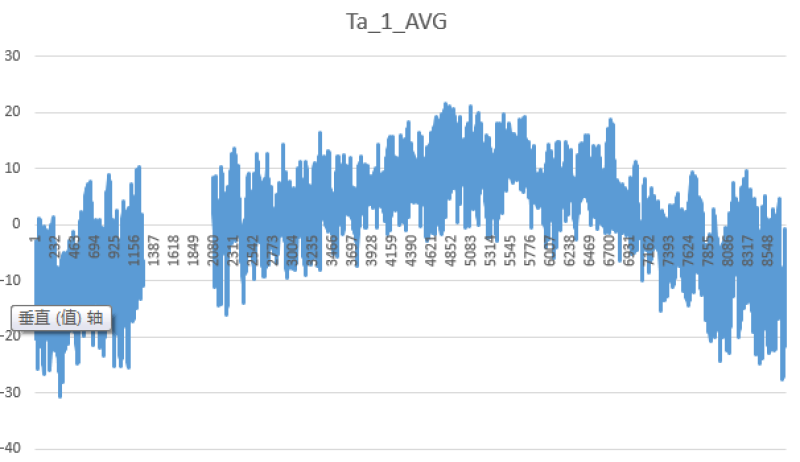
The data set contains meteorological observations from Guoluo Station from January 1, 2017, to December 31, 2017, and includes temperature (Ta_1_AVG), relative humidity (RH_1_AVG), vapour pressure (Pvapor_1_AVG), average wind speed (WS_AVG), atmospheric pressure (P_1), average downward longwave radiation (DLR_5_AVG), average upward longwave radiation (ULR_5_AVG), average net radiation (Rn_5_AVG), average soil temperature (Ts_TCAV_AVG), soil water content (Smoist_AVG), total precipitation (Rain_7_TOT), downward longwave radiation (CG3_down_Avg), upward longwave radiation (CGR3_up_Avg), average photosynthetically active radiation (Par_Avg), etc. The temporal resolution is 1 hour. Missing observations have been assigned a value of -99999.
2020-06-03 View Details
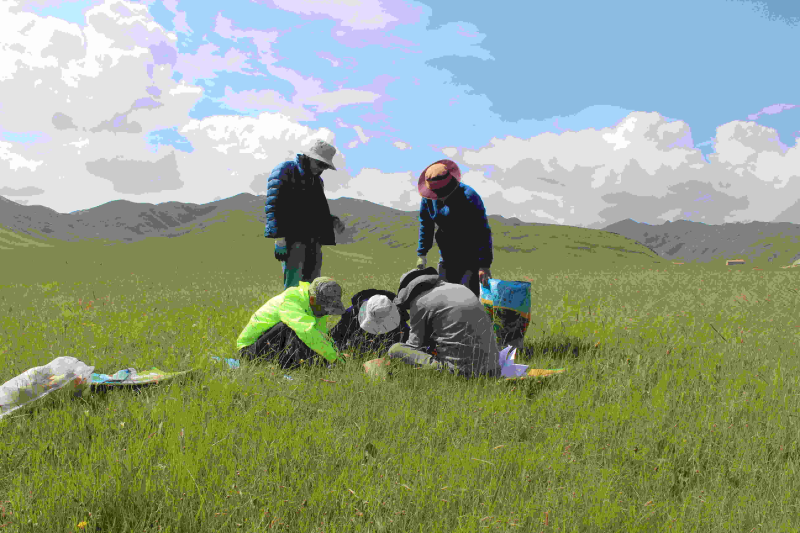
The data set contains vegetation quadrat survey data for Qumalai, Mado and Hoh Xil from August 3, 2017, to August 9, 2017. The main survey contents are coverage, altitude and above-ground biomass. It covers three vegetation types: alpine grassland, alpine wetland and alpine meadow. The latitude, longitude, altitude, total coverage, species name and quantity of the quadrat were recorded, and three samples of each species were selected to measure the altitude, the total above-ground biomass, and the above-ground biomass of each category.
2020-06-03 View Details
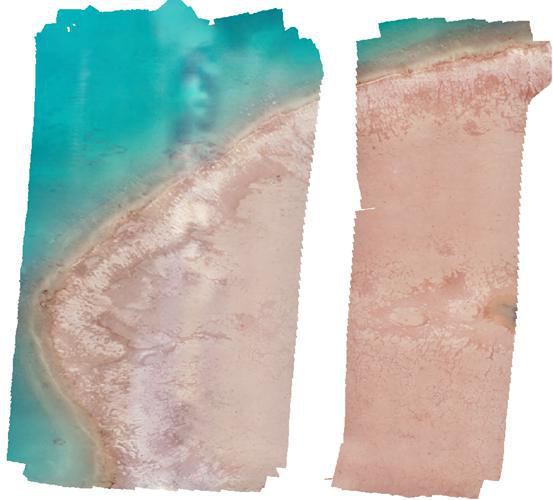
On August 22, 2018, a DJI camera was used in the fixed sample of Lancang River headwaters. The overlap degree of adjacent photos was not less than 70% according to the set flight route. The Orthophoto Image and DSM were generated using the photographs taken. The Orthophoto Image included three bands of red, green and blue, with a ground resolution of 2.5 cm, a shooting area of 1000m x 1000m and a DSM resolution of 4.5 cm. Due to the communication failure, the middle four airstrips were not photographed, so there was a band in the middle of the image missing.
2020-06-03 View Details
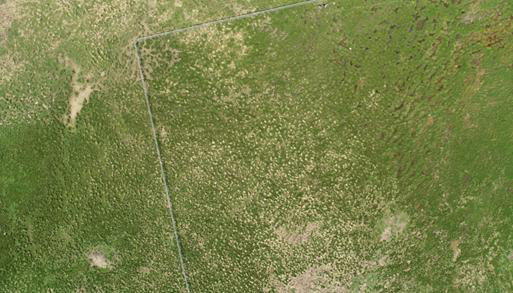
On August 19, 2018, the wetland sample in Qumali County, located in the source area of the Yangtze River, was aerially photographed by DJI Elf 4 UAV. A total of 31 routes were set up, flying at a height of 100 m, and the overlap of adjacent photographs was not less than 70%. A total of 1551 aerial photographs were obtained and stored in two folders named "Drone Photoes Part1" and "Drone Photoes Part2".
2020-06-03 View Details
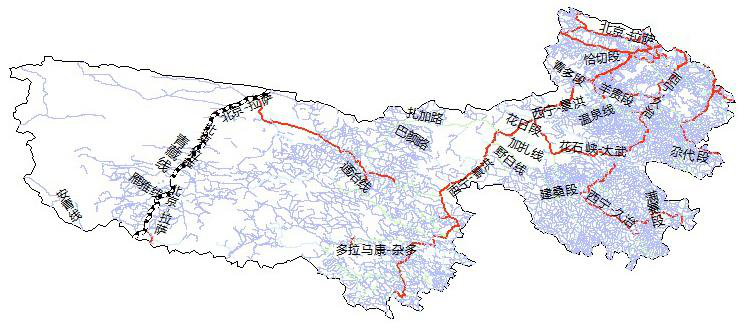
This data comes from the National Catalogue Service for Geographic Information, which was provided to the public free of charge by the National Basic Geographic Information Center in November 2017. We spliced and trimmed Three Rivers Source Region as a whole to facilitate its use in the study of Three Rivers Source Region. The current status of the data is 2015. This dataset is 1:25 million traffic data in the Three Rivers Source Region area, including two layers of highway (LRDL) and railway (LRRL). Highways (LRDL) include national, provincial, county, rural, and other highways; railways (LRRL) include standard-gauge, narrow-gauge, subway, and light rail. Highway (LRDL) attribute item name and definition: Attribute item Description Sample GB National standard classification code 420301 RN Road number X828 NAME Road name Zhuoxiao fork-Baola Peak fork RTEG Road Level 4 TYPE Road type elevated Meaning of highway attribute items: Attribute item Code Description GB 420101 National road 420102 National road in building 420201 Provincial road 420102 Provincial highway in building 420301 County road 420302 County road in building 420400 Country road 420800 Machine tillage 440100 Simple road 440200 Village road 440300 Trail Railway (LRRL) attribute item name and definition: Attribute item Description Sample GB National standard classification code 410101 RN Railway number 0907 NAME Railway name Qinghai-Tibet Railway TYPE Rail type
2020-03-12 View Details

The Three-River-Source National Park with an area of 123,100 km2 and include three sub regions, they are source region of the Yangtze River in the national park, source region of Yellow River in the national park and source region of Lancang River in the national park. The national park is located between longitude 89°50'57" -- 99°14'57", latitude 32°22'36" -- 36°47'53". It accounts for 31.16% of the total area of Three-River-Source region. This data set is generated by digitizing the location map of Three-River-Source national park in the comprehensive planning of Three-River-Source national park. The data include the boundary for the national park. Data format is Shapefile. Arcmap is recommended to open the data.
2019-12-17 View Details

This data originates from the National Geographic Information Resources Catalogue Service System, which was provided free to the public by the National Basic Geographic Information Center in November 2017. We have spliced and cut the source of the three rivers as a whole, so as to facilitate the use of the study of the source area of the three rivers. The data trend is 2015. This data set includes 1:250,000 natural place names (AANP) in Sanjiangyuan area, including traffic element names, memorial sites and historic sites, mountain names, water system names, marine geographical names, natural geographical names, etc. Natural Place Name Data (AANP) Attribute Item Names and Definitions: Attribute Item Description Fill in Example NAME Name Ramsay Laboniwa PINYIN Chinese Pinyin Lamusailabaoniwa CLASS Toponymic Classification Code HB
2019-09-15 View Details
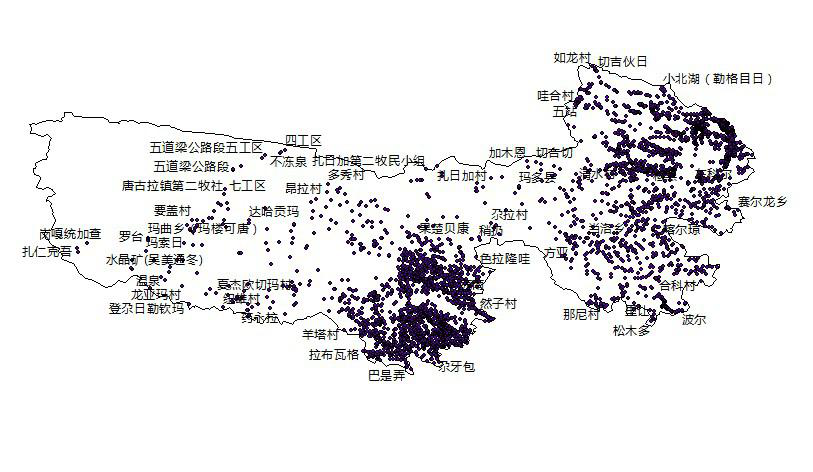
This data comes from the National Geographic Information Resources Catalogue Service System, which was provided free to the public by the National Basic Geographic Information Center in November 2017. We have spliced and cut the source of the three rivers as a whole, so as to facilitate the use of the study of the source area of the three rivers. The data trend is 2015. This data set includes 1:250,000 residential place names (AANP) in Sanjiangyuan area, including administrative place names at all levels and urban and rural residential place names. Names and Definitions of Attribute Items of Residential Place Name Data (AANP): Attribute Item Description Fill in Example NAME Name Quanqu Village PINYIN Chinese Pinyin Quanqucun CLASS Geographical Name Classification Code AK GNID Place Name Code 632524000000 XZNAME Township Name Ziketan Township
2019-09-15 View Details
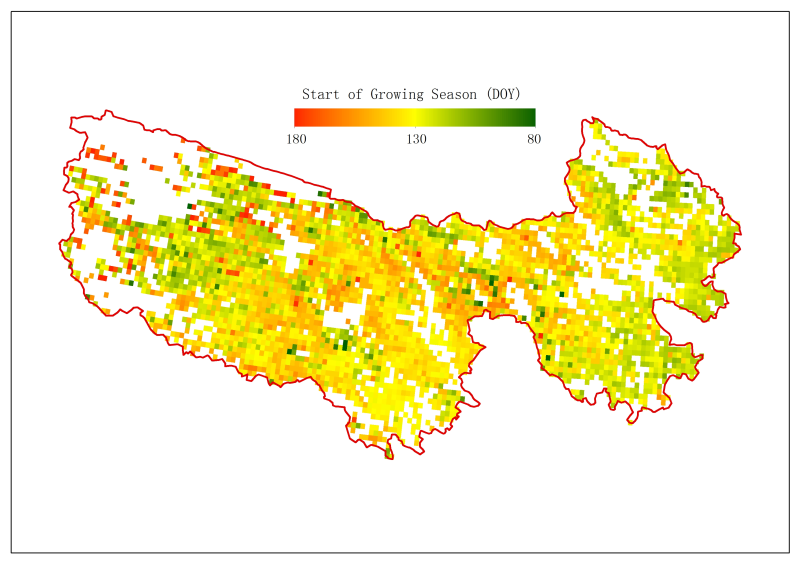
The data set includes the estimated data on the SOS (start of season) and the EOS (end of season) of vegetation in Sanjiangyuan based on GIMMS3g version 1.0, the latest version of the GIMMS NDVI data set. Two common phenological estimation methods were adopted: the threshold extraction method based on polynomial fitting (the term “poly” was included in the file names) and the inflection point extraction method based on double logistic function fitting (the term “sig” was included in the file names). These data can be used to analyse the relationship between vegetation phenology and climate change. The temporal coverage ranges from 1982 to 2015, and the spatial resolution is 8 km.
2019-09-15 View Details
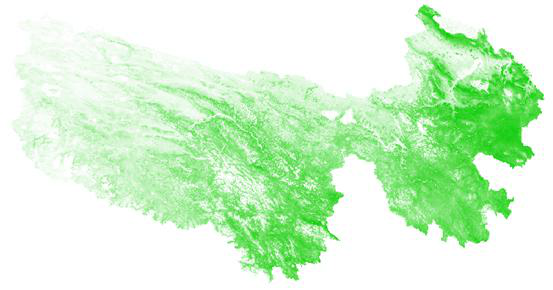
Monthly meteorological data of Sanjiangyuan includes 32 national standard meteorological stations. There are 26 variables: average local pressure, extreme maximum local pressure, date of extreme maximum local pressure, extreme minimum local pressure, date of extreme minimum local pressure, average temperature, extreme maximum temperature, date of extreme maximum temperature, extreme minimum temperature and date of extreme minimum temperature, average temperature anomaly, average maximum temperature, average minimum temperature, sunshine hours, percentage of sunshine, average relative humidity, minimum relative humidity, date of occurrence of minimum relative humidity, precipitation, days of daily precipitation >=0.1mm, maximum daily precipitation, date of maximum daily precipitation, percentage of precipitation anomaly, average wind speed, maximum wind speed, date of maximum wind speed, maximum wind speed, wind direction of maximum wind speed, wind direction of maximum wind speed and occurrence date of maximum wind speed. The data format is txt, named by the site ID, and each file has 26 columns. The names and units of each column are explained in the SURF_CLI_CHN_MUL_MON_readme.txt file. Projection information: Albers isoconic projection Central meridian: 105 degrees First secant: 25 degrees First secant: 47 degrees West deviation of coordinates: 4000000 meters
2019-09-15 View Details
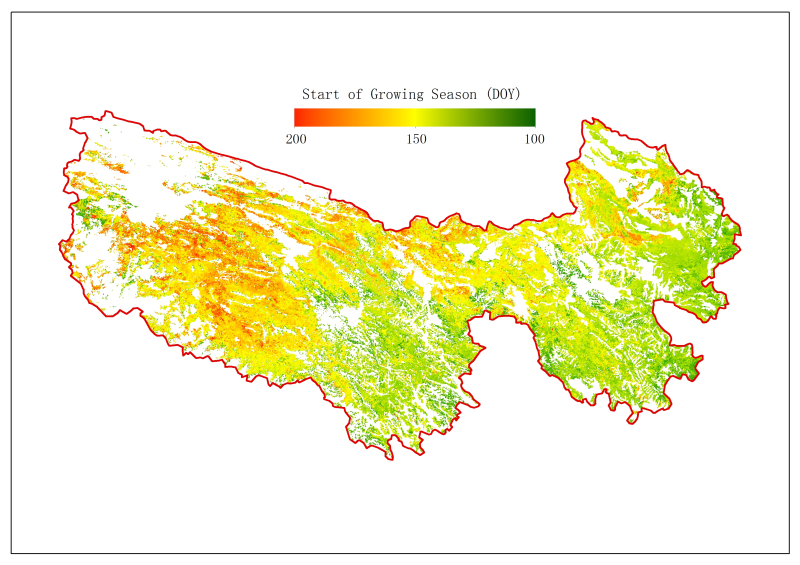
The data set includes estimated data on the SOS (start of season) and the EOS (end of season) of vegetation in Sanjiangyuan based on the MODIS 16-day synthetic NDVI product (MOD13A2 collection 6). Two common phenological estimation methods were adopted: the threshold extraction method based on polynomial fitting (the term “poly” was included in the file names) and the inflection point extraction method based on double logistic function fitting (the term “sig” was included in the file names). These data can be used to analyse the relationship between vegetation phenology and climate change. The temporal coverage ranges from 2001 to 2014, and the spatial resolution is 1 km.
2019-09-14 View Details
Contact Support
Links
National Tibetan Plateau Data CenterFollow Us

A Big Earth Data Platform for Three Poles © 2018-2020 No.05000491 | All Rights Reserved
|  No.11010502040845
Tech Support: westdc.cn