
Brief Introduction:The Antarctic is one of the cold sources of the Earth's atmosphere and a region that is sensitive to climate change. With global warming, Antarctica has become a key area for international programs to study global climate change. Most of the world's ice and snow is stored in the Antarctic, and more than 95% of Antarctica is covered by ice sheets with an average thickness of 2,000 meters, ice shelves and snow that is not covered all year round. It has an ice continent that can raise the global sea level by 66 meters.
Publish Datetime:2020-06-23
Number of Datasets:54
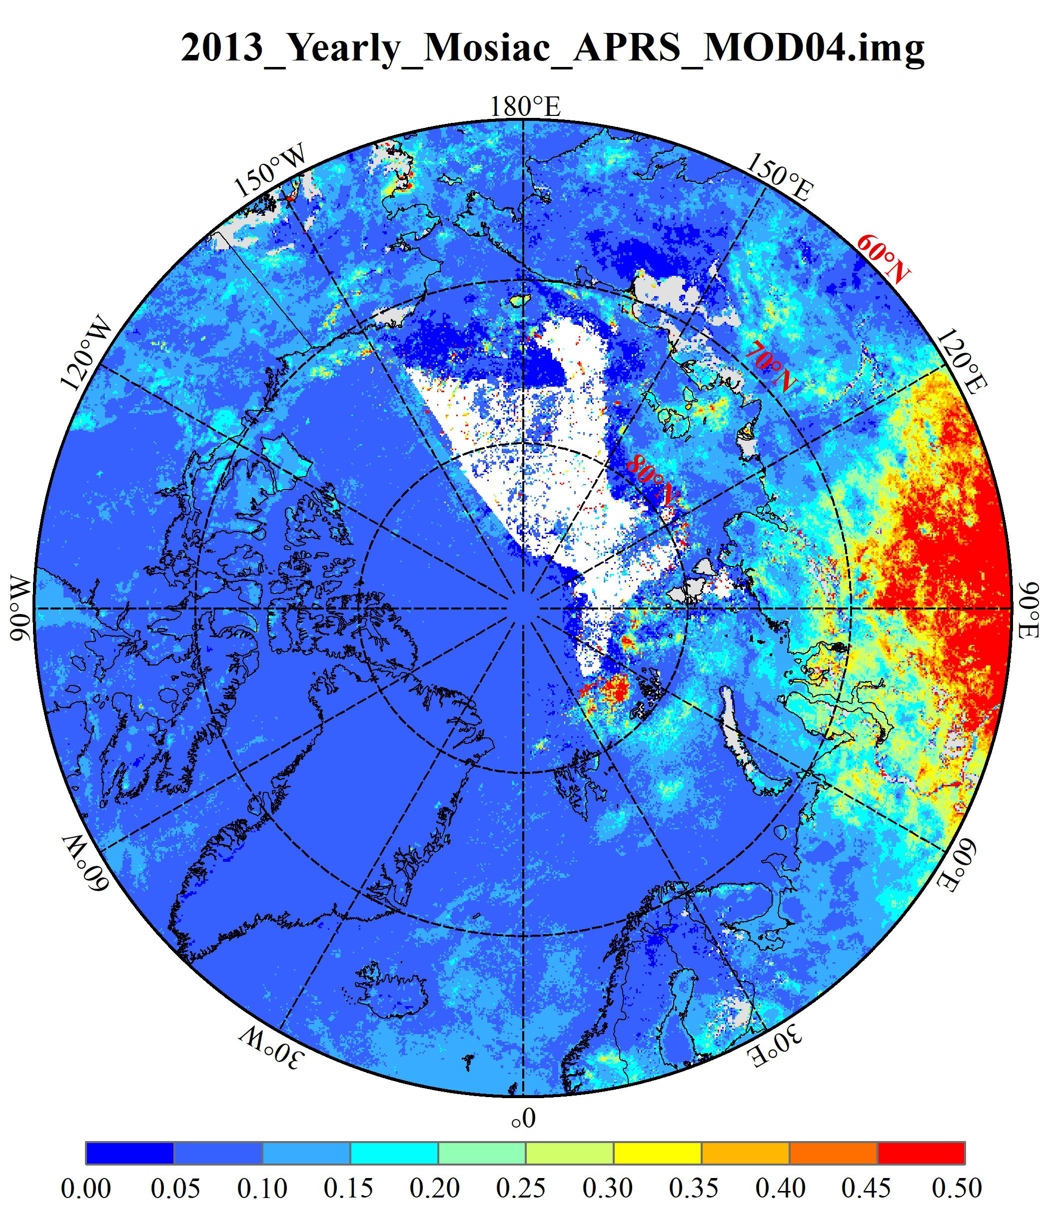
The "poles AOD Collection 1.0" aerosol optical thickness (AOD) data set adopts the self-developed visible band remote sensing inversion method, combined with the merra-2 model data and the official NASA product mod04. The data covers from 2000 to 2019, with the time resolution of day by day, covering the "three poles" (Antarctic, Arctic and Qinghai Tibet Plateau) area, and the spatial resolution of 0.1. Degree. The inversion method mainly uses the self-developed APRs algorithm to invert the aerosol optical thickness over ice and snow. The algorithm considers the BRDF characteristics of ice and snow surface, and is suitable for the inversion of aerosol optical thickness over ice and snow. The experimental results show that the relative deviation of the data is less than 35%, which can effectively improve the coverage and accuracy of the aerosol optical thickness in the polar region.
2020-01-12 View Details
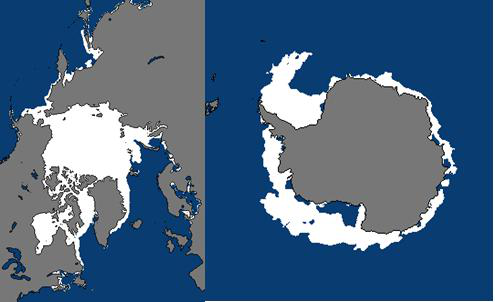
The original data of the Arctic and Antarctic sea ice data set is generated by the National Snow and Ice Data Center (NSIDC) through remote sensing data. The data format is GeoTIFF format and image format. The spatial resolution of the data is 25km and the time resolution is day. The data content is the sea ice range and sea ice density of the north and south poles. In this study, NetCDF format products are generated by post-processing the extent and density of sea ice in the north and south poles. The product data includes the sea ice range and sea ice density data of the north and south poles from 1979 to 2019. The time resolution is day by day, the coverage range is the South Pole and the north pole, and the horizontal spatial resolution is 12.5km. The data value of 1 in the sea ice range matrix indicates that the grid is sea ice, and the sea ice density is expressed by 0-1000. The grid value divided by 10 is the sea ice density value of the grid.
2019-11-17 View Details
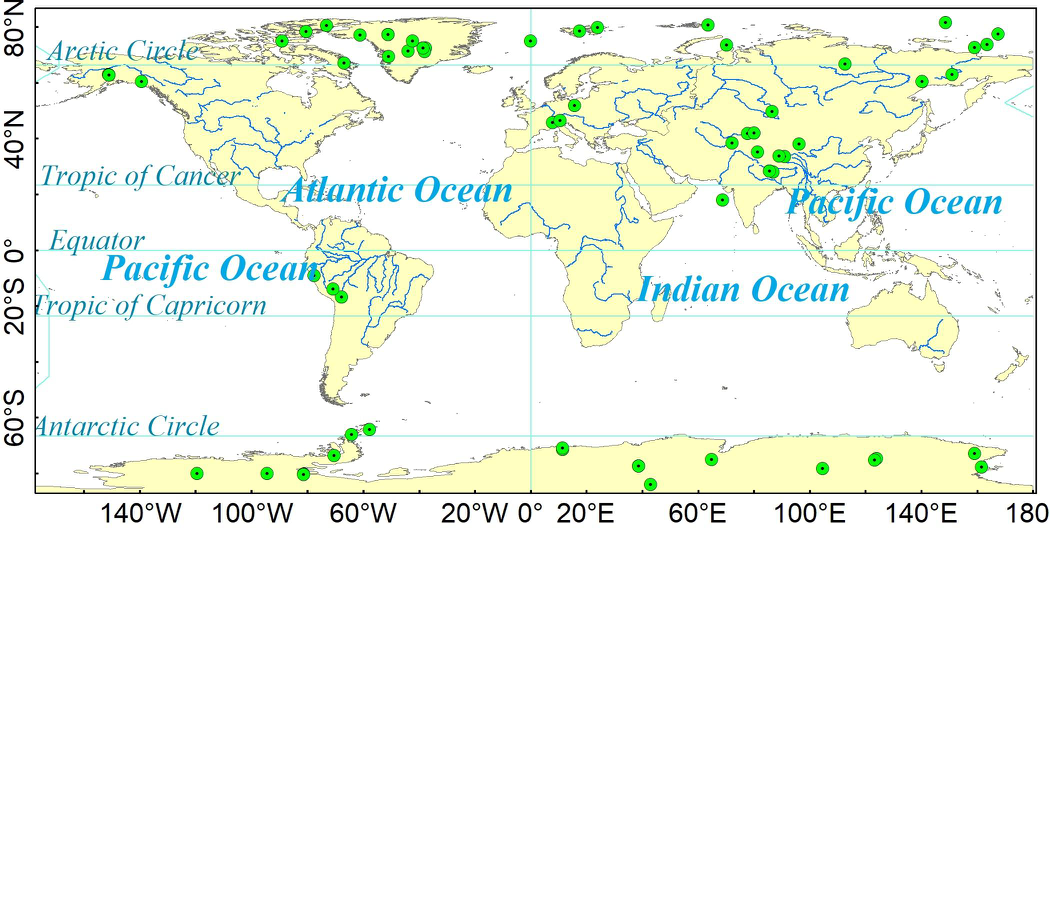
The data of triode ice core mainly comes from NOAA (National Oceanic and Atmospheric Administration, https://www.ncdc.noaa.gov/data-access/paleoclimatology-data/datasets/ice-core). The original data is mainly in text format, which is provided by relevant units and researchers voluntarily. The data mainly includes the original observation data such as oxygen isotope, greenhouse gas concentration, ice core age, etc., as well as the historical temperature, carbon dioxide concentration and methane concentration produced by the researchers according to the observation data. The data are mainly divided into Antarctic, Arctic, Greenland and the third polar region. The database includes drilling address, time, derivative products, corresponding observation site data, references and other elements. Derivative products include product name, type, time and other elements. The space location is divided into the south pole, the north pole and the third pole, including Alaska, Canada, Russia, Greenland and other regions. After sorting and post-processing the collected data, the ice core database is established by using the access database management system of Microsoft office. According to the Antarctic, Arctic, Greenland and the third pole, it is divided into four sub databases. The first table in each database is readme, which contains information and references of each data table.
2019-11-17 View Details
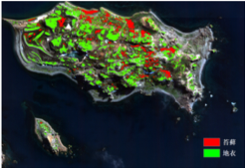
The Antarctic Peninsula is also called "Palmer peninsula" or "Graham land". Located in the southwest polar continent, it is the largest peninsula in the Antarctic continent and the farthest peninsula extending northward into the ocean (63 ° south latitude), bordering the Weddell Sea and berengske sea in the East and West. The Antarctic Peninsula is known as the "tropics" of Antarctica. This is a typical sub polar marine climate. Compared with the Antarctic continent, it is one of the warmest and wettest regions in Antarctica. There are a small number of pioneer plants distributed on the islands in the marginal area, mainly bryophytes and lichens. The plant abundance data products of Antarctic Peninsula and its surrounding areas are matched with remote sensing images through measured spectra, and the end element spectra of moss, lichen, rock, sea and snow are extracted with pure pixel PPI. The linear mixture model (LMM) is applied to calculate.
2019-10-26 View Details
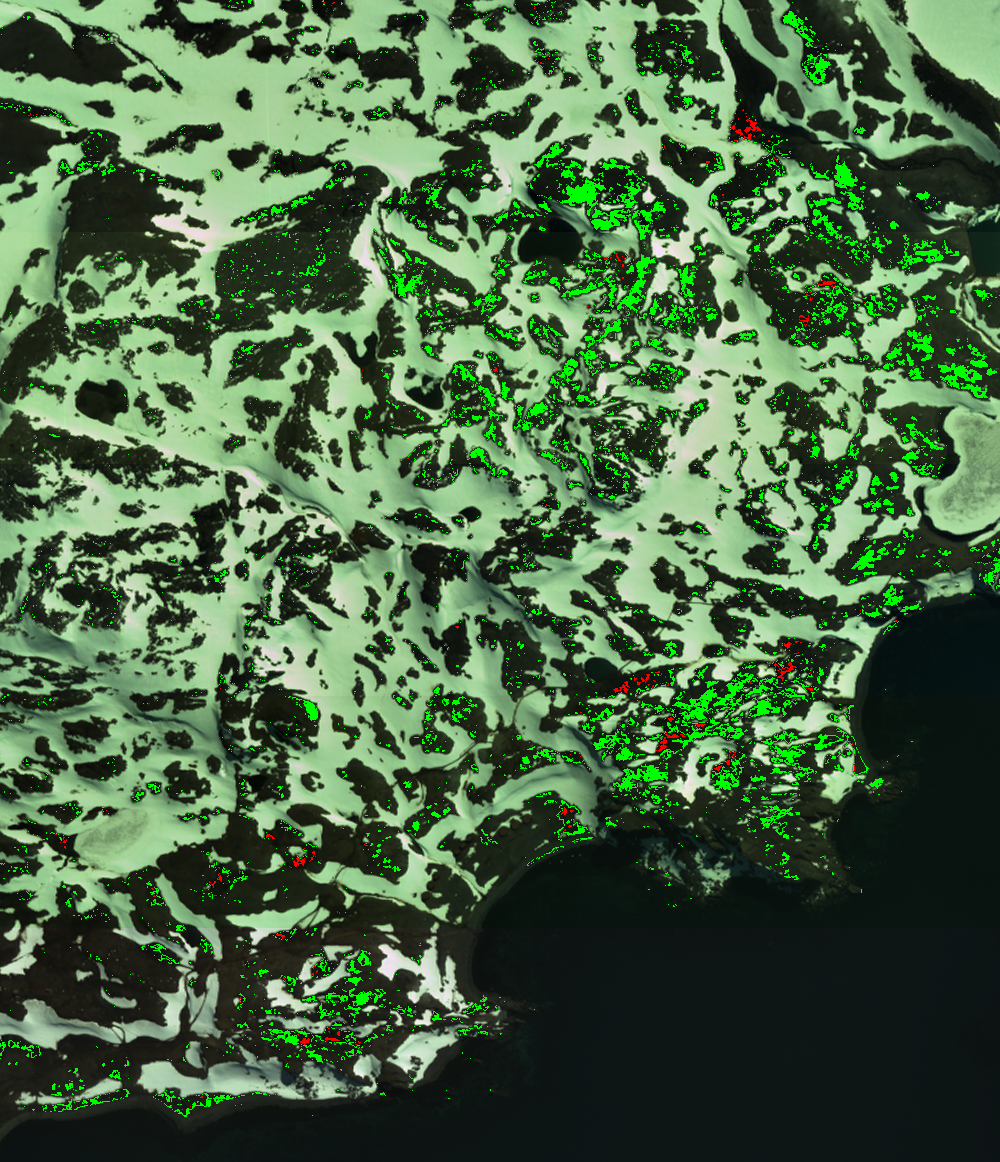
The Antarctic Peninsula is also called "Palmer peninsula" or "Graham land". Located in the southwest polar continent, it is the largest peninsula in the Antarctic continent and the farthest peninsula extending northward into the ocean (63 ° south latitude), bordering the Weddell Sea and berengske sea in the East and West. The Antarctic Peninsula is known as the "tropics" of Antarctica. This is a typical sub polar marine climate. Compared with the Antarctic continent, it is one of the warmest and wettest regions in Antarctica. There are a small number of pioneer plants distributed on the islands in the marginal area, mainly bryophytes and lichens. The plant abundance data products of Antarctic Peninsula and its surrounding areas are matched with remote sensing images through measured spectra, and the end element spectra of moss, lichen, rock, sea and snow are extracted with pure pixel PPI. The linear mixture model (LMM) is applied to calculate. The vegetation coverage of Fildes Peninsula is obtained according to the linear relationship between the vegetation coverage and the abundance.
2019-10-26 View Details
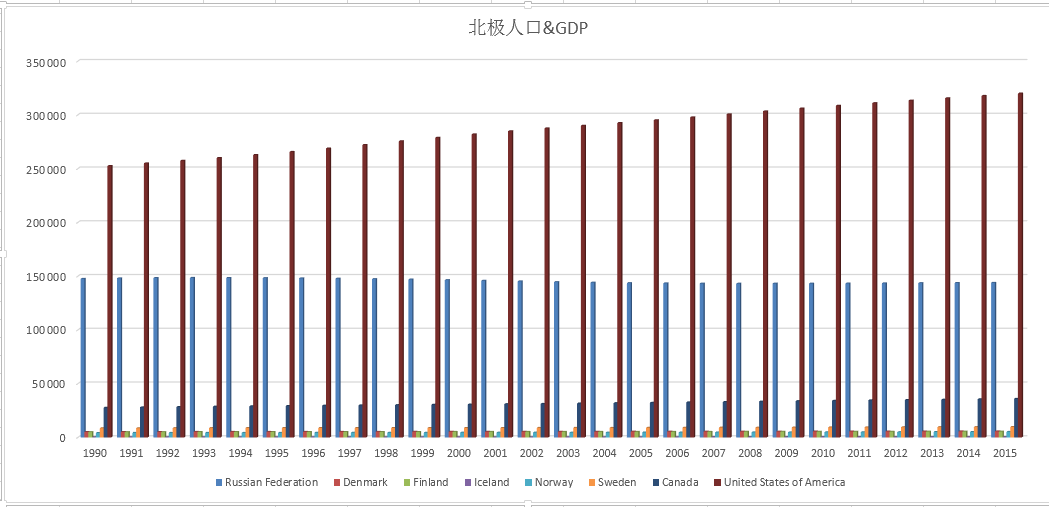
The data set includes: population and GDP data of the arctic (1990-2015) and county-level population and GDP data of the third pole region (gansu, qinghai and Tibet) (1970-2016). Socio-economic statistical attributes include: population (ten thousand), GDP (ten thousand yuan), total industrial and agricultural output (ten thousand yuan), total agricultural output (ten thousand yuan), and total industrial output (ten thousand yuan). The arctic population data are mainly derived from the world populationProspects: 2017 revision by the Department of economic and social affairs, which divides the total population by region and country. The data of the third pole mainly refer to the statistical yearbook of gansu province, qinghai province and Tibet autonomous region.County records of gansu, qinghai and Tibet autonomous regions.
2019-09-29 View Details
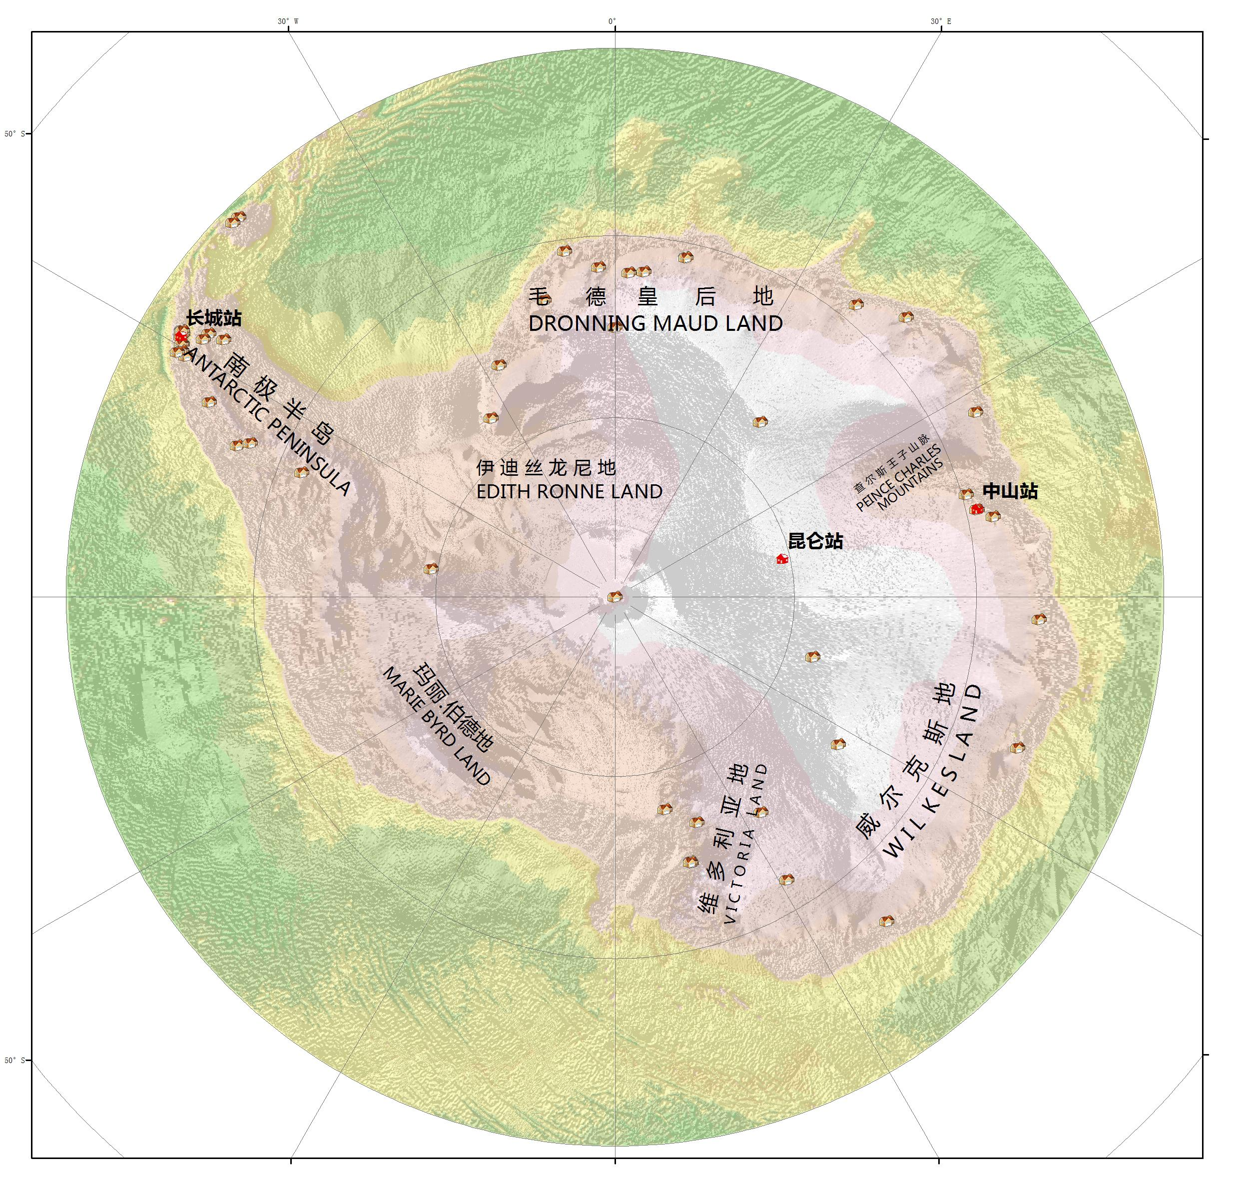
The 1:1,000,000 Antarctic settlements data set includes vector spatial data of Antarctic settlements and its related attributes:City name (ENG_NAME), city population (CNTEY_NAME), (CNTRY_CODE), etc. The data comes from the 1:100,000 ADC_WorldMap global data set,The data through topology, warehousing and other data quality inspection,Data through the topology, into the library,It's comprehensive, up-to-date and seamless geodigital data. The world map coordinate system is latitude and longitude, WGS84 datum surface,Antarctic specific projection parameters(South_Pole_Stereographic).
2019-09-15 View Details
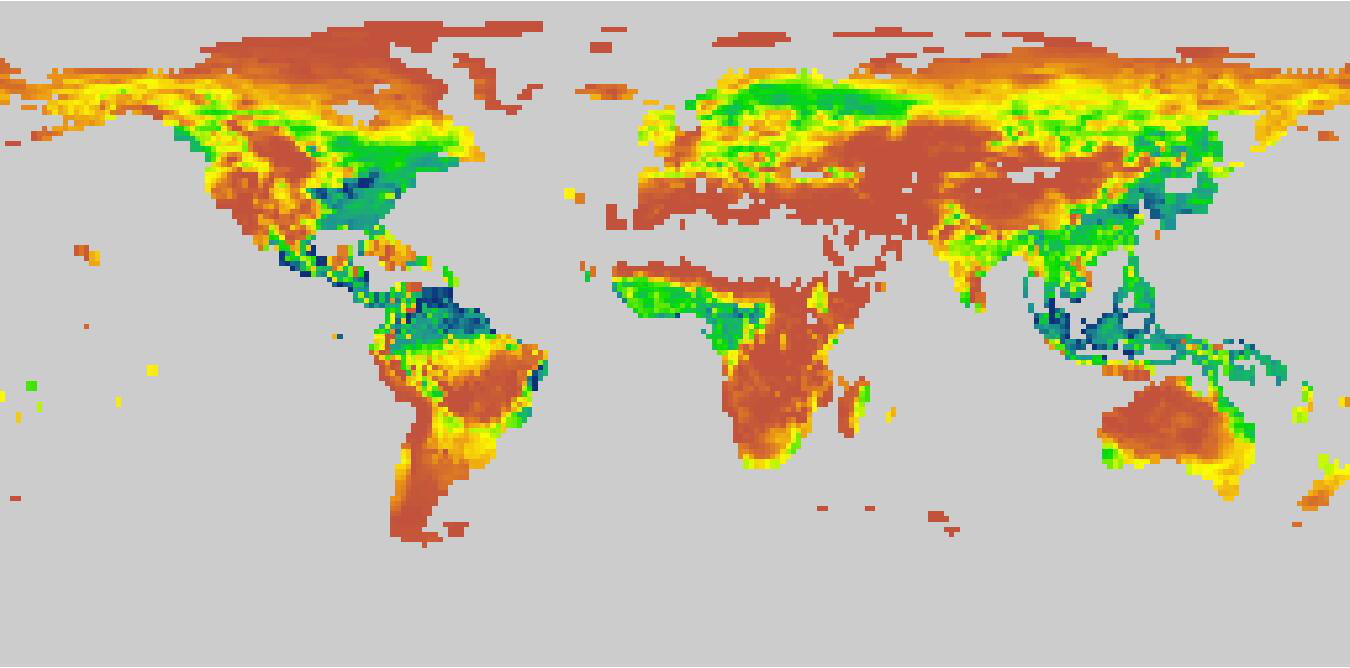
The data set is the global vegetation productivity data, including Gross Primary Productivity(GPP) and Net Primary Productivity (NPP). It was obtained by the CNRM-CM6-1 mode simulation of CMIP6 under the Historical scenario. The time range of the data covers from 1850 to 2014, the time resolution is a month, and the spatial resolution is about 1.406°×1.389°. For the simulated data details, please go to the following link: http://www.umr-cnrm.fr/cmip6/spip.php?article11.
2019-09-15 View Details
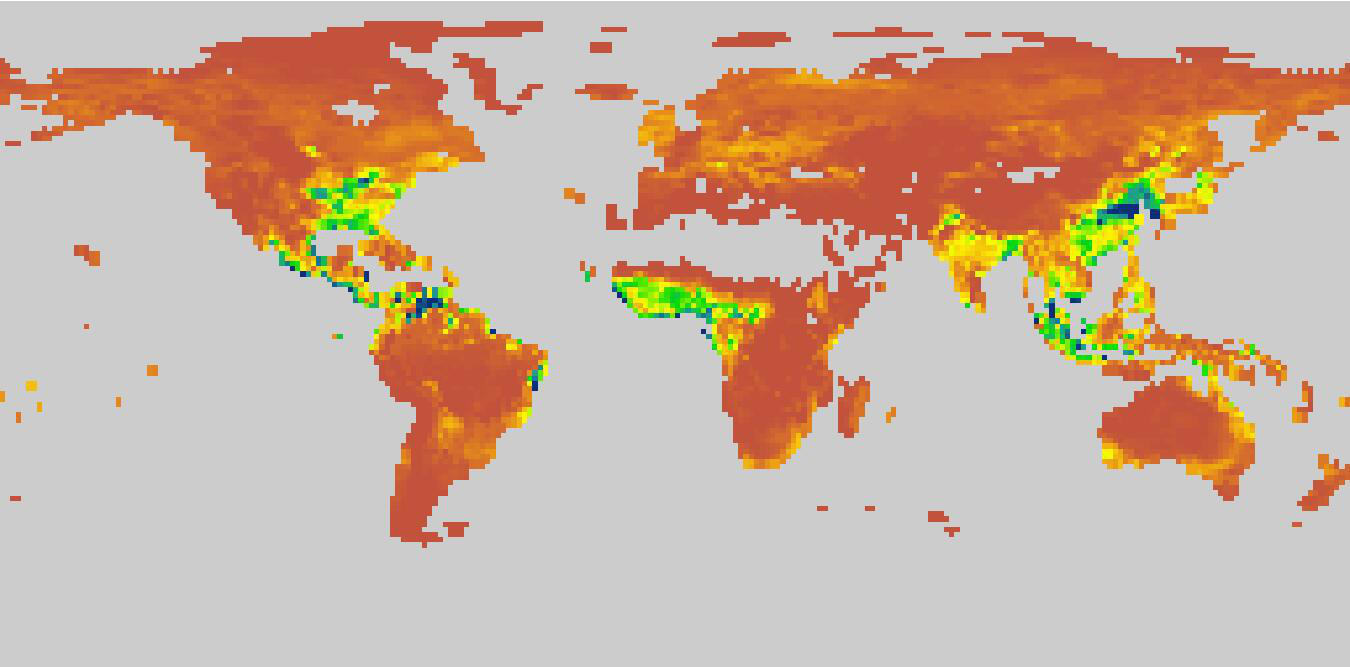
The data set is the global ecosystem respiratory data, including the ecosystem autotrophic respiration (Ra) and heterotrophic respiration (Rh). It was obtained by the CNRM-CM6-1 mode simulation of CMIP6 under the Historical scenario. The time range of the data covers from 1850 to 2014, the time resolution is a month, and the spatial resolution is about 1.406°×1.389°. For the simulated data details, please go to the following link: http://www.umr-cnrm.fr/cmip6/spip.php?article11.
2019-09-13 View Details
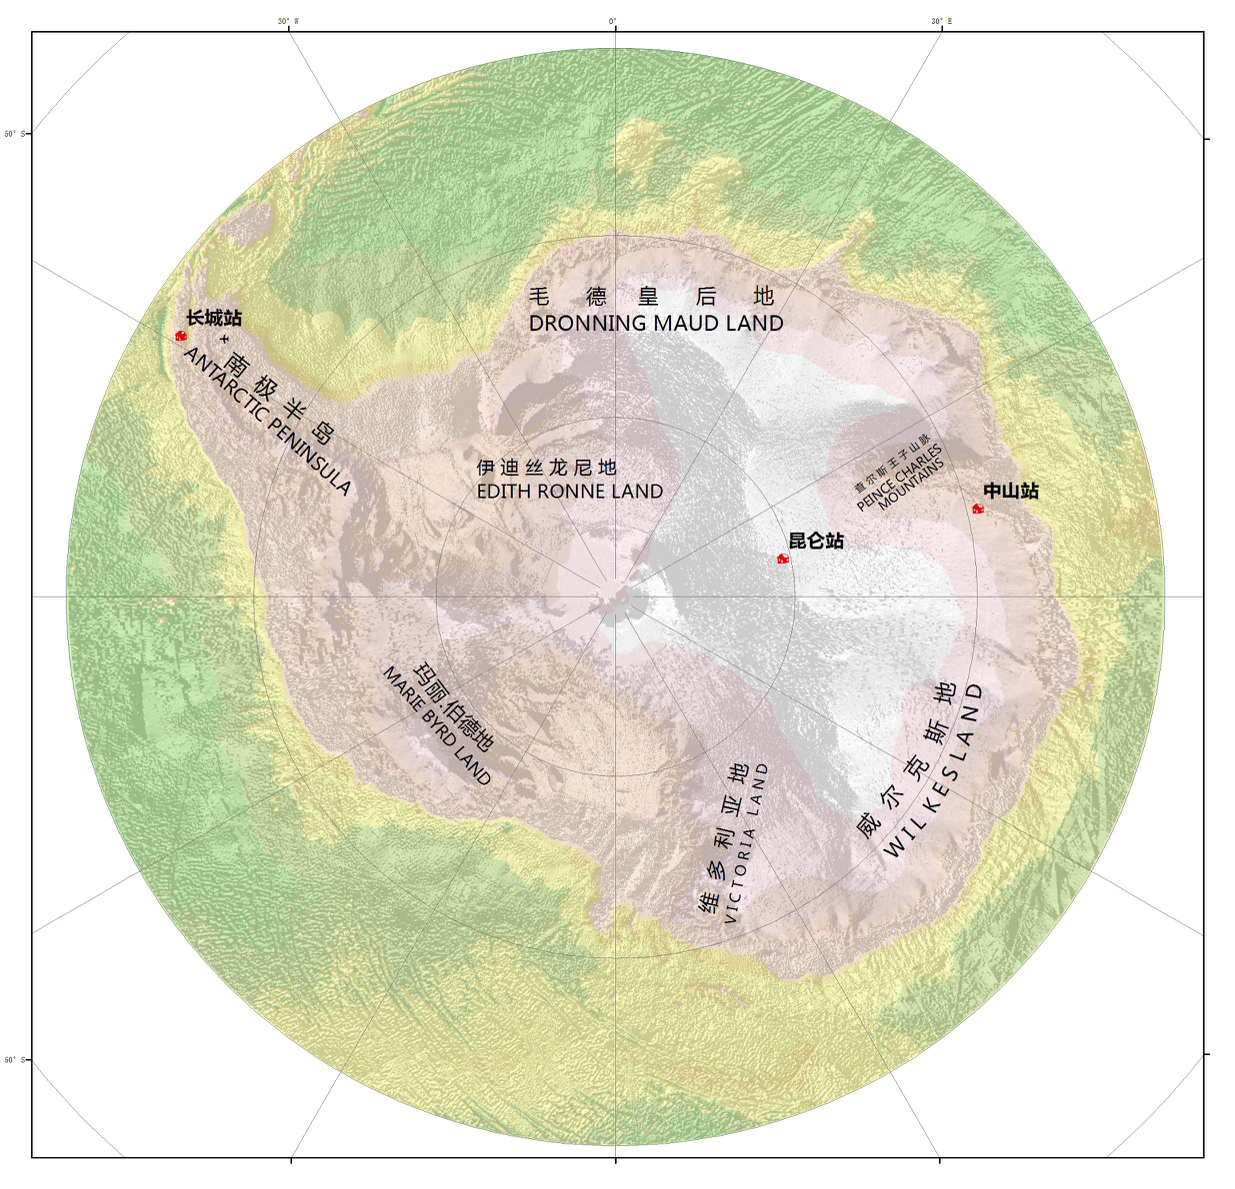
Antarctic 1:100,000 airport distribution data set includes vector space data and related attribute data of airports (Antarctic_Airport) and airport runways (Antarctic_Airport_runways):Airport Name(Name), airport country Name(CNTRY_NAME), airport country abbreviation(CNTRY_CODE), LATITUDE, LONGITUDE. The data comes from the 1:100,000 ADC_WorldMap global data set,The data through topology, warehousing and other data quality inspection,Data through the topology, into the library,It's comprehensive, up-to-date and seamless geodigital data. The world map coordinate system is latitude and longitude, WGS84 datum surface,Antarctic specific projection parameters(South_Pole_Stereographic).
2019-09-12 View Details
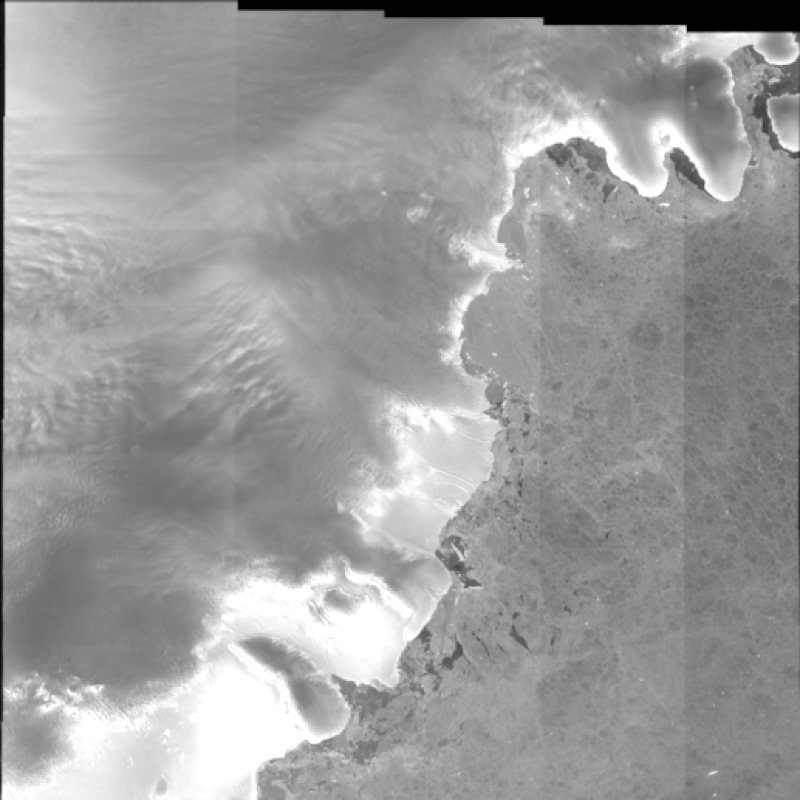
The Sentinel-1A/B satellite uses a near-polar sun-synchronous orbit with an orbital altitude of 693 km, an orbital inclination of 98.18°, and an orbital period of 99 minutes. It is equipped with a C-band Synthetic Aperture Radar (SAR) with a designed service life of 7 years (12 years expected). Sentinel-l has a variety of imaging methods that enable different polarization modes such as single-polarization and dual-polarization. Sentinel-1A SAR has four working modes: Strip Map Mode (SM), Extra Wide Swath (EW), Interferometric Wide Swath (IW) and Wave Mode (WV). Satellite A was successfully launched in April 2014. The revisit period of the same region was 12 days. Satellite B successfully operated on orbit in April 2016. The current revisiting period reached 3 to 6 days. After the operation of two satellites, the S1 data acquisition frequency in the Antarctic region increased greatly. This data set comprises the Sentinel-1 SAR data for the Antarctic ice sheet and the Greenland Ice Sheet area. The data band comprises C-band extra wide multiview data with a resolution of 20 m*40 m. The temporal resolution is 12 days and is related to the round-trip period, the width is 400 km, the noise level is -25 dB, and the radiation measurement accuracy is 1.0 dB. The annual temporal coverage of these data is October to the next March in the Antarctic and April to September in Greenland, and the spatial coverage comprises the Antarctic ice sheet ice shelf area and Greenland ice sheet.
2019-09-12 View Details
This dataset is the spatial distribution map of the marshes in the source area of the Yellow River near the Zaling Lake-Eling Lake, covering an area of about 21,000 square kilometers. The data set is classified by the Landsat 8 image through an expert decision tree and corrected by manual visual interpretation. The spatial resolution of the image is 30m, using the WGS 1984 UTM projected coordinate system, and the data format is grid format. The image is divided into five types of land, the land type 1 is “water body”, the land type 2 is “high-cover vegetation”, the land type 3 is “naked land”, and the land type 4 is “low-cover vegetation”, and the land type 5 is For "marsh", low-coverage vegetation and high-coverage vegetation are distinguished by vegetation coverage. The threshold is 0.1 to 0.4 for low-cover vegetation and 0.4 to 1 for high-cover vegetation.
2019-09-12 View Details
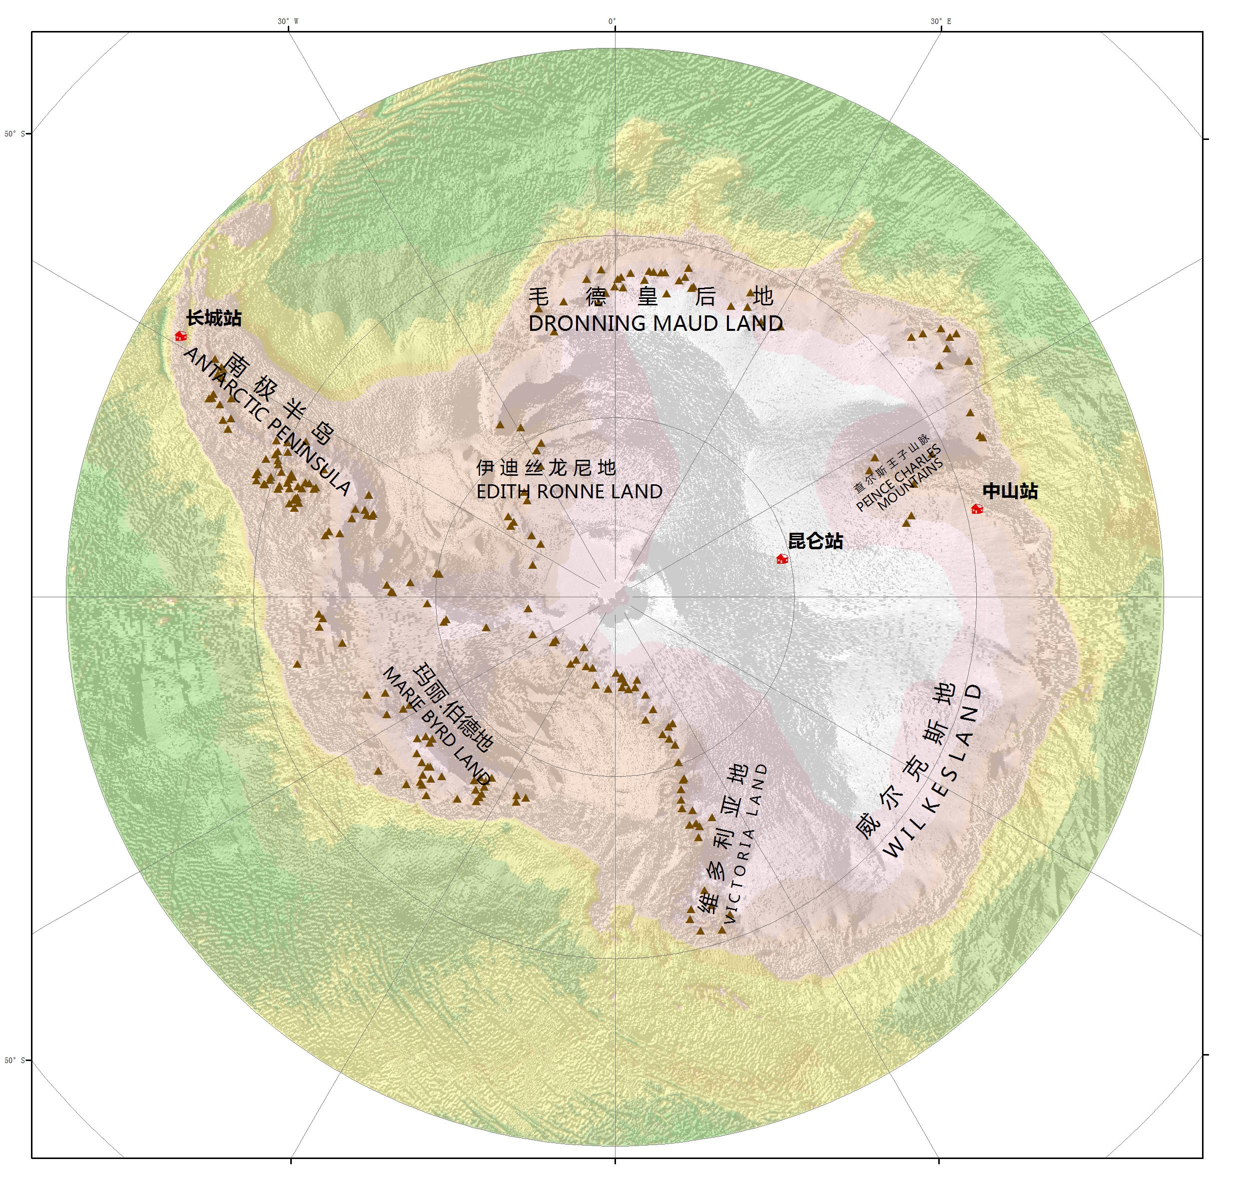
The dataset of Antarctic mountains(1:1000000) includes vector spatial distribution data and some related attribute data: Name, Country name of the mountains , Country abbreviation, Latitude、 Longitude The data comes from the ADC World Map(1:1000000) global dataset, the data is topological, and it is the comprehensive, latest and seamless geographic digital data. The world map coordinate system is the latitude and longitude, WGS84 datum, and the Antarctic data set is the South Pole Stereographic.
2019-09-12 View Details
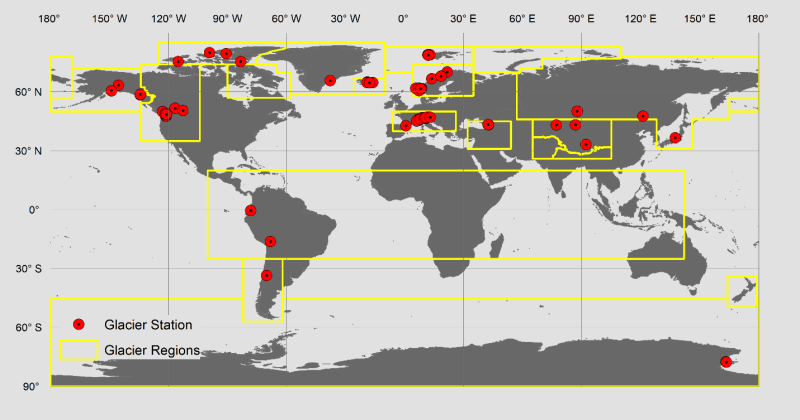
Glacier monitoring mass balance data are the most direct and reliable data for glaciers responding to climate change. The data set of global glacier monitoring mass balance collects information on 76 glaciers and their glacier mass balance data, both with continuous (uninterrupted) observation time series and by collecting and arranging globally accessible mass balance data with a time resolution of one year from 1950 to 2016.
2019-05-30 View Details
Contact Support
Links
National Tibetan Plateau Data CenterFollow Us

A Big Earth Data Platform for Three Poles © 2018-2020 No.05000491 | All Rights Reserved
|  No.11010502040845
Tech Support: westdc.cn