
Brief Introduction:The Antarctic is one of the cold sources of the Earth's atmosphere and a region that is sensitive to climate change. With global warming, Antarctica has become a key area for international programs to study global climate change. Most of the world's ice and snow is stored in the Antarctic, and more than 95% of Antarctica is covered by ice sheets with an average thickness of 2,000 meters, ice shelves and snow that is not covered all year round. It has an ice continent that can raise the global sea level by 66 meters.
Publish Datetime:2020-06-23
Number of Datasets:54
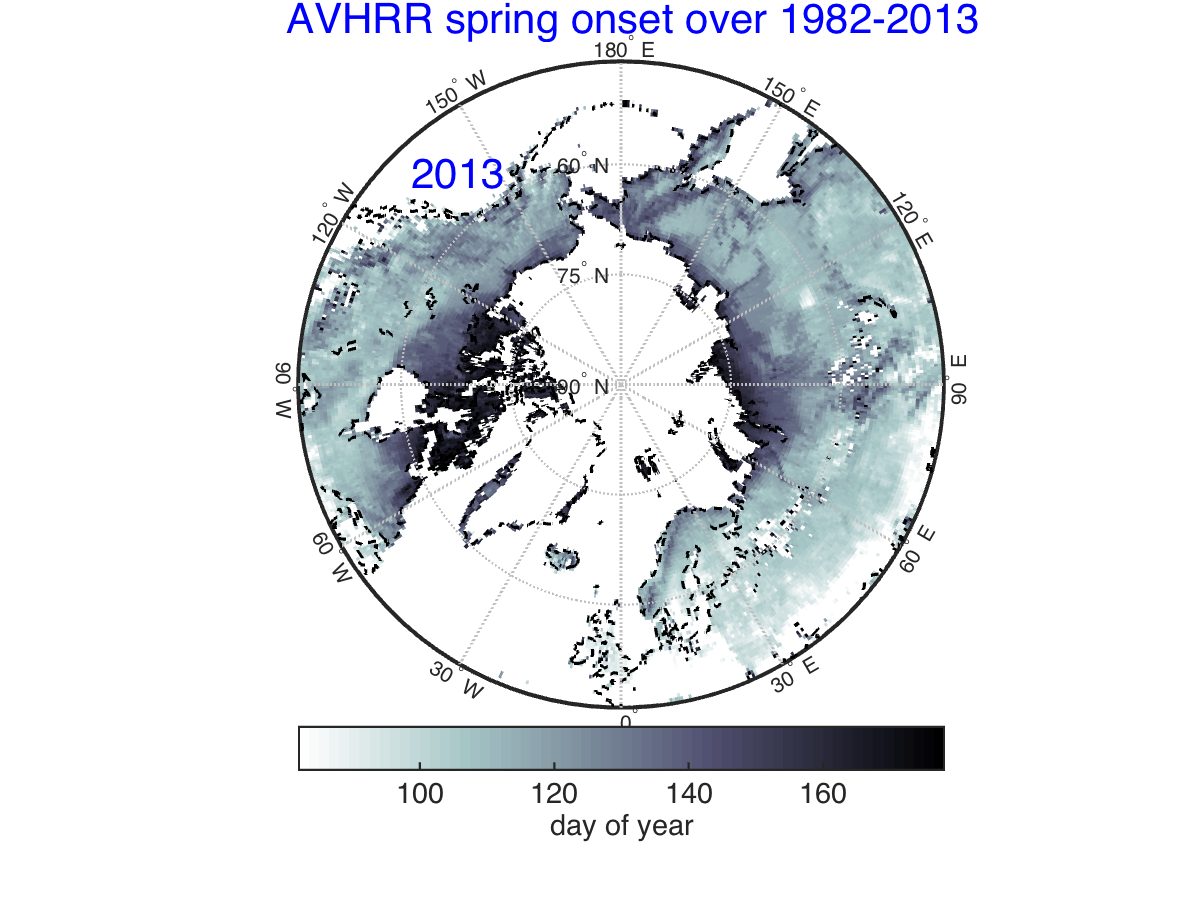
This dataset is based on the long sequence (1981-2013)normalized difference vegetation index product(Version 3) of the latest NOAA Global Inventory Monitoring and Modeling System (GIMMS). First, the NDVI data products were re-sampled from the spatial resolution of 1/12 degree to 0.5 degree, then the time series of every year was smoothed by the double-logistic method, and the smoothed curvature was calculated. The maximum curvature of spring was selected as the returning green stage of the vegetation in Spring. This data can be used to analyze the temporal and spatial characteristics of the Holarctic vegetation phenology in Spring.
2020-09-30 View Details
The NDVI data set is the latest release of the long sequence (1981-2015) normalized difference vegetation index product of NOAA Global Inventory Monitoring and Modeling System (GIMMS), version number 3g.v1. The temporal resolution of the product is twice a month, while the spatial resolution is 1/12 of a degree. The temporal coverage is from July 1981 to December 2015. This product is a shared data product and can be downloaded directly from ecocast.arc.nasa.gov. For details, please refer to https://nex.nasa.gov/nex/projects/1349/.
2020-09-30 View Details
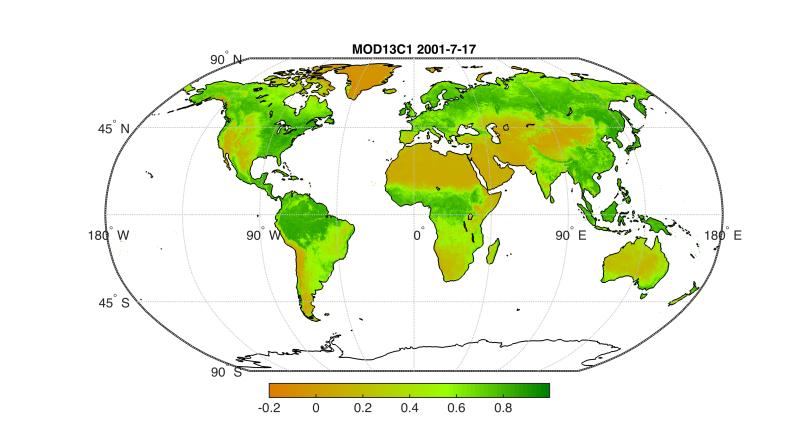
The NDVI data set is the sixth version of the MODIS Normalized Difference Vegetation Index product (2001-2016) jointly released by NASA EOSDIS LP DAAC and the US Geological Survey (USGS EROS). The product has a temporal resolution of 16 days and a spatial resolution of 0.05 degrees. This version is a Climate Modeling Grid (CMG) data product generated from the original NDVI product (MYD13A2) with a resolution of 1 kilometer. Please indicate the source of these data as follows in acknowledgments: The MOD13C NDVI product was retrieved online courtesy of the NASA EOSDIS Land Processes Distributed Active Archive Center (LP DAAC), USGS/Earth Resources Observation and Science (EROS) Center, Sioux Falls, South Dakota, The [PRODUCT] was (were) retrieved from the online [TOOL], courtesy of the NASA EOSDIS Land Processes Distributed Active Archive Center (LP DAAC), USGS/Earth Resources Observation and Science (EROS) Center, Sioux Falls, South Dakota.
2020-09-30 View Details
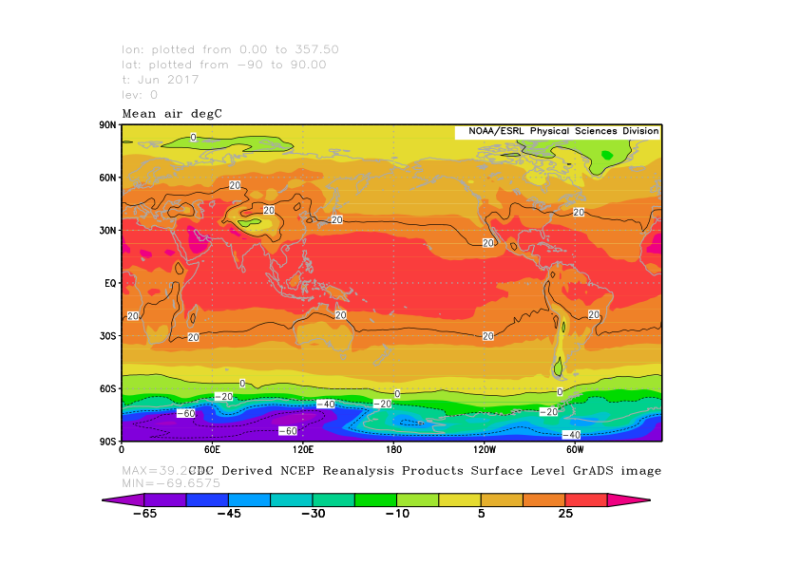
1) The data set is composed of global atmospheric reanalysis data jointly produced by the National Centers for Environmental Prediction (NCEP) and the National Center for Atmospheric Research (NCAR). These grid data are generated by reanalysing the global meteorological data from 1948 to present by applying observation data, forecasting models and assimilation systems. The data variables include surface, near-surface (.995 sigma layer) and multiple meteorological variables in different barospheres, such as precipitation, temperature, relative humidity, sea level pressure, geopotential height, wind field, heat flux, etc. 2) The coverage time is from 1948 to 2018, and the data from 1948 to 1957 are non-Gaussian grid data. The data cover the whole world. The spatial resolution is a 2.5° latitude by 2.5° longitude grid. The vertical resolution is a 17-layer standard pressure barosphere, with layer boundaries at 1000, 925, 850, 700, 600, 500, 400, 300, 250, 200, 150, 100, 70, 50, 30, 20, and 10 hPa, and 28 sigma levels. Some variables are calculated for 8 layers (omega) or 12 layers (humidity), with temporal resolutions of 6 hours, daily, monthly or a long-term monthly average (from 1981 to 2010). The daily data are obtained by averaging the daily values of 0Z, 6Z, 12Z and 18Z. 3) Missing values are assigned a value of -9.99691e+36f. The data are stored in the .nc format with the file name var.time.stat.nc, and each file includes data on latitude, longitude, time, and atmospheric variables. For detailed data specifications, please visit http://www.esrl.noaa.gov/pad/data.
2020-09-14 View Details
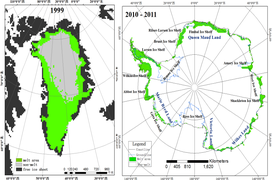
The coverage time of microwave scatterometer ice sheet freeze-thaw data is updated to 2015-2019, with a spatial resolution of 4.45km. The time resolution is day by day, and the coverage range is the polar ice sheet. The remote sensing inversion method based on microwave radiometer considers the change of snow cover characteristics in space-time and space. Firstly, the DVPR time series data of scatterometer data is extracted, the high time resolution of scatterometer data is effectively used, and the influence of terrain is removed by channel difference. Then, the variance value of time series at each sampling point is simulated by generalized Gaussian model, so as to make the region. The generalized Gaussian model needs less input parameters than the traditional double Gaussian model, and the obtained threshold is also unique. Finally, the moving window segmentation algorithm is used to accurately find the melting start time, end time and duration of the wet snow point, which can effectively remove the temperature mutation in the melting or non melting period. The impact. The data of long time series microwave scatterometer are from QSCAT and ASCAT. The verification of the measured stations shows that the detection accuracy of ice sheet freezing and thawing is over 70%. The data is stored in a bin file every day. Each file of Antarctic freeze-thaw data based on microwave scatterometer is composed of 810 * 680 grid, and each file of Greenland ice sheet freeze-thaw data is composed of 810 * 680 grid (0 value: non melting area, 1 Value: melting area).
2020-09-14 View Details
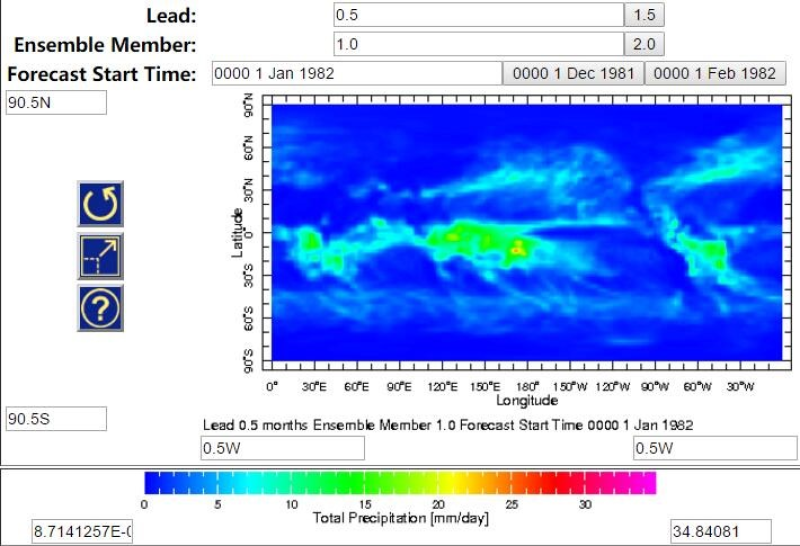
The North American Multi-Model Ensemble (NMME) Forecast is a multi-modal ensemble seasonal forecasting system jointly published by the US Model Center (including NOAA/NCEP, NOAA/GFDL, IRI, NCAR, and NASA) and the Canadian Meteorological Centre. The data include retrieval data from 1982 to 2010 and real-time weather forecast data from 2011 to the present. The forecasting system covers the whole world with a temporal resolution of one month and a horizontal spatial resolution of 1°. NMME has nine climate forecasting models, and each contains 6-28 ensemble members, with a forecasting period of 9-12 months. The name, source, ensemble members, and forecasting period of the climate models are as follows: 1) CMC1-CanCM3, Environment Canada, 10 models, 12 months 2) CMC2-CanCM4, Environment Canada, 10 models, 12 months 3) COLA-RSMAS-CCSM3, National Center for Atmospheric Research, 6 models, 12 months 4) COLA-RSMAS-CCSM34, National Center for Atmospheric Research, 10 models, 12 months 5) GFDL-CM2p1-aer04, NOAA Geophysical Fluid Dynamics Laboratory, 10 models, 12 months 6) GFDL-CM2p5-FLOR-A06, NOAA Geophysical Fluid Dynamics Laboratory, 12 models, 12 months 7) GFDL-CM2p5-FLOR-B01, NOAA Geophysical Fluid Dynamics Laboratory, 12 models, 12 months 8) NASA-GMAO-062012, NASA Global Modeling and Assimilation Office, 12 models, 9 months 9) NCEP-CFSv2, NOAA National Centers for Environmental Prediction, 24/28 models, 10 months With the exception of the CFSv2 model (which includes only precipitation and average temperature), the variables of other models include precipitation, average temperature, maximum temperature, and minimum temperature. Each model ensemble member stores one NC file every month for each variable. The meteorological elements, variable names, units, and physical meanings of each variable are as follows: 1) Average temperature, tref, K, monthly average near-surface (2-m) average air temperature 2) Maximum temperature, tmax, K, monthly average near-surface (2-m) maximum air temperature 3) Minimum temperature, tmin, K, monthly average near-surface (2-m) minimum air temperature 4) Precipitation, prec, mm/day, monthly average precipitation. The dataset has been widely applied in climate forecasting, hydrological forecasting, and quantitatively estimating model forecasting uncertainty.
2020-06-03 View Details
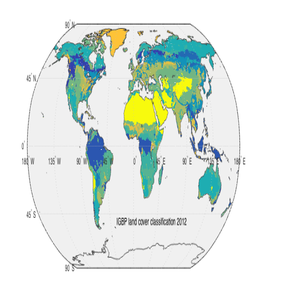
The MODIS land cover type product is a data classification product (MOD12Q1) with different classification schemes for land cover features extracted from Terra data each year. These data are generated by reprojecting the standard MODIS land cover product MOD12Q1 to geographic coordinates with a spatial resolution of one-half degree. The basic land cover classification comprises the 17 types defined by the International Geosphere Biosphere Programme (IGBP): 11 types of natural vegetation classification, 3 types of land use and land inlays, and 3 types of nonvegetation land classification. It covers a longitude range of -180-180 degrees and a latitude range of -64-84 degrees. The data are in GeoTIFF format. This data are free to use, and the copyright belongs to the University of Maryland Department of Geography and NASA.
2020-06-03 View Details
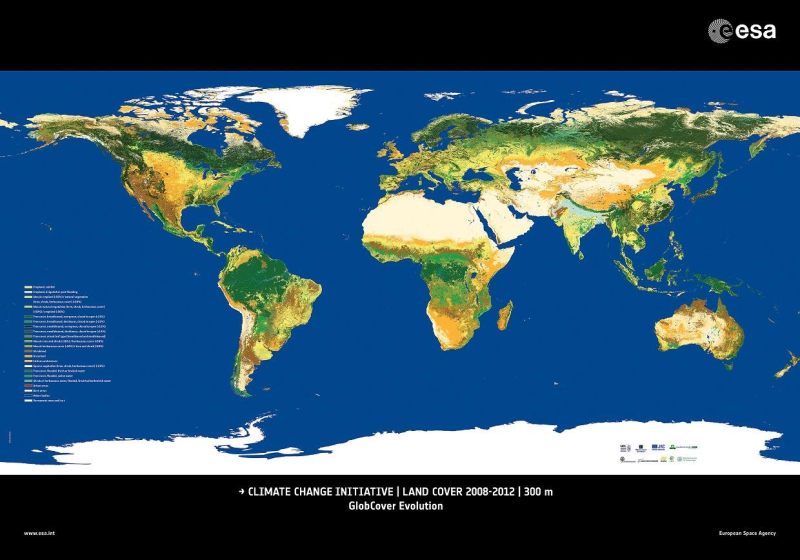
The land cover classification product is the second phase product of the ESA Climate Change Initiative (CCI), with a spatial resolution of 300 meters and a temporal coverage of 1992-2015. The spatial coverage is latitude -90-90 degrees, longitude -180-180 degrees, and the coordinate system is the geographic coordinate WGS84. The classification of the surface coverage is based on the Land Cover Classification System (LCCS) of the Food and Agriculture Organization of the United Nations. When the data are used for scientific research purposes, the ESA CCI Land Cover project should be acknowledged. In addition, the published article should be send to contact@esalandcover-cci.org.
2020-06-03 View Details
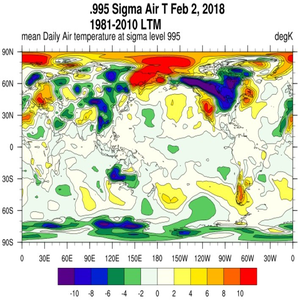
NCEP/NCAR Reanalysis 1 is an assimilation of data from the past (1948-recent). It was developed by the National Centers for Environmental Prediction-National Center for Atmospheric Research (NCEP–NCAR) in the US to act as an advanced analysis and prediction system. Most of the data are from the original daily average data of the PSD (Physical Sciences Division). However, the data from 1948 to 1957 are slightly different because these data are conventional (non-Gaussian) grid data. The information published on the official website is generally from 1948 to the present, and the latest information is generally updated every two days. For data on an isostatic surface, the general vertical resolution is 17 layers, from 1000 hPa to 10 hPa. The horizontal resolution is typically 2.5° x 2.5°. The NCEP reanalysis data are systematically comparable among international atmospheric science reanalysis data sets. Compared with the reanalysis data of the European Center, the initial year is earlier, and the latest data updates are more frequent. These two sets of reanalysis data are currently the most widely used data sets in the world. For details of the data, please visit the following website: https://www.esrl.noaa.gov/psd/data/gridded/data.ncep.reanalysis.html
2020-06-03 View Details
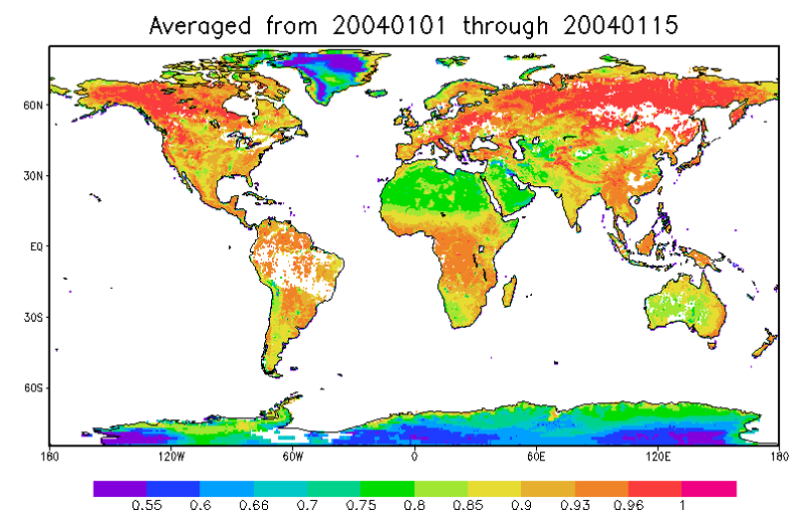
The aerosol optical thickness data of the Arctic Alaska station is based on the observation data products of the atmospheric radiation observation plan of the U.S. Department of energy at the Arctic Alaska station. The data coverage time is updated from 2017 to 2019, with the time resolution of hour by hour. The coverage site is the northern Alaska station, with the longitude and latitude coordinates of (71 ° 19 ′ 22.8 ″ n, 156 ° 36 ′ 32.4 ″ w). The source of the observed data is retrieved from the radiation data observed by mfrsr instrument. The characteristic variable is aerosol optical thickness, and the error range of the observed inversion is about 15%. The data format is NC format. The aerosol optical thickness data of Qomolangma station and Namuco station in the Qinghai Tibet Plateau is based on the observation data products of Qomolangma station and Namuco station from the atmospheric radiation view of the Institute of Qinghai Tibet Plateau of the Chinese Academy of Sciences. The data coverage time is from 2017 to 2019, the time resolution is hour by hour, the coverage sites are Qomolangma station and Namuco station, the longitude and latitude coordinates are (Qomolangma station: 28.365n, 86.948e, Namuco station Mucuo station: 30.7725n, 90.9626e). The source of the observed data is retrieved from the radiation data observed by mfrsr instrument. The characteristic variable is aerosol optical thickness, and the error range of the observed inversion is about 15%. The data format is TXT.
2020-06-03 View Details
The data set of prokaryotic microorganism distribution in the snow and ice of the Arctic Antarctic and the Tibetan Plateau provides the bacterial 16S ribosomal RNA gene sequence collected by the experimental group led by Yongqin Liu from the NCBI database during 2010 to 2018. The keywords for NCBI database search are Antarctic, Arctic Tibetan, and Glacier. The collected sequences were calculated using the DOTOUR software to obtain the similarities between sequences, the sequences with similarities above 97% were clustered into one OTU, and the OTU representative sequence was defined. The OTU representative sequence was compared with the RDP database by the "Classifier" software and was identified as level one when the reliability exceeded 80%. After acquiring the sequence, the GPS coordinates of the sample were obtained by reading the sample information in the sequence file. These data contain the sequence of 16S ribosomal RNA gene fragments for each sequence, evolutionary classification, and sample GPS coordinates. Compared with sequences based on high-throughput sequencing, these data have a longer sequence and more accurate classification. It is significant for comparing the evolutionary information of three-pole microorganisms and understanding the evolution of psychrophilic microorganisms.
2020-06-03 View Details
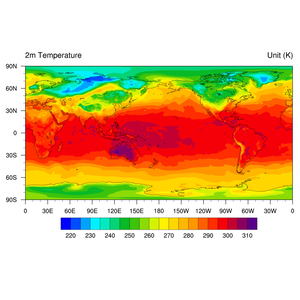
The data set of ERA-Interim global surface air temperature reanalysis (1979-2016) was obtained from the European Center for Medium-Range Weather Forecasts (ECMWF) by adopting the ECMWF IFS forecasting system (T255, 60 layers) and using the four-dimensional variational assimilation system (8DVAR) with an analysis window of 12 hours to assimilate satellite remote sensing data (TOVS, GOES, Meteosat, etc.) and regular observations of the surface and upper atmosphere in different regions of the world and from different sources. The surface air temperature (2 m air temperature) data span the time range from January 1979 to December 2016 and cover the whole world with the projection of equal latitude and longitude, a temporal resolution of six hours, and a horizontal resolution of 0.75. The data were stored as a NetCDF format file once a month and included longitude, latitude, time, and temperature (t2m, unit: K), with 241 latitudinal grid points and 480 longitudinal grid points.
2020-06-03 View Details
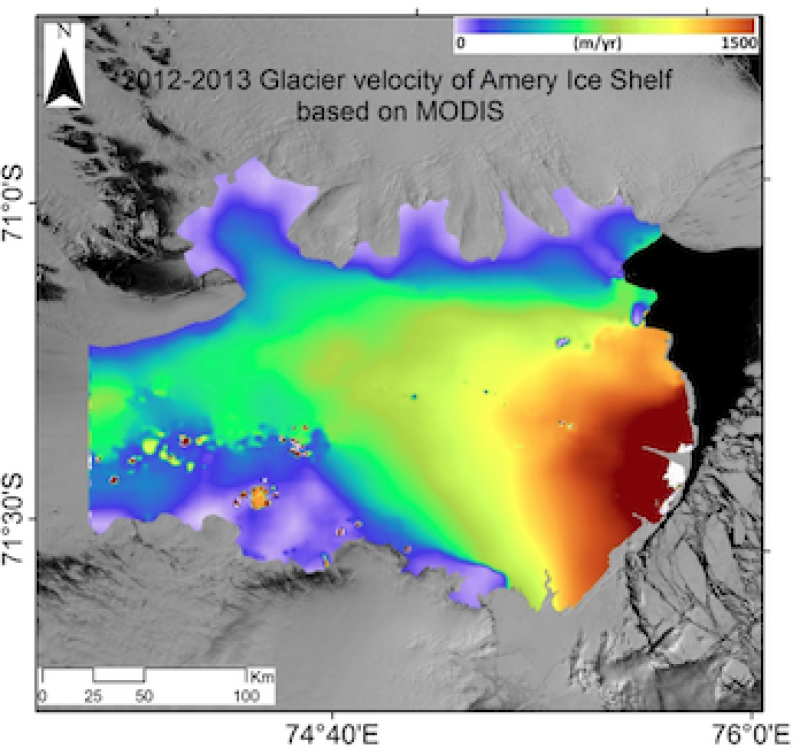
Using the Modis1B data of 11 scenes from 2003 to 2013 (the ice shelf Modis1B data published on the NSIDC website), the surface velocity of the Antarctic Amery Ice Shelf was extracted by the subpixel cross-correlation method, the ice velocity was extracted by the COSI-Corr software, and then the time sequence of annual average velocities for nearly ten years was obtained. Due to the lack of field observations in the study area, the accuracy of the ice flow results was estimated by using the offset value of the stable region, and the ice flow error was approximately ±50 m/year. The ice velocity data date from 2003 to 2013, the temporal resolution is one year, and the data cover the Amery area with a spatial resolution of 500 m. A GeoTIFF file of velocity data is stored every year. For details regarding the data, please refer to the Amery Ice Flow Field - Data Description.
2020-04-29 View Details
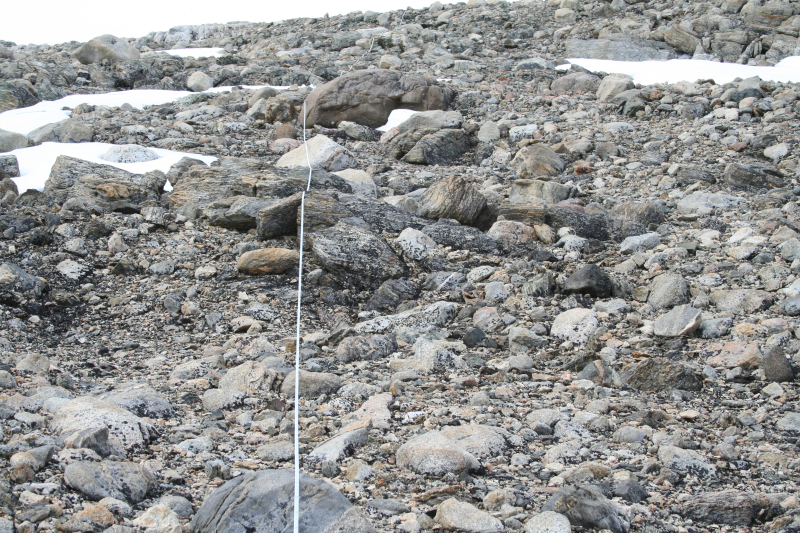
The Antarctic and Arctic bacterial distribution data set provides distribution characteristics of bacteria in the Arctic and Antarctic. The collection period of the samples was from December 13,2005, to December 8,2006; 52 samples were obtained from 3 Arctic regions (Spitsbergen Slijeringa, Spitsbergen Vestpynten, and Alexandra Fjord_Highlands), and 171 samples were obtained from 5 Antarctic regions (the Mitchell Peninsula, Casey station main Power house, Robinsons Ridge, Herring Island, and Browning Peninsula). The soil surface samples were stored in liquid nitrogen after collection, shipped to a Sydney laboratory, and extracted using the FastPrep DNA kit. The extracted DNA samples were processed by 27F (5'-GAGTTTGATCNTGGCTCA-3' and 519R (5'-GTNTTACNGCGGCKGCTG-3') to amplify the 16S rRNA gene fragments. The amplified fragments were sequenced by the 454 method, and the raw data were analyzed by Mothur software. First, the sequences with poor sequencing quality were removed, the sequences were then sorted, and the chimera sequences were removed. The similarities between the sequences were calculated, the sequences with similarities above 97% were clustered into one OTU, and the OTU representative sequence was defined. By comparison with the Silva database, the OTU sequences with reliabilities greater than 80% were identified as level one. This data system compared the diversity of microorganisms in the eastern Antarctic with that in the Arctic and is of great significance for the study of the distributions of microorganisms in the Antarctic and Arctic.
2020-04-29 View Details
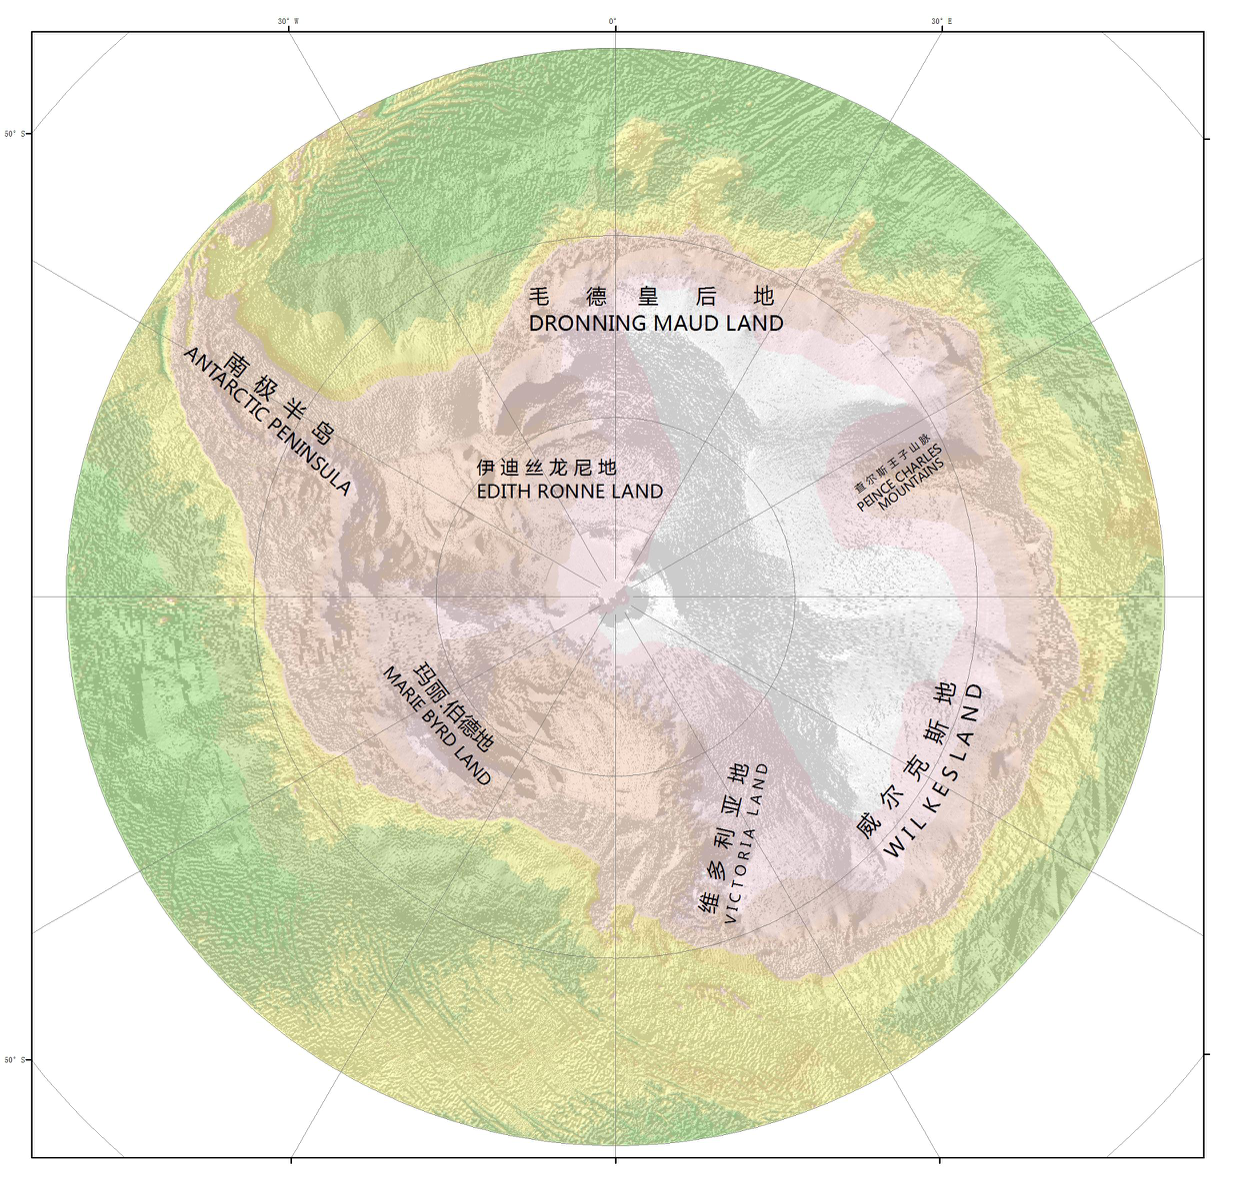
This data set provides a 1 km resolution Digital Elevation Model (DEM) of Antarctica. The DEM combines measurements from the European Remote Sensing Satellite-1 (ERS-1) Satellite Radar Altimeter (SRA) and the Ice, Cloud, and land Elevation Satellite (ICESat) Geosciences Laser Altimeter System (GLAS). The ERS-1 data are from two long repeat cycles of 168 days initiated in March 1994, and the GLAS data are from 20 February 2003 through 21 March 2008. The data set is approximately 240 MB comprised of two gridded binary files and two Environment for Visualizing Images (ENVI) header files viewable using ENVI or other similar software packages. The data are available via FTP.
2020-03-13 View Details
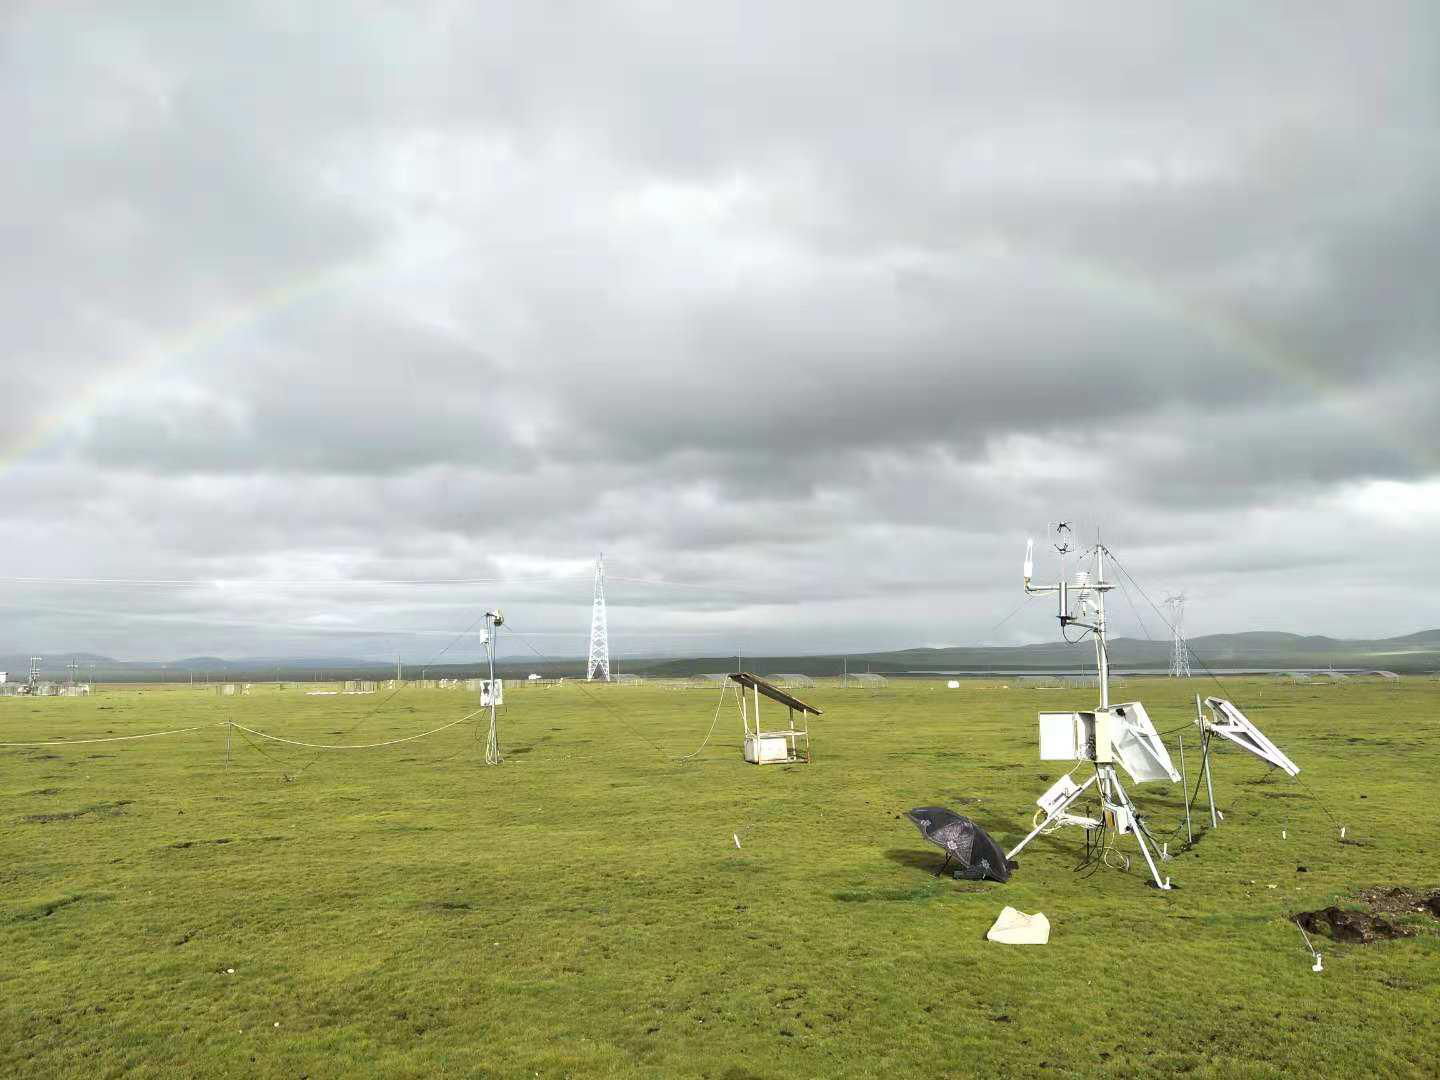
The dataset is a 30-minute eddy covariance flux observation data from nine flux stations in the Three Poles, including the data of ecosystem Net Carbon Exchange (NEE), Gross Primary Productivity(GPP), and Ecosystem Respiration (ER) . The time coverage of the data is from 2000 to 2016. The main steps of data pre-processing include outlier removal (±3σ), coordinate axis rotation(three-dimensional wind rotation), Webb-Pearman-Leuning correction, outlier elimination, carbon flux interpolation and decomposition. And missing data is interpolated by the nonlinear empirical formula between CO2 flux value(Fc) and environmental factors.
2020-01-19 View Details
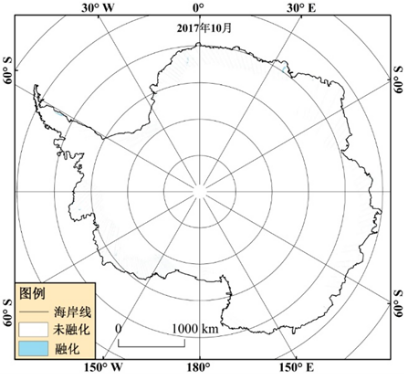
At present, based on the proposed SAR ice sheet freeze-thaw detection algorithm using change detection and decision tree algorithm, the monthly average ice sheet freeze-thaw is detected using sentinel-1 EW SAR data. At the same time, using the developed production module of freeze-thaw products based on big data platform, the international first production of Antarctic ice sheet and Greenland ice sheet freeze-thaw products. Through the development of automatic weather station temperature data, the ice sheet freeze-thaw detection accuracy reaches 90%. At present, the acquisition time of data products is mainly the summer of the north and south poles, among which the Antarctic ice sheet products are January, February, March, October, November, December and Greenland products are may, June, July, August, September and October.
2020-01-19 View Details
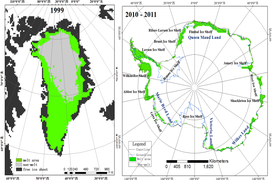
The coverage time of microwave radiometer ice sheet freeze-thaw data set is updated to 2016-2019, with a spatial resolution of 25 km; the remote sensing inversion method based on microwave radiometer adopts the improved wavelet based ice sheet freeze-thaw detection algorithm, which takes into account the change of ice sheet freeze-thaw brightness temperature characteristics in time. First, the long-time brightness temperature data of all ice sheet areas in Greenland is small by using wavelet transform. The multi-scale decomposition of wave is used to analyze the edge information at different scales. Thirdly, the edge information of ice sheet melting and refreezing is separated from the noise by ANOVA. Based on the extracted edge information of long-term brightness and temperature change of ice sheet, the optimal edge threshold of dry snow and wet snow classification is determined by using the generalized Gaussian model, so as to detect the melting area of Greenland ice sheet. Finally, based on the principle of space automatic error correction, the error results caused by noise are detected by using the space neighborhood error correction operator, and the error is corrected manually. The brightness and temperature data of passive microwave in long time series come from SMMR, SSM / I and SSMI / s sensors. To ensure simultaneous interpreting of the brightness temperature of different sensors, simultaneous interpreting of different sensor brightness temperatures is made before freezing and thawing. Through the verification of the actual measurement site, it shows that the detection accuracy of Greenland ice sheet freeze-thaw is more than 70%.
2020-01-19 View Details
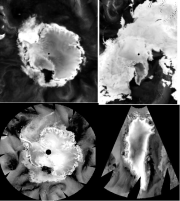
The microwave radiometer data set comprises brightness temperature data from SMMR (1978-1987), SSM/I (1987-2009) and SSMIS (2009-2015), with temporal coverage from 1978 to 2015 and a spatial resolution of 25 km. Each Antarctic data file consists of 316*332 grids, and each Arctic freeze-thaw data file consists of 304*448 grids. The microwave scatterometer data set comprises backscattering data from QScat (2000-2009) and ASCAT (2009-2015), with a temporal coverage from 2000 to 2015 and a spatial resolution of 4.45 km. Each Antarctic data file consists of 1940*1940 grids, and each Arctic data file consists of 810*680 grids. The temporal resolution of the data set is one day, and the data cover both Antarctica and Arctic ice sheets.
2020-01-19 View Details
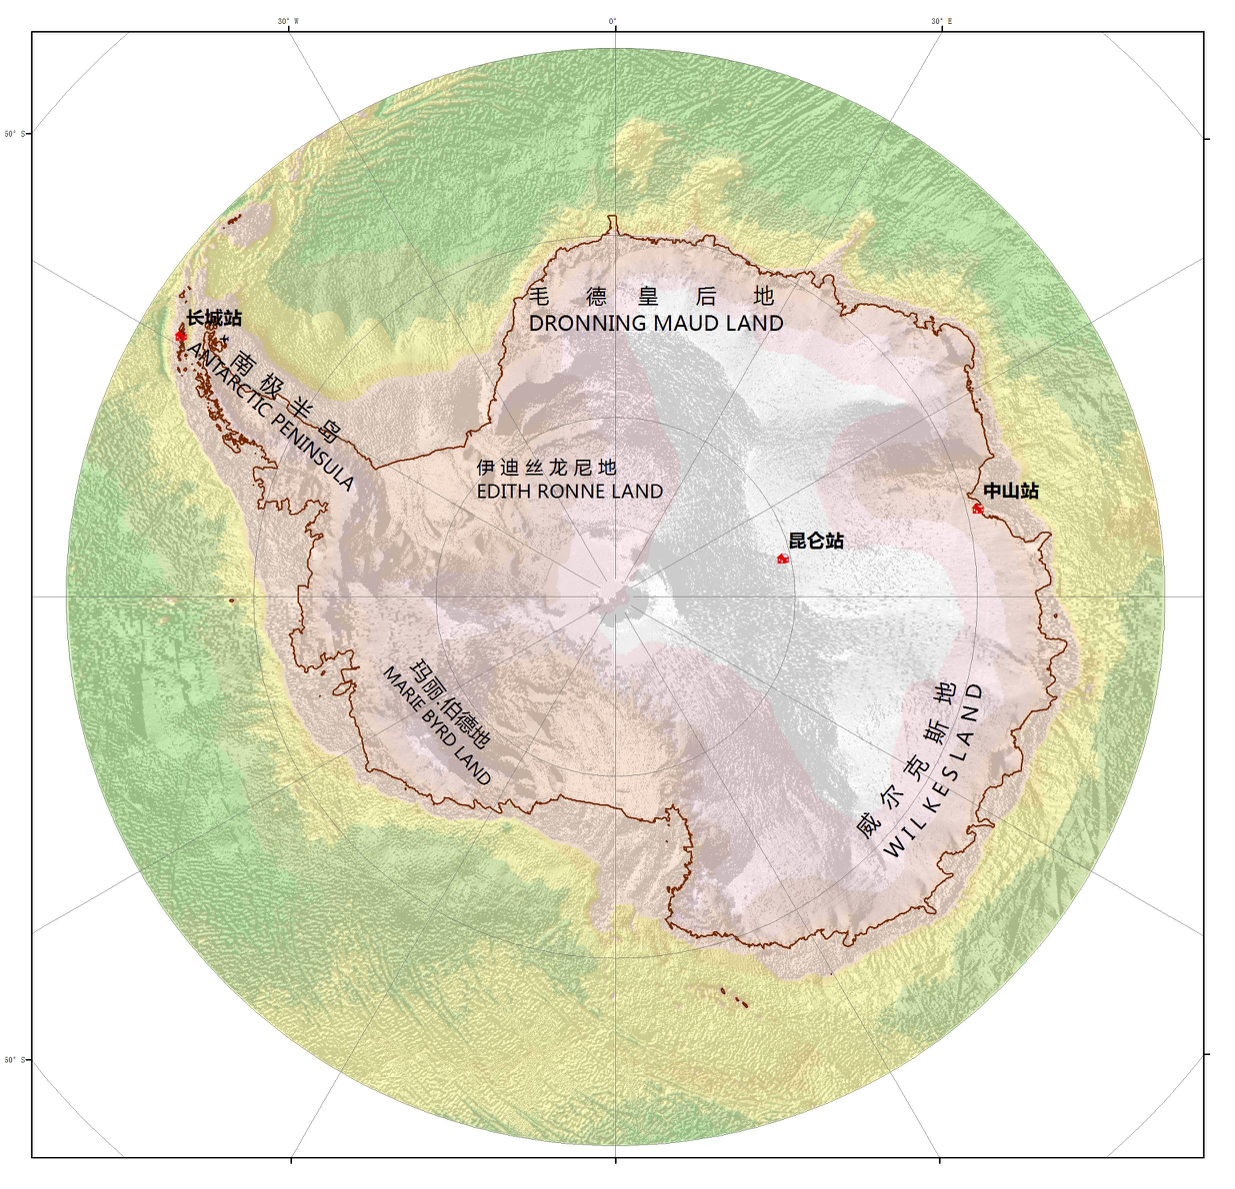
Antarctic administrative boundary datasets consist of the properties of the state boundaries of the Antarctic states (properties properties), and the corresponding names and types of those properties :(CITY_POP), (ENG_NAME), (CNTRY_NAME), (TYPE), (CNTRY_CODE), (YEAR). The data comes from the 1:100,000 ADC_WorldMap global data set,The data through topology, warehousing and other data quality inspection,Data through the topology, into the library,It's comprehensive, up-to-date and seamless geodigital data. The world map coordinate system is latitude and longitude, WGS84 datum surface,Antarctic specific projection parameters(South_Pole_Stereographic).
2020-01-12 View Details
Contact Support
Links
National Tibetan Plateau Data CenterFollow Us

A Big Earth Data Platform for Three Poles © 2018-2020 No.05000491 | All Rights Reserved
|  No.11010502040845
Tech Support: westdc.cn