
Brief Introduction:The Arctic region is one of the regions most sensitive to climate change and has long received great attention from climate change research. Despite the recent signs of slowing or even stagnation in global warming, climate change in the Arctic has accelerated markedly over the past few decades: on the one hand, sea ice cover in the Arctic summer and autumn is accelerating melting ( As shown in Figure 1), the historical low value of the Arctic sea ice cover area is constantly refreshed. The sea ice cover area in September 2012 is only equivalent to 51% of the average sea ice area from 1979 to 2000, compared to the early 1980s. More than half of the sea ice has disappeared in the summer. The rate of sea ice reduction in 2002-2011 was twice as fast as it was between 1979 and 2006...
Publish Datetime:2018-10-25
Number of Datasets:71

Under the summer sunlight, the snow covering the ice melts, forming different shapes and sizes of ice pools on the ice. The melting pool caused by the melting of the sea ice surface will reduce the sea ice albedo, which will have a significant impact on the energy balance in the polar region, increasing absorption and thus accelerating the sea ice melting process. Among the factors that affect the sea ice albedo, melting pool is one of the most important and most violent factors. With climate change, the rate of ice melting in summer is also getting faster and faster. The energy balance on the Earth's surface has a significant impact, and the acceleration of ice melting speed may also make the melting pool, an important natural phenomenon, one of the most significant ice surface features during the Arctic sea ice melting season. The albedo of melting pool is between sea water and sea ice. The study of melting pool on ice is also an important part of the study of the rapid change mechanism of Arctic sea ice. Due to the similar microwave signal characteristics between sea ice melting pools and the sea surface, and the significant uncertainty of using microwave data to map melting pool coverage due to factors such as wind speed and sea ice melting, the most reliable remote sensing method for melting pool coverage is to use medium resolution optical remote sensing data (such as MODIS) to map sub pixel melting pool coverage. This dataset includes the use of MODIS data for sub pixel decomposition inversion of Arctic sea ice melting pool coverage and sea ice concentration based on dynamic end element reflectance.
2023-06-07 View Details
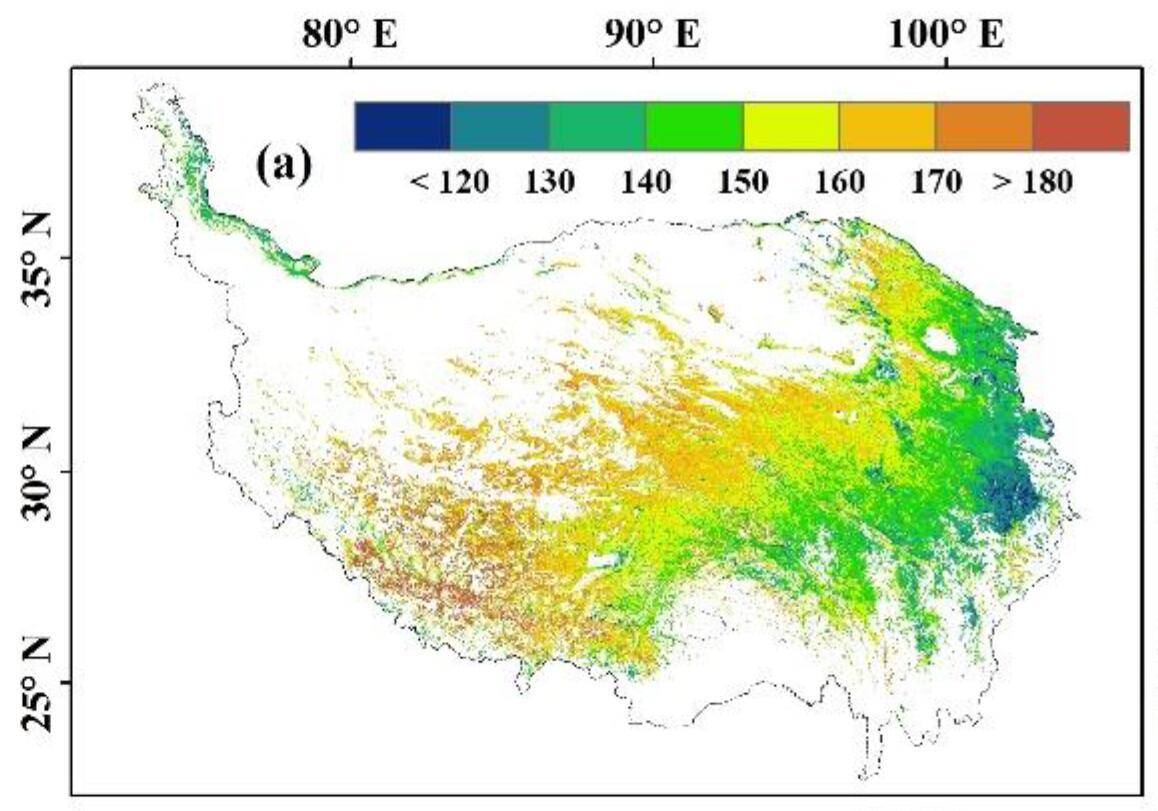
This phenological data is based on the MOD13A2 data of the Qinghai Tibet Plateau from 2000 to 2015 (with a temporal resolution of 16 days and a spatial resolution of 1km). The NDVI curve is fitted using the segmented Gaussian function in the TIMESAT software. The spring phenology, autumn phenology and the length of the growth season are extracted using the dynamic threshold method. The thresholds of spring phenology and autumn phenology are set to 0.2 and 0.7 respectively. The phenological data were masked. Among them, the mask rules are: 1) The maximum value of NDVI must be met between June and September; 2) The average value of NDVI from June to September shall not be less than 0.2; 3) The average NDVI in winter shall not exceed 0.3.
2022-10-24 View Details
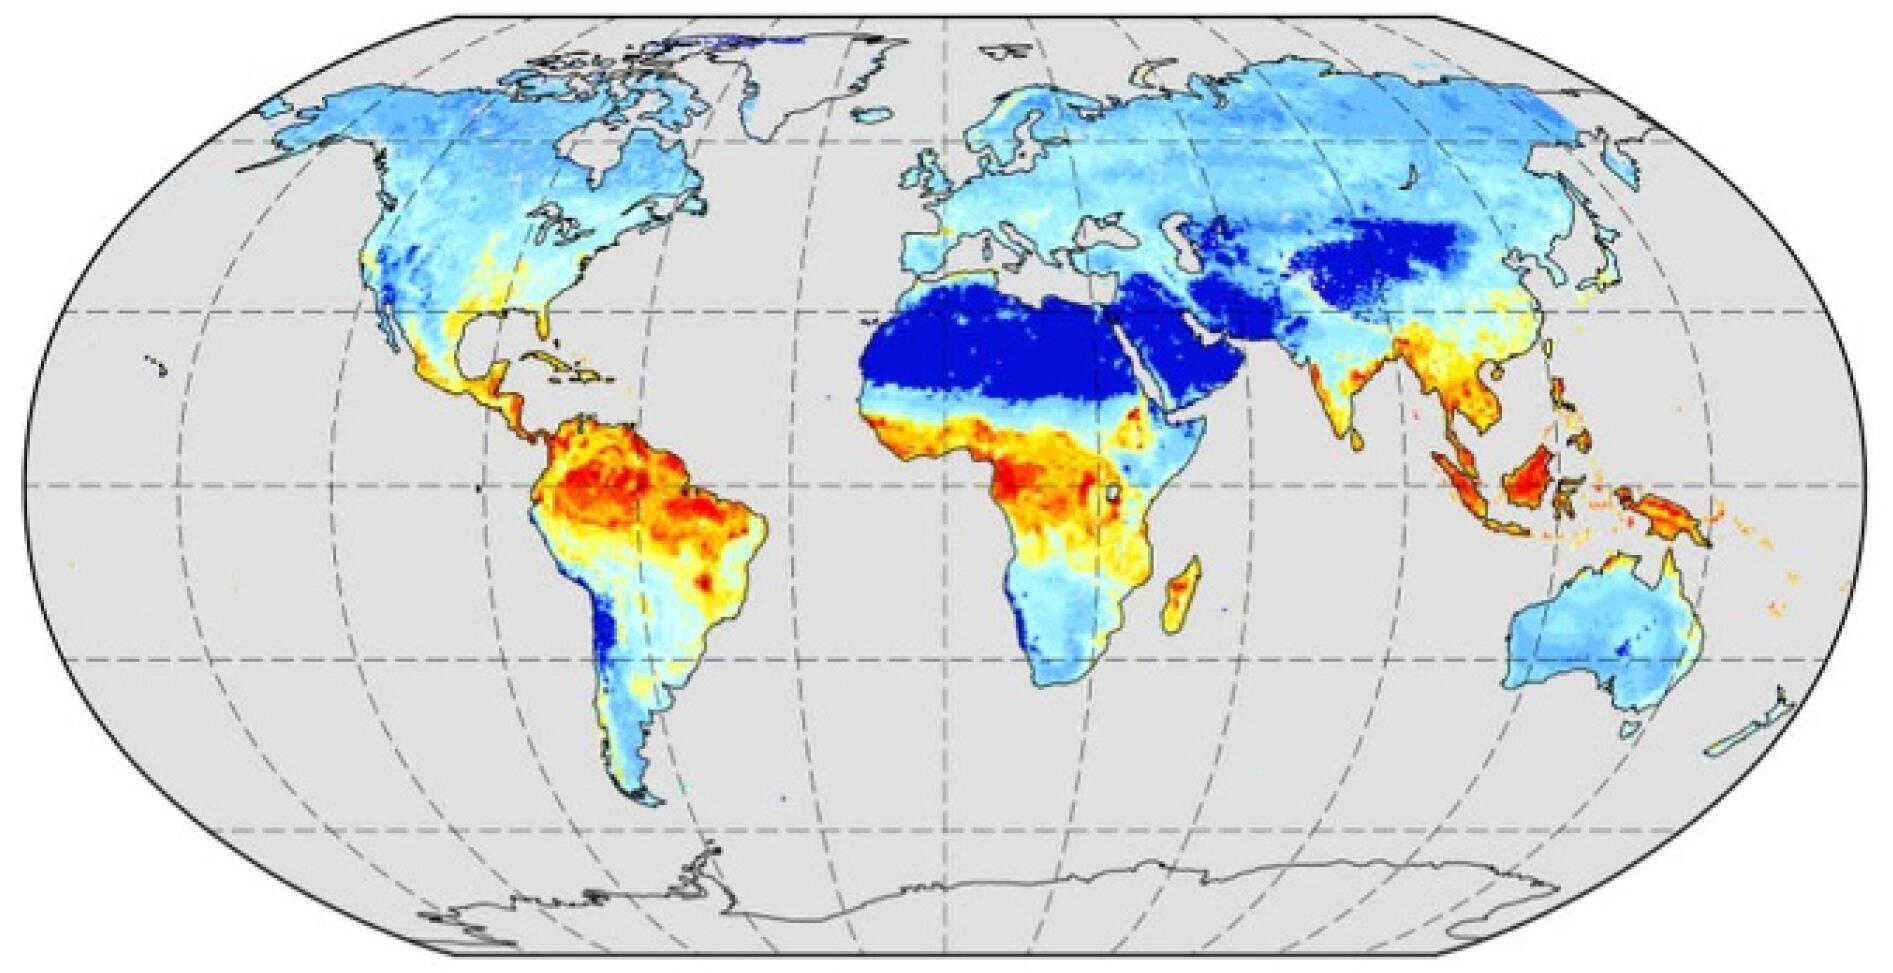
This data set is the global vegetation productivity data, including total primary productivity (GPP), net primary productivity (NPP) and net ecosystem productivity (NEP). It is simulated by BCC-ESM1 model in Phase 6 of the Coupling Model Comparison Plan (CMIP6) under the historical scenario. The data time range is 1850-2014, the time resolution is month, and the spatial resolution is about 2.8125 °. Analog Data Details Visible Link https://www.wdc-climate.de/ui/cmip6?input=CMIP6.CMIP.BCC.BCC -ESM1。
2022-10-24 View Details
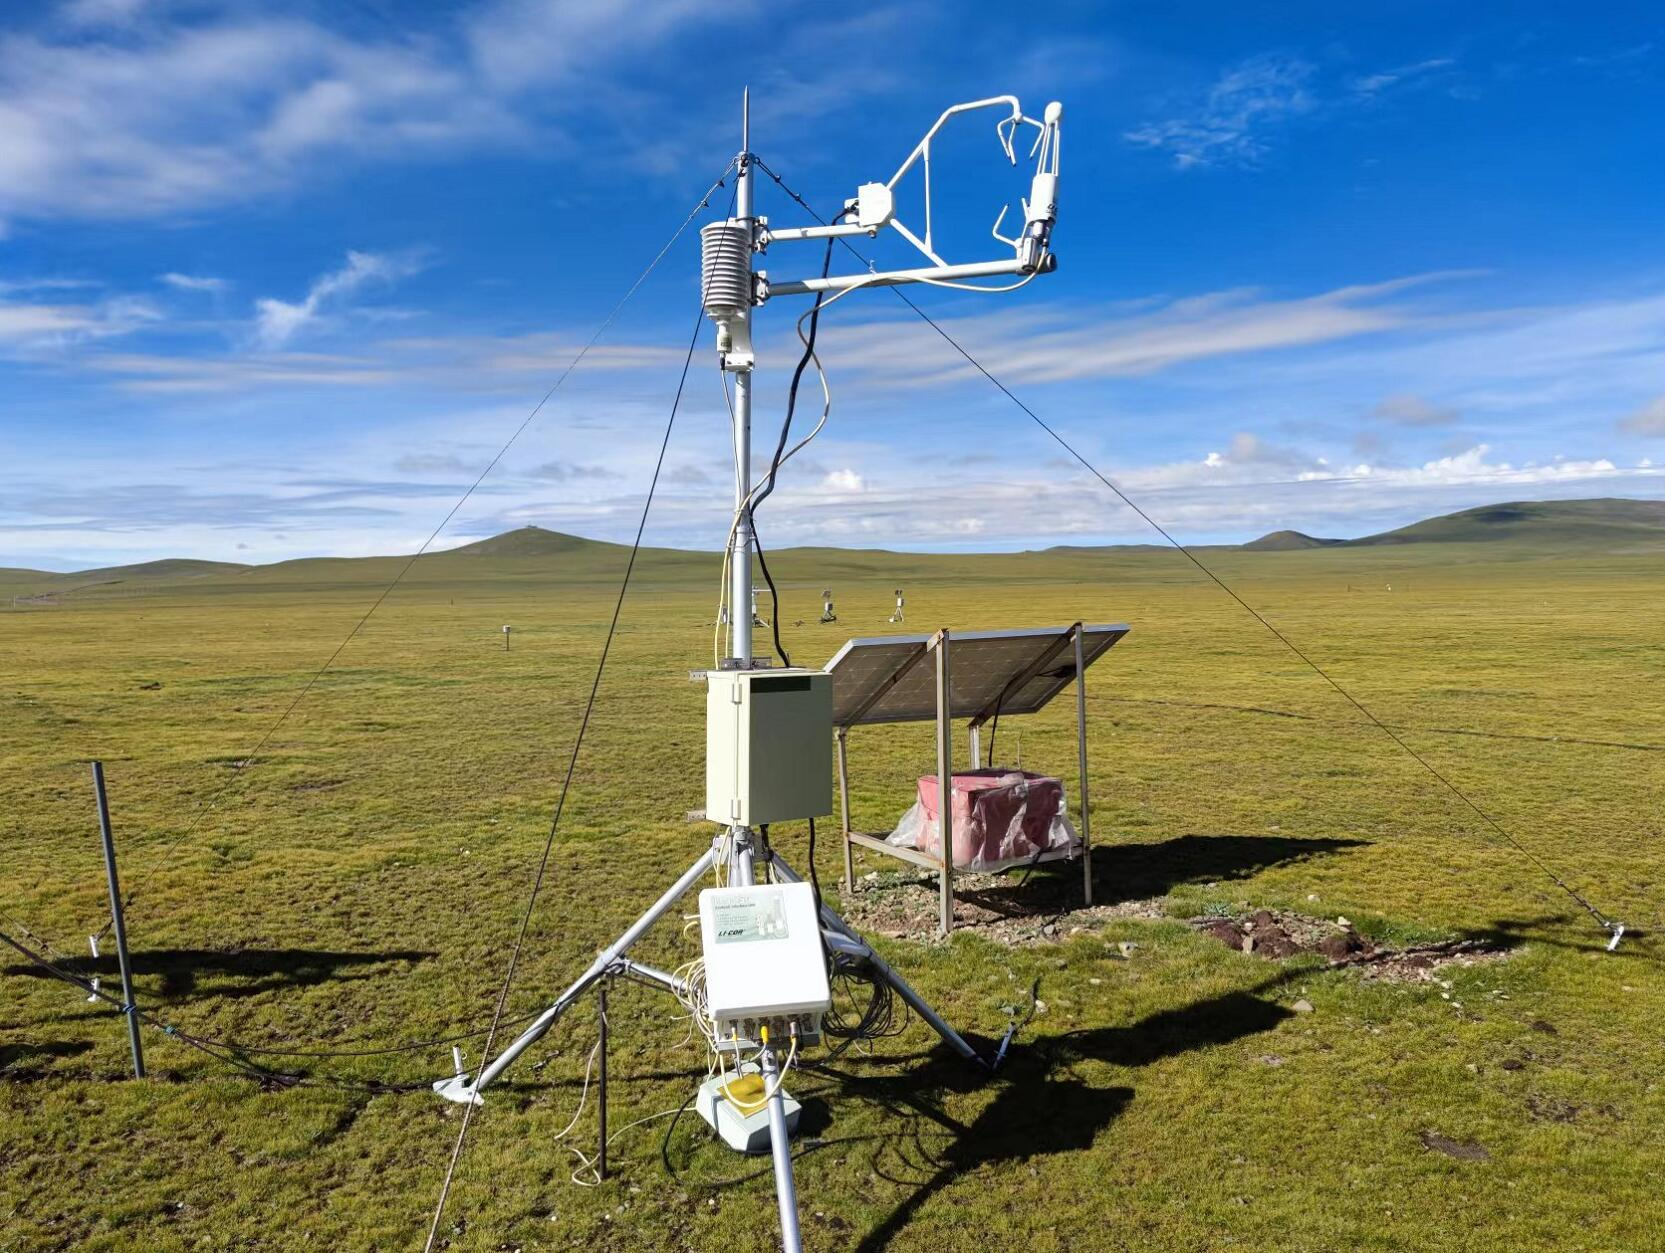
This dataset is the daily vorticity related flux observation data of Naqu flux station (31.64 ° N 92.01 ° E, 4598 m a.s.l.), including net ecosystem productivity (NEP), total primary productivity (GPP), ecosystem respiration (ER), evapotranspiration, latent heat, sensible heat, air temperature, relative humidity, wind speed, soil temperature, soil moisture and other data. The main steps of data pre-processing include wild point removal (± 3 σ)、 Coordinate axis rotation (3D wind rotation), Webb Pearman Leuning correction, outlier elimination, carbon flux interpolation and decomposition, etc. Missing data are interpolated through the nonlinear empirical formula between CO2 flux value (Fc) and environmental factors.
2022-10-21 View Details
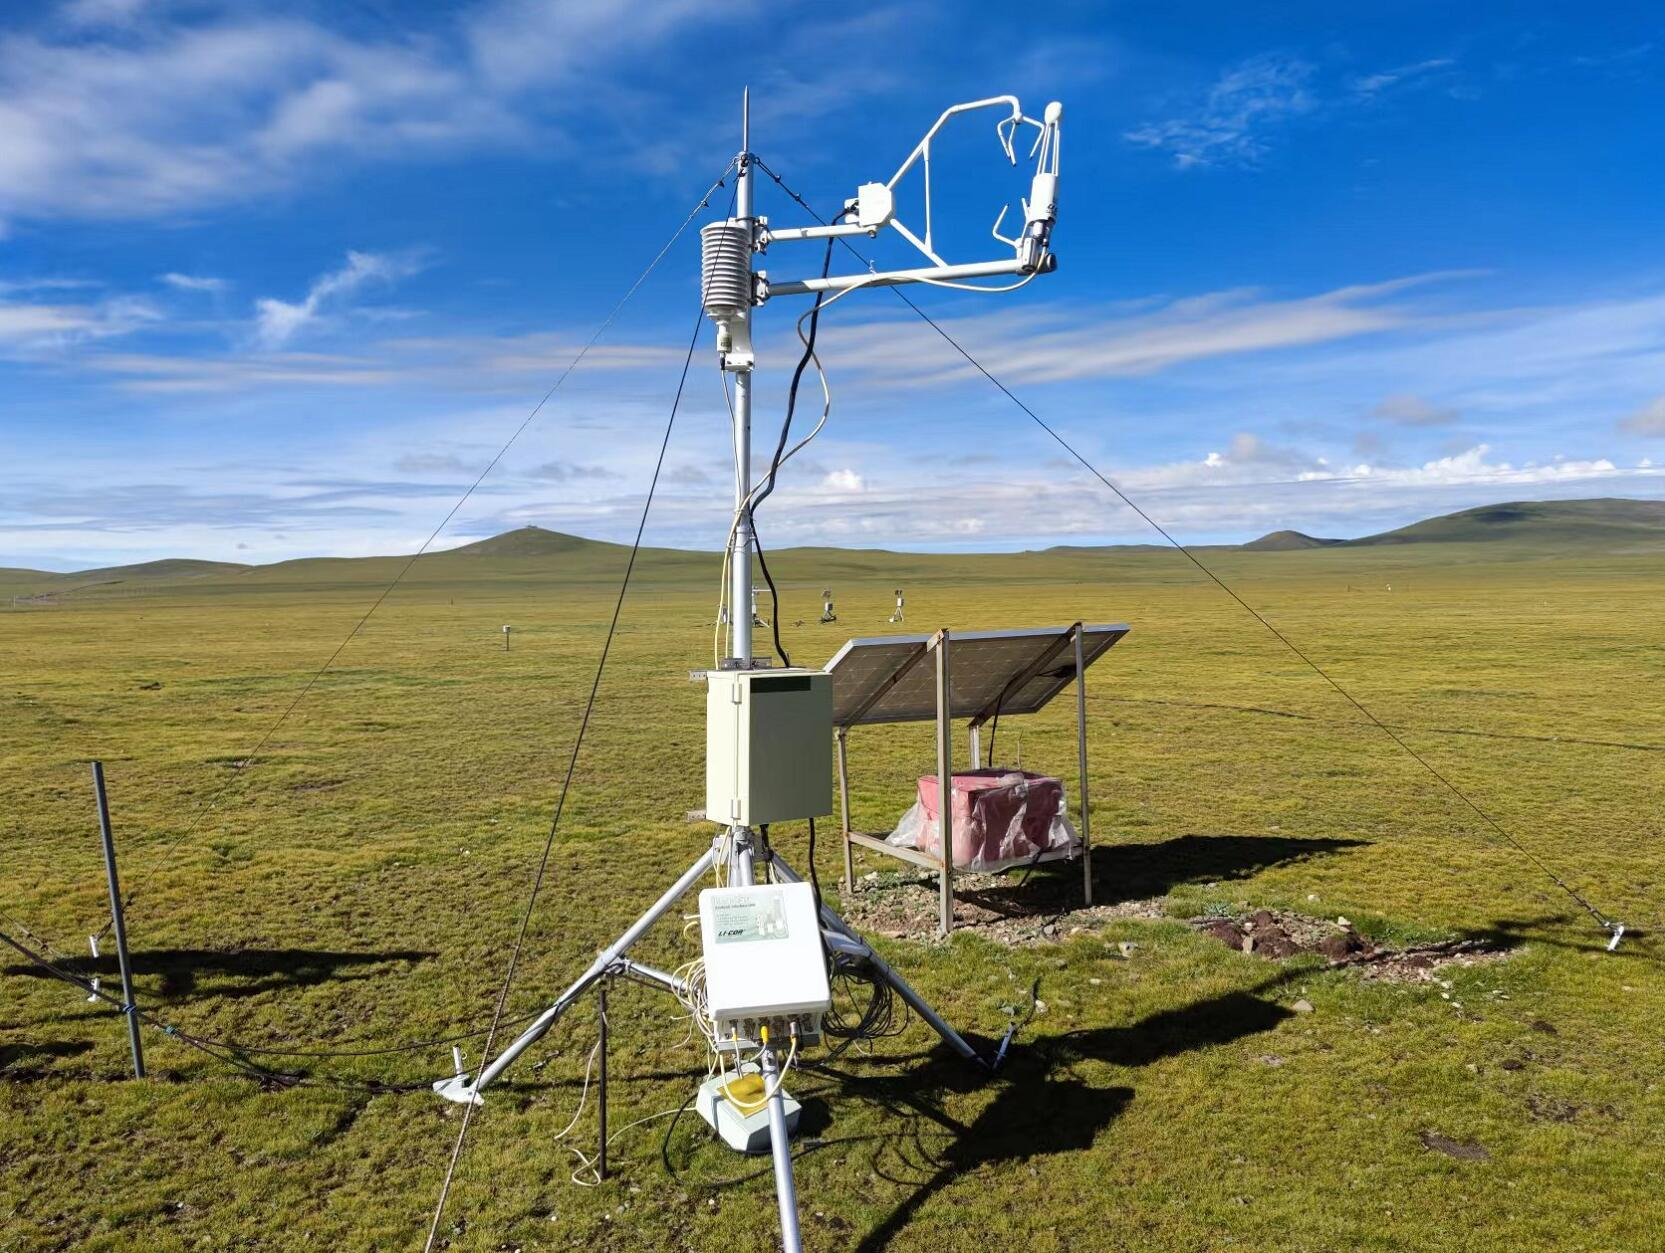
This data set is the daily vorticity related flux observation data of Naqu flux station (31.64 ° N 92.01 ° E, 4598 m a.s.l.), including ecosystem net ecosystem productivity (NEP), total primary productivity (GPP) and ecosystem respiration (ER) data. The main steps of data pre-processing include wild point removal (± 3 σ)、 Coordinate axis rotation (3D wind rotation), Webb Pearman Leuning correction, outlier elimination, carbon flux interpolation and decomposition, etc. Missing data are interpolated through the nonlinear empirical formula between CO2 flux value (Fc) and environmental factors.
2022-10-21 View Details
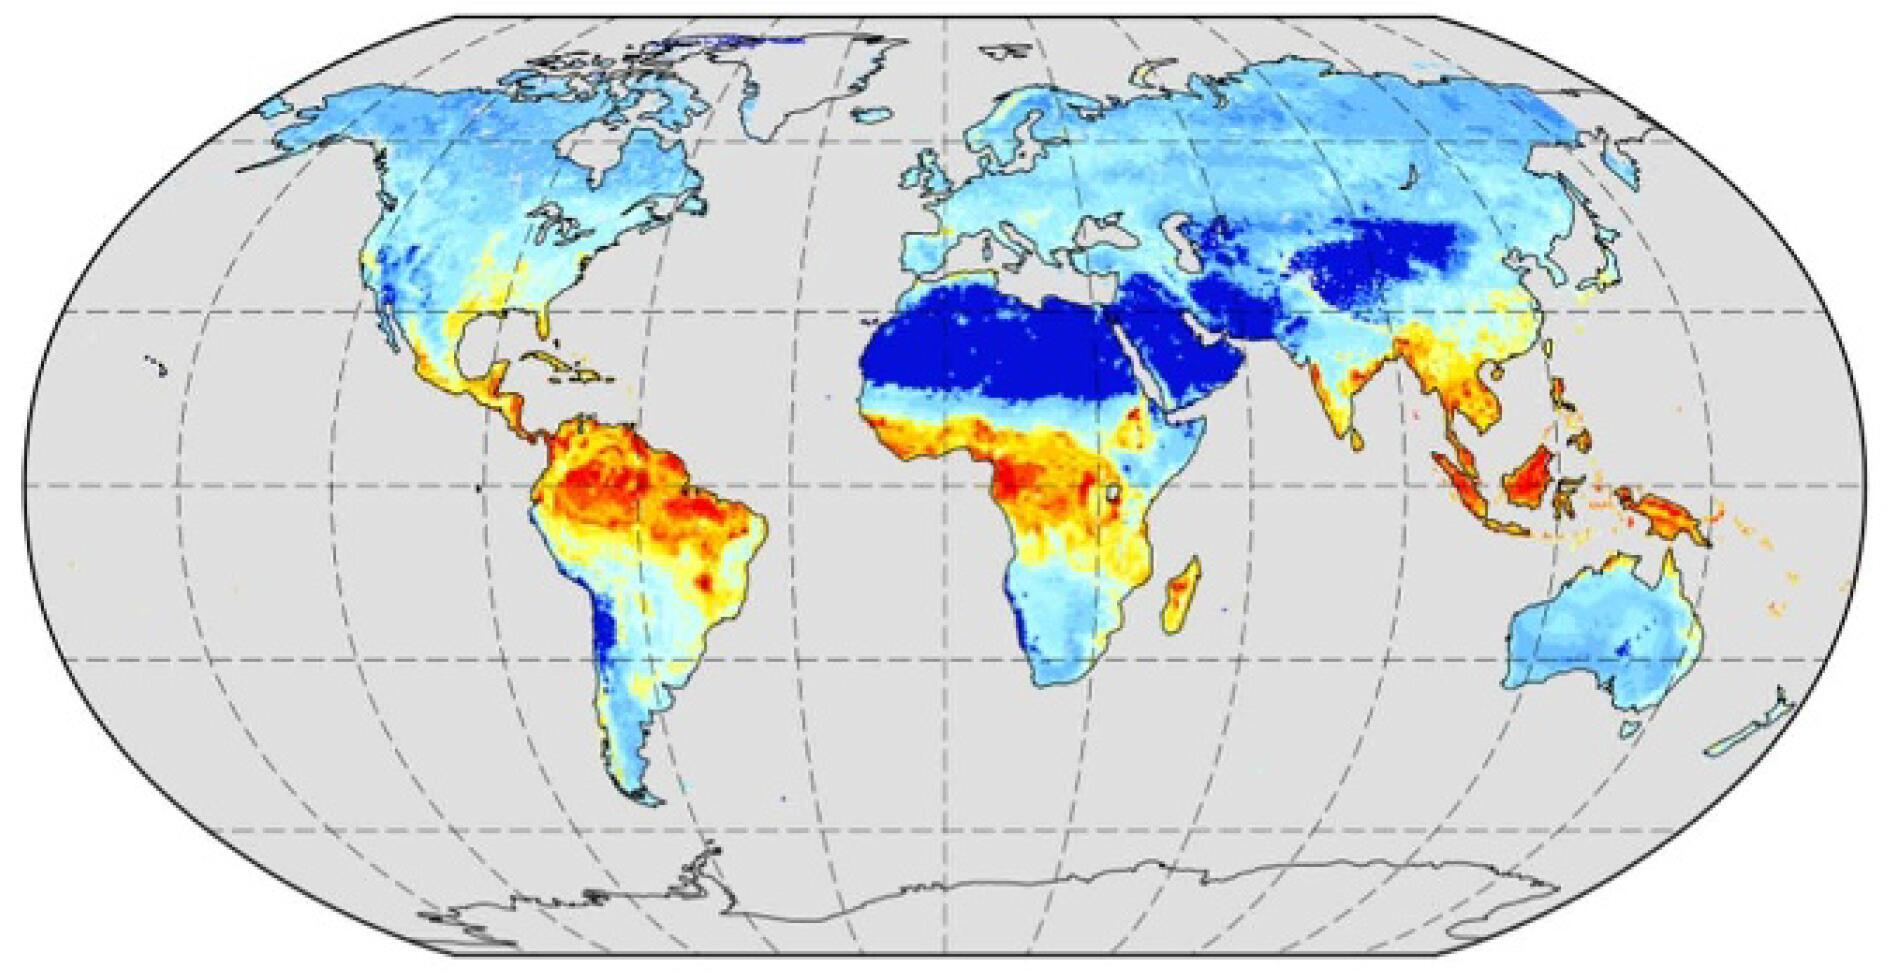
This dataset is global respiration data, including autotrophic respiration (ra) and heterotrophic respiration (rh). It is simulated by TaiESM1 model in Phase 6 of the Coupling Model Comparison Plan (CMIP6) under historical scenarios. The data time range is 1850-2014, the time resolution is month, and the spatial resolution is about 0.9 ° x1.25 °. Analog Data Details Visible Link https://www.wdc-climate.de/ui/cmip6?input=CMIP6.CMIP.AS -RCEC.TaiESM1.historical。
2022-10-20 View Details
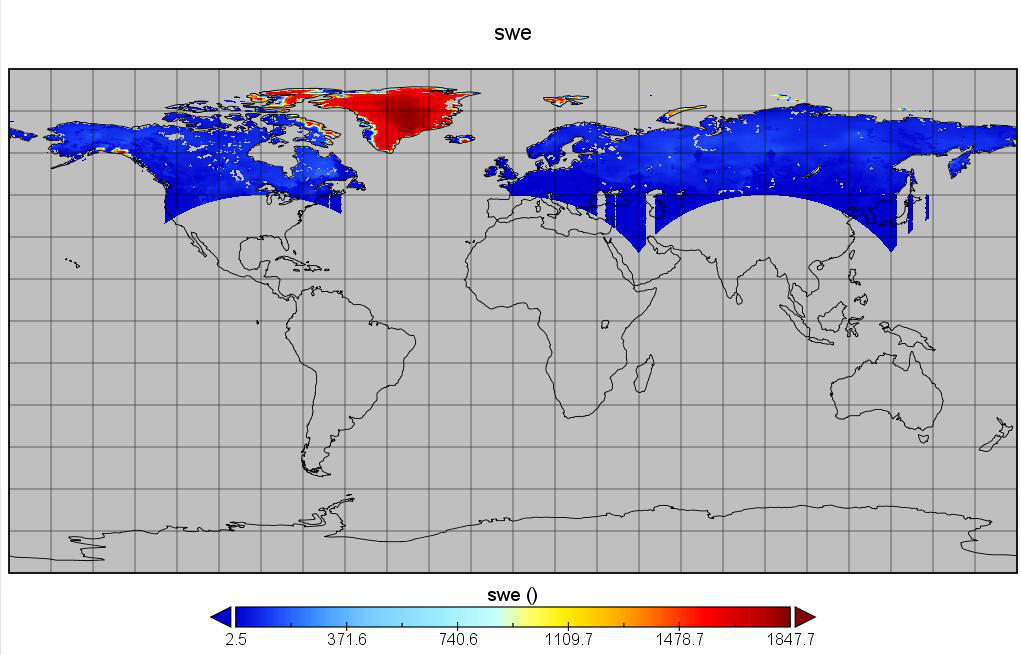
Snow water equivalent (SWE) is an important parameter of the surface hydrological model and climate model. The data is based on the ridge regression algorithm of machine learning, which integrates a variety of existing snow water equivalent data products to form a set of snow water equivalent data products with continuous time series and high accuracy. The spatial range of the data is Pan-Arctic (45 N° to 90 N °), The data time series is 1979-2019. The dataset is expected to provide more accurate snow water equivalent data for the hydrological and climate model, and provide data support for cryosphere change and global change.
2022-04-15 View Details
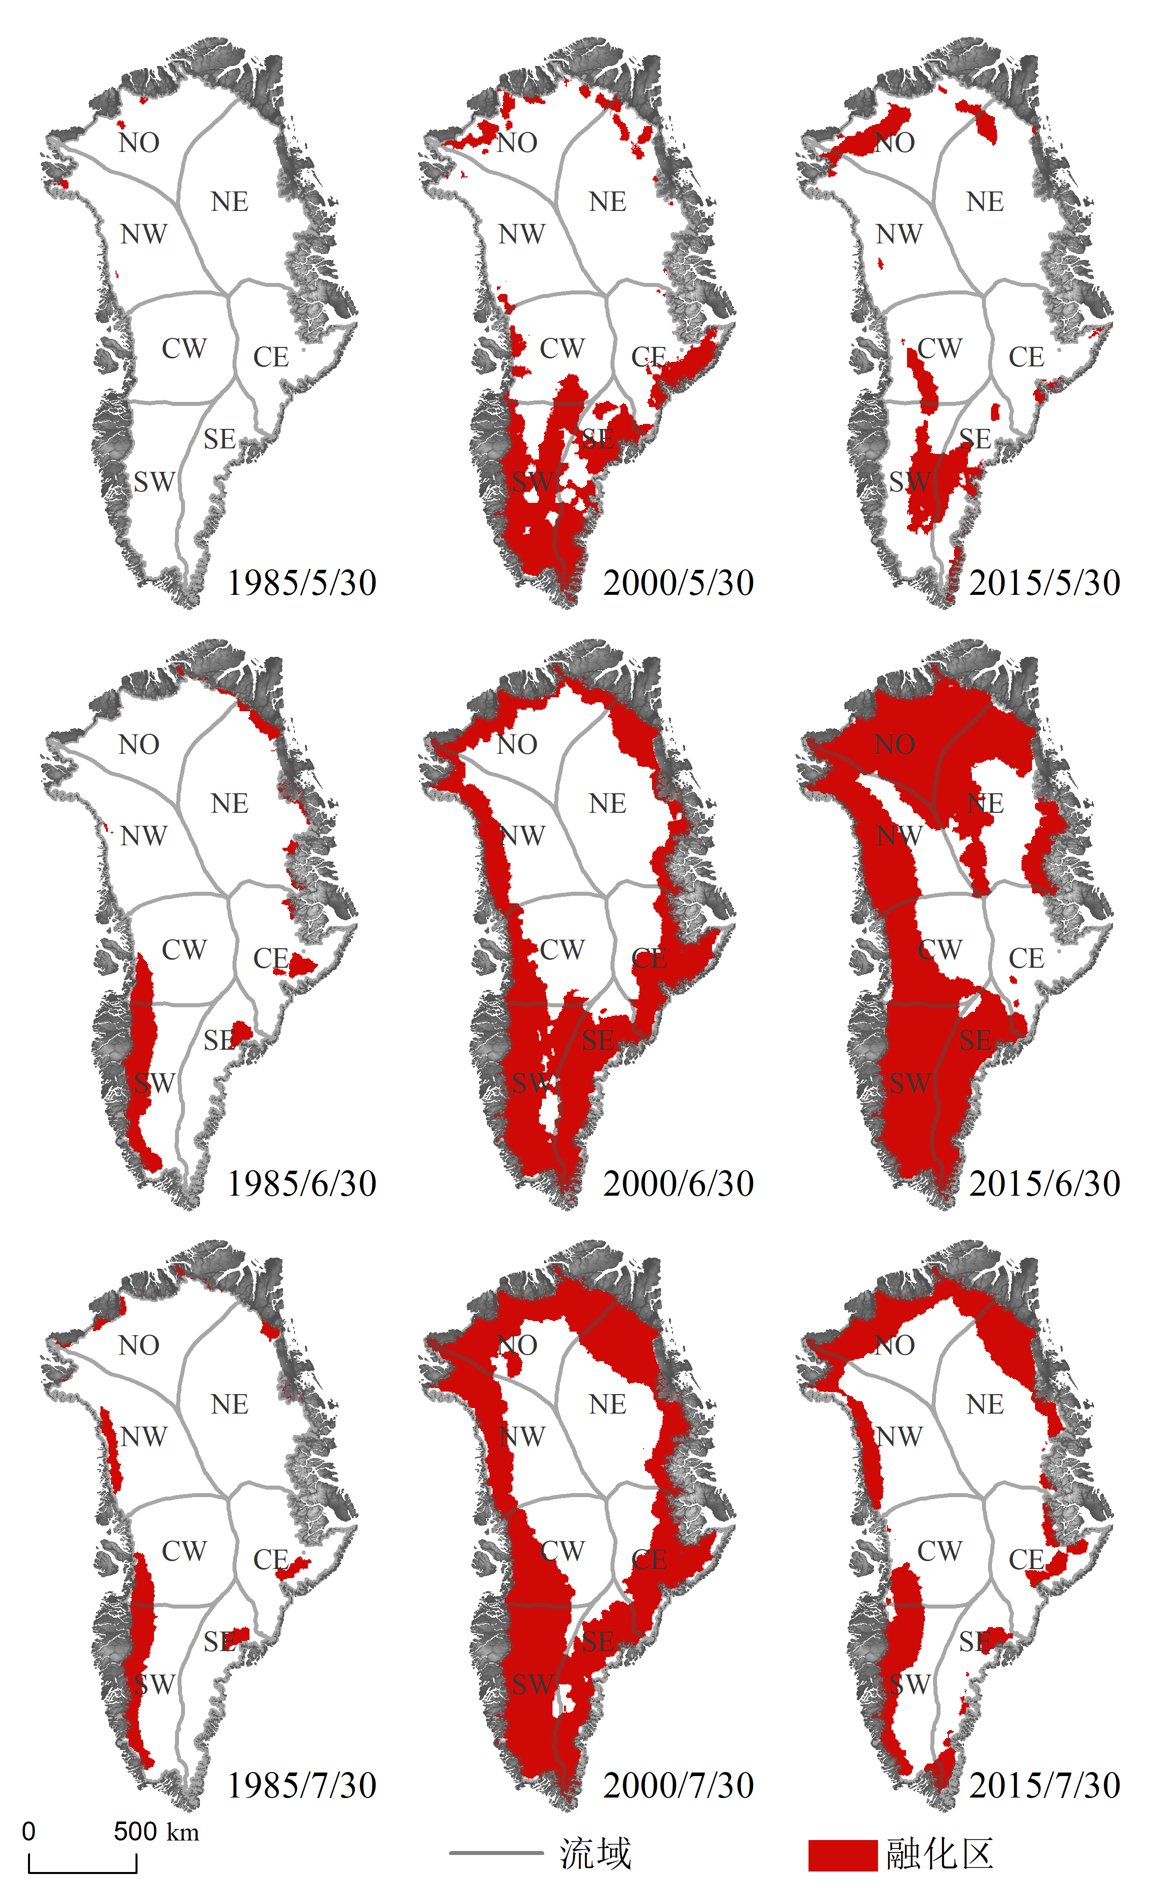
Surface melting is the primary reason that affects the mass balance of Greenland ice sheet. At the same time, ice and snow have high albedo, and ice sheet surface melting will cause the difference of radiation energy budget, and then affects the energy exchange between sea-land-air. The high-resolution ice sheet surface melting product provides important information support for the study of Greenland ice sheet surface melting and its response to global climate change. This dataset combined microwave radiometer product and optical albedo product, the daily, winter (June-August) averages and July averages of the former are used for layer-stacking, then Gram-Schmidt Spectral Sharpening was adapted to fuse the layer-stacking results with MODIS GLASS albedo product. The spatial resolution of fusion-results has been downscaled from 25 km to 0.05˚. By employing a threshold-based melt detection approach for each fusion-results pixel, Greenland ice sheet surface melt daily product for 1985, 2000, 2015 (DSSMIS) was generated. The spatial resolution of DSSMIS is higher than that of published data sets at home and abroad. Combined with the advantages of radiometer and albedo data, the spatial details characteristics are enhanced and consistent with the extraction range of the original radiometer products, effectively reducing the noise of the radiometer. DSSMIS’s data type is integer, where 1 is melted, 0 is not melted, 255 is masked area besides Greenland ice sheet, and the data set is stored as *.nc.
2022-04-15 View Details
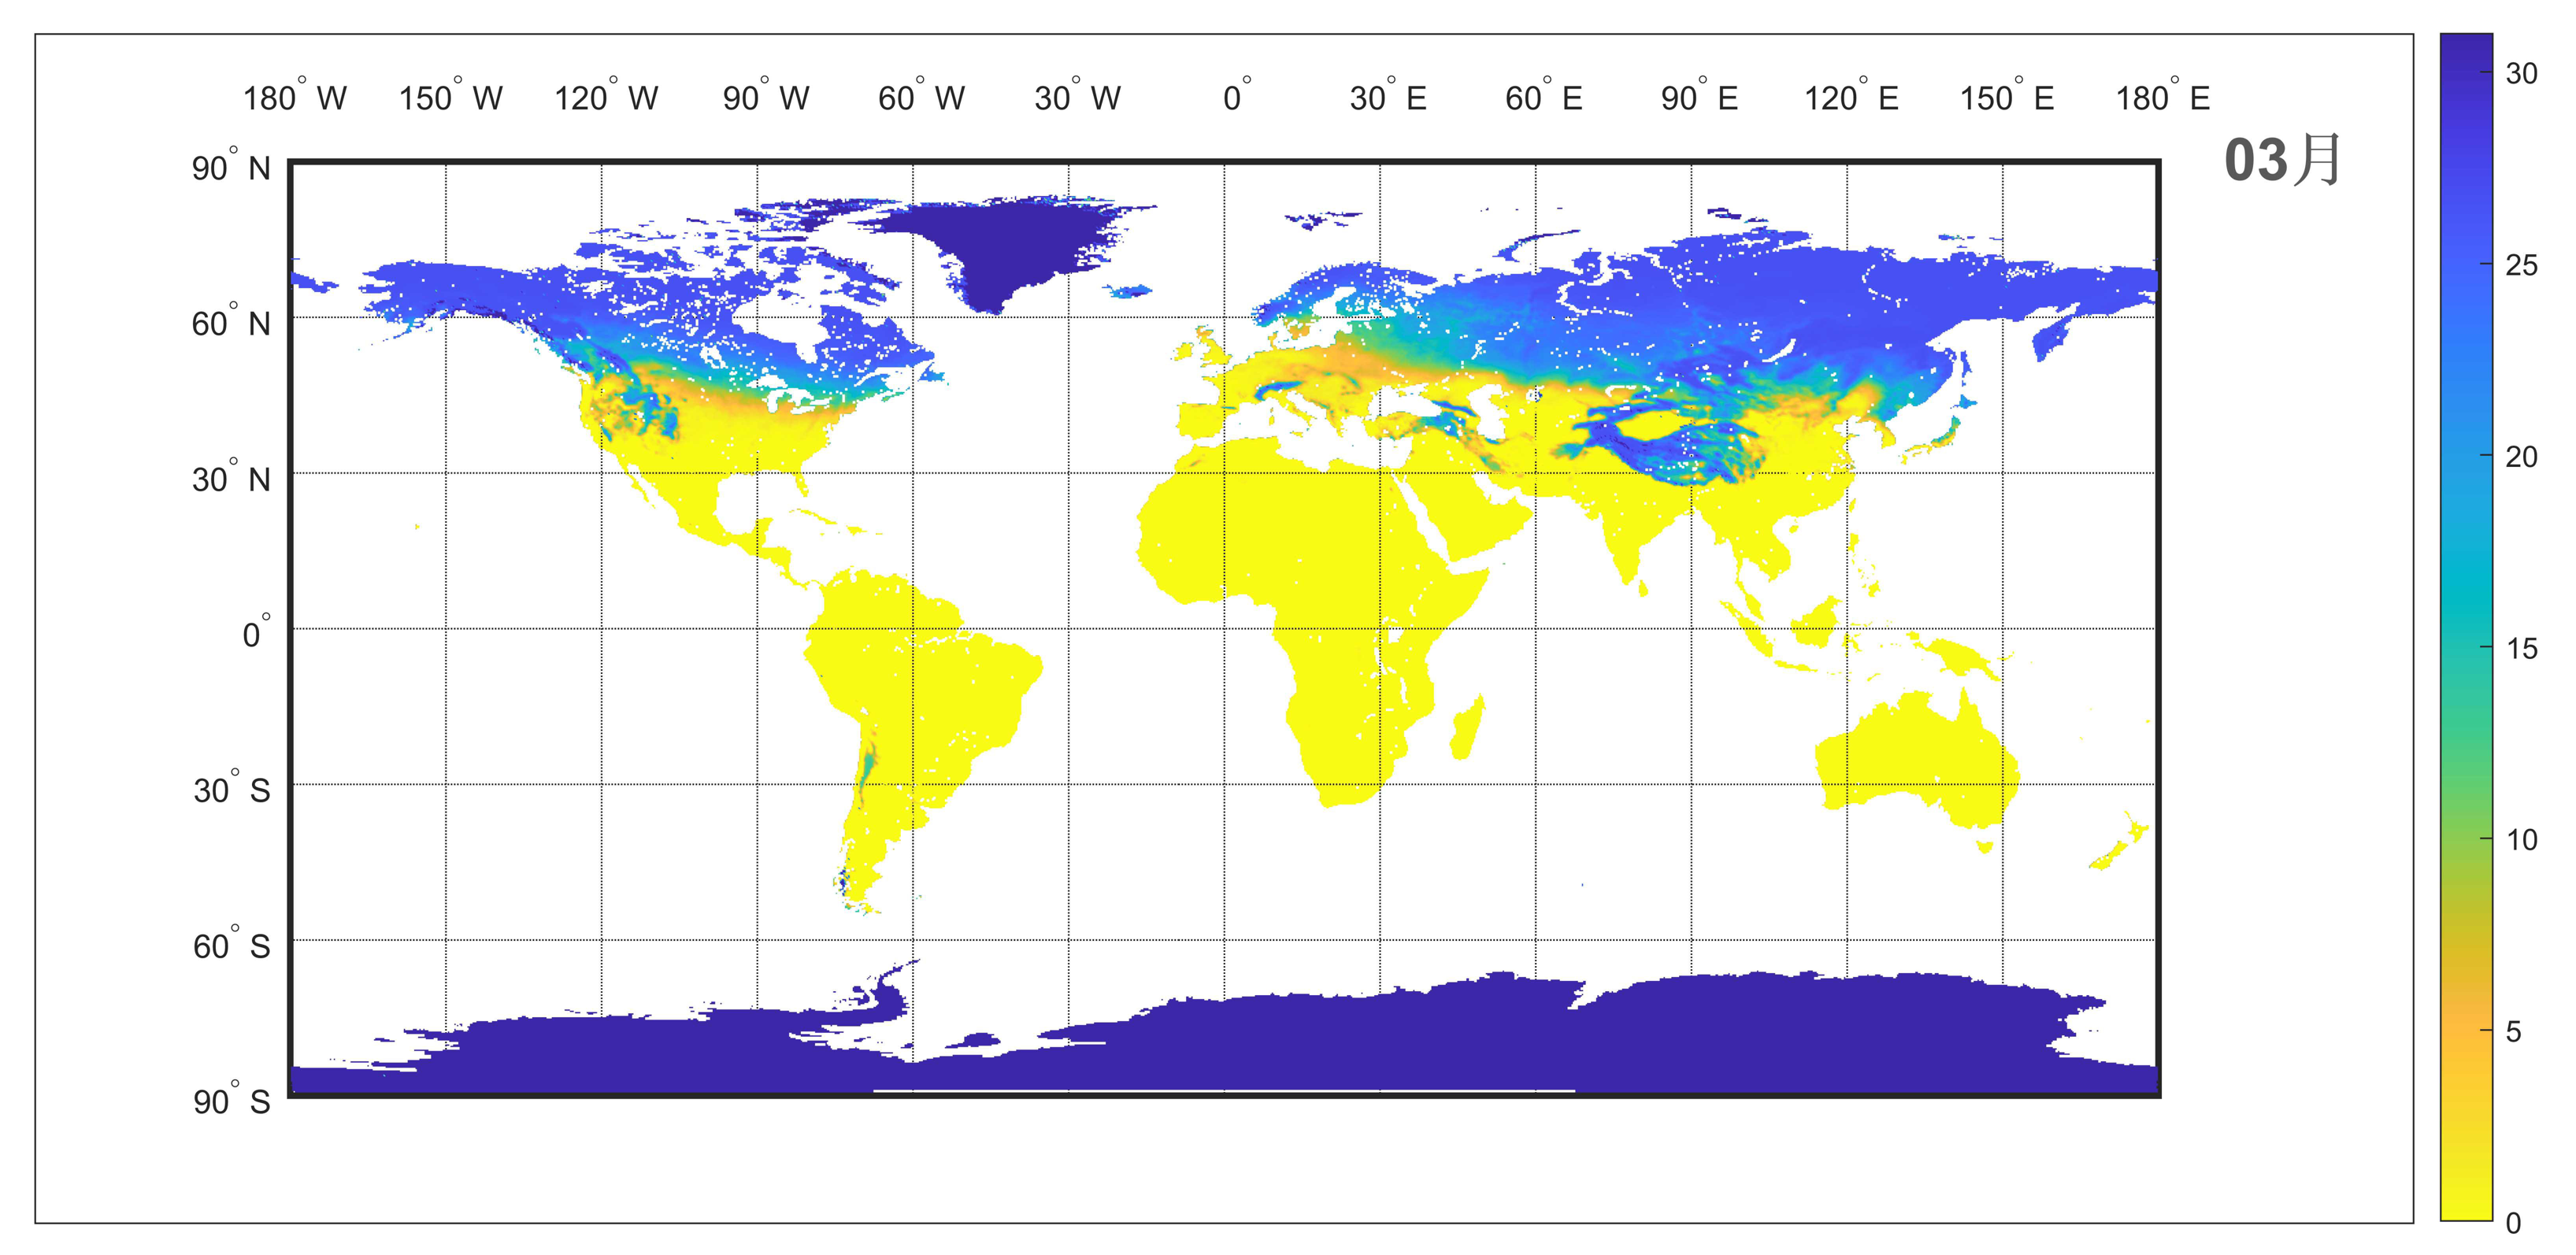
The freeze/thaw status of the near-surface soil is the water-ice phase transition that occurred at the top soil layer. It is an important indicator as a giant on-off “switch” of the land surface processes including water, energy, and carbon exchanges between the land surface and atmosphere. The freeze/thaw status is an essential variable for understanding how the ecosystem responds to and affects global changes. This dataset is based on the AMSR-E and AMSR2 passive microwave brightness temperature data, and the freeze-thaw discriminant function algorithm is used to generate the global near-surface soil freeze-thaw status with a spatial resolution of grids at 0.25° from 2002 to 2019. The dataset can be used for the analysis of the spatial distribution and trend changes of global freeze-thaw cycles, such as the freeze/thaw onset dates and duration. It provides data support for understanding the interaction mechanism between the land surface freeze-thaw cycle and the land-atmosphere exchanges under the context of global changes.
2022-03-30 View Details
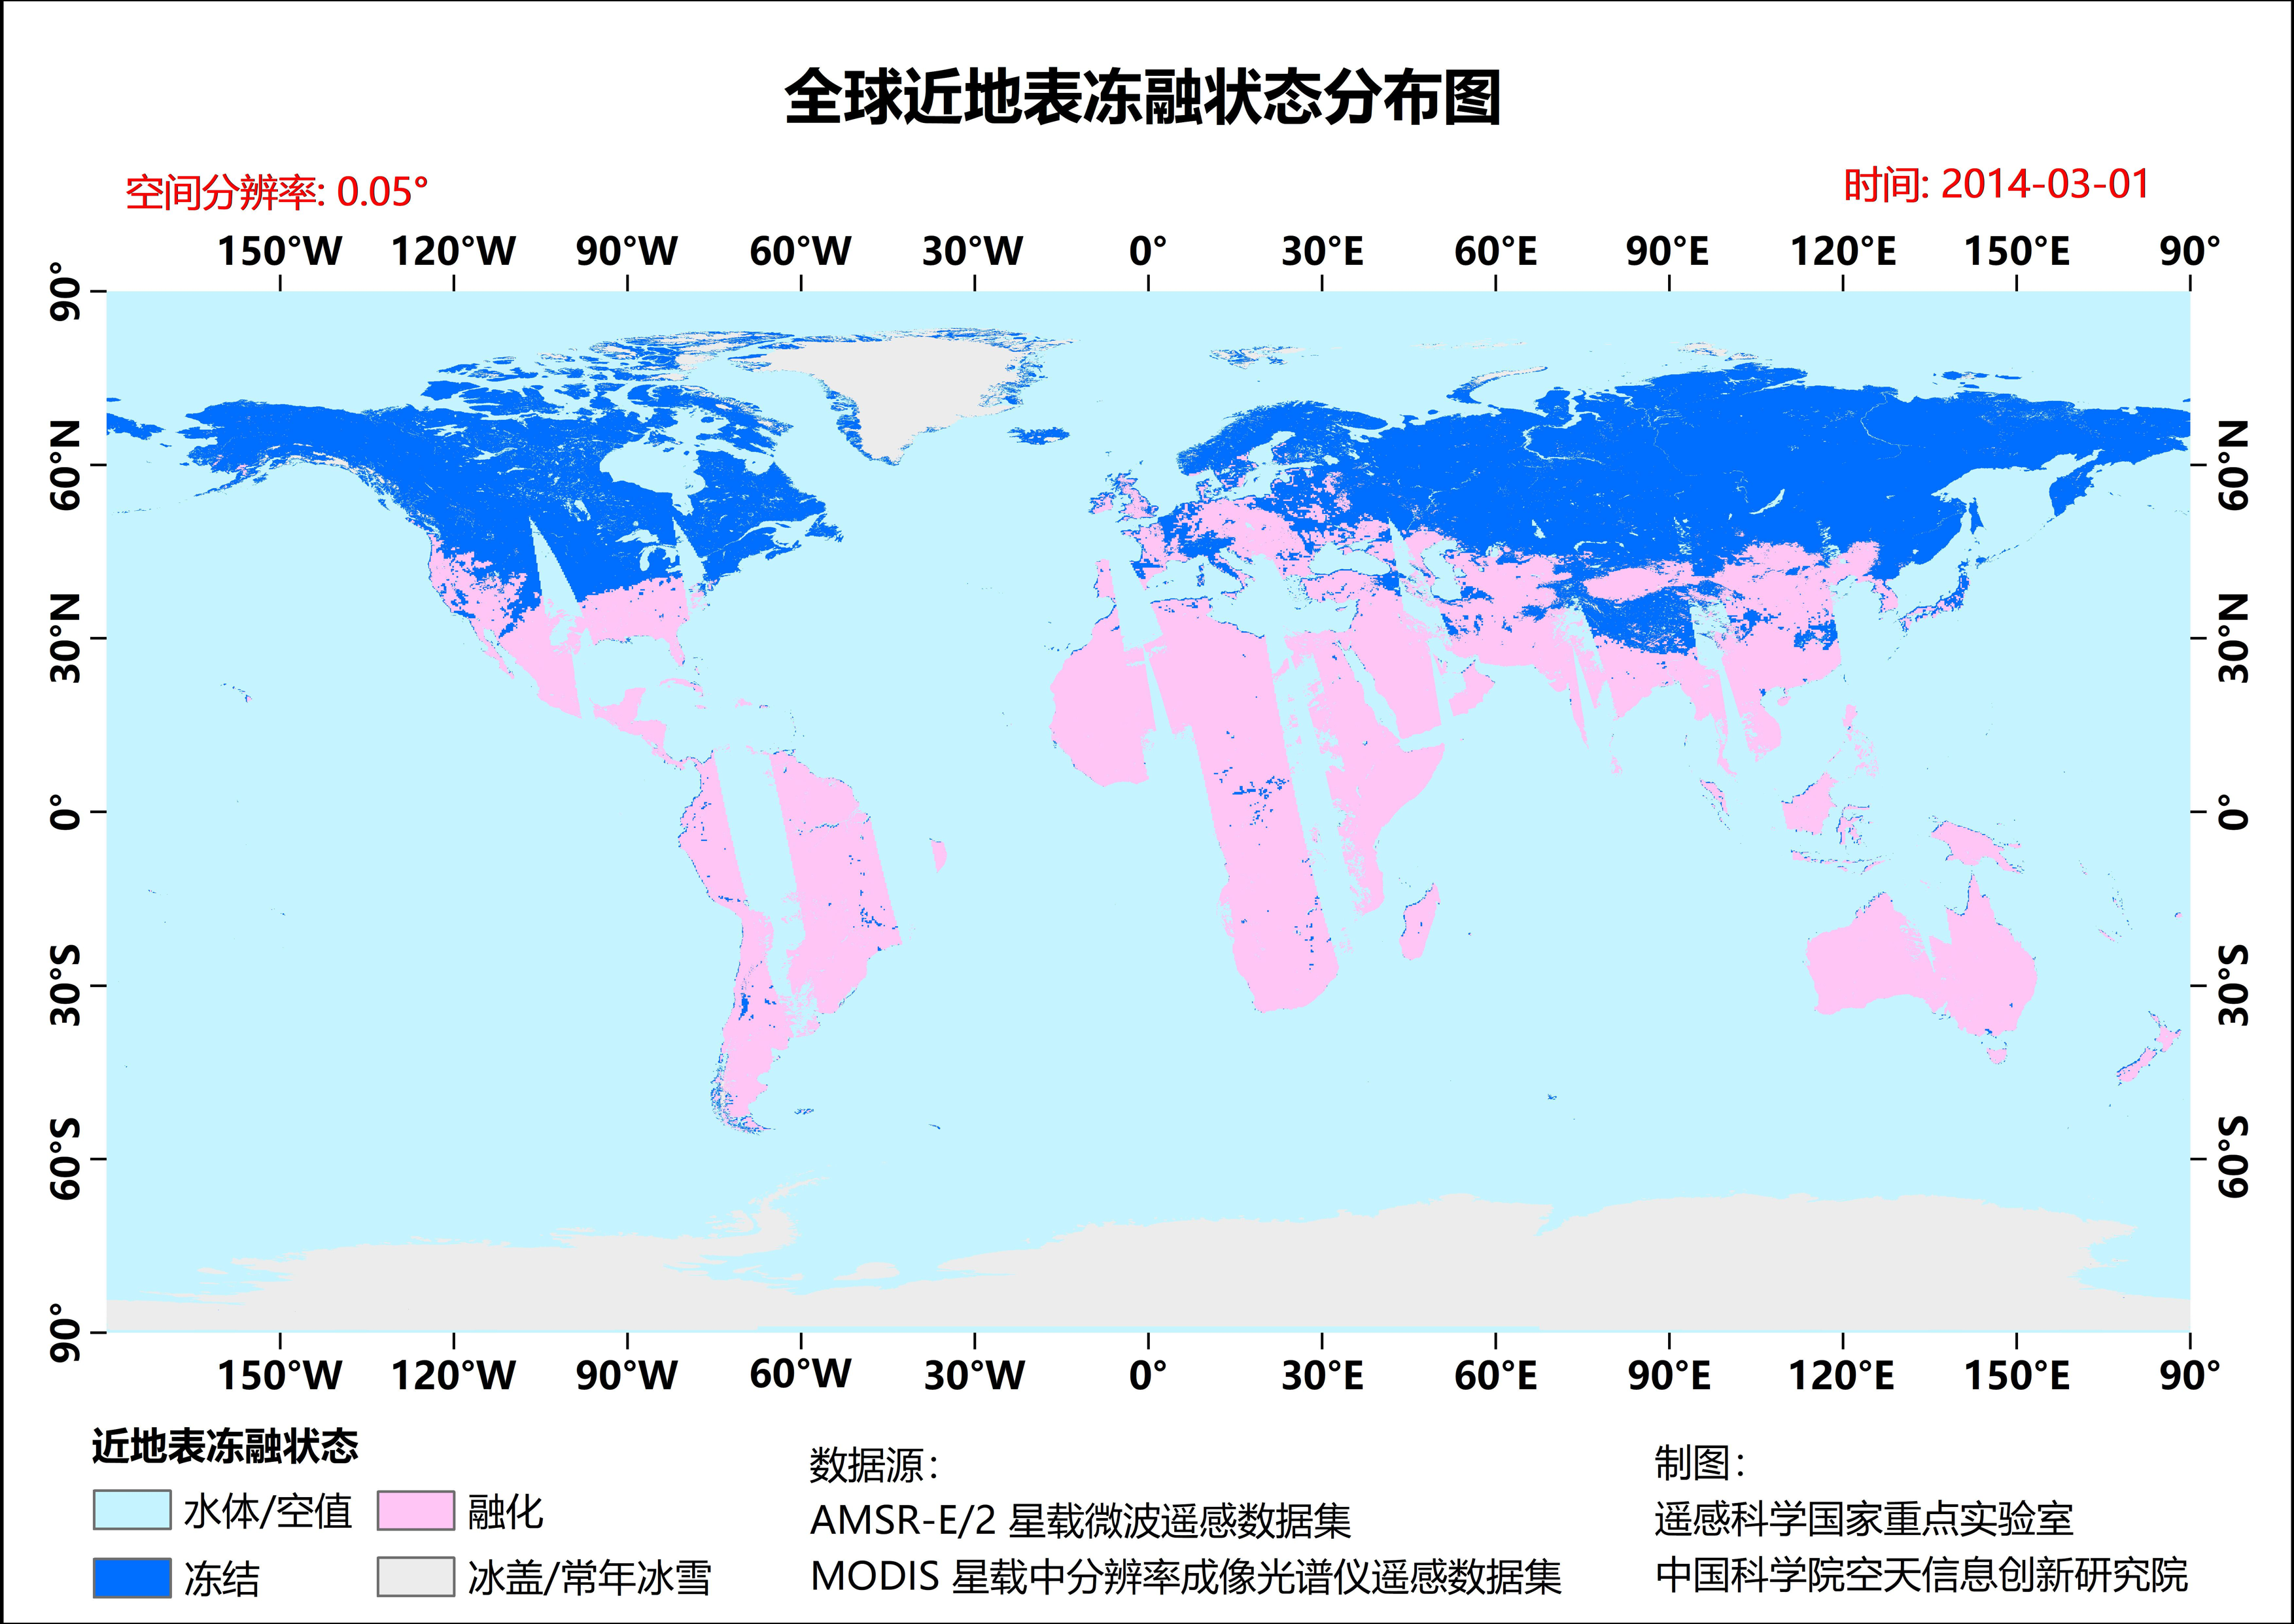
The freeze/thaw status of the near-surface soil is the water-ice phase transition that occurred at the top soil layer. It is an important indicator as a giant on-off “switch” of the land surface processes including water, energy, and carbon exchanges between the land surface and atmosphere. The freeze/thaw status is an essential variable for understanding how the ecosystem responds to and affects global changes. This dataset is based on the AMSR-E, AMSR2 passive microwave brightness temperature data and MODIS optical remote sensing data. The freeze-thaw discriminant function algorithm and downscaling algorithm are used to generate the global near-surface soil freeze-thaw status with a spatial resolution of grids at 0.05° from 2002 to 2017. The dataset can be used for the analysis of the spatial distribution and trend changes of global freeze-thaw cycles, such as the freeze/thaw onset dates and duration. It provides data support for understanding the interaction mechanism between the land surface freeze-thaw cycle and the land-atmosphere exchanges under the context of global changes.
2022-03-28 View Details
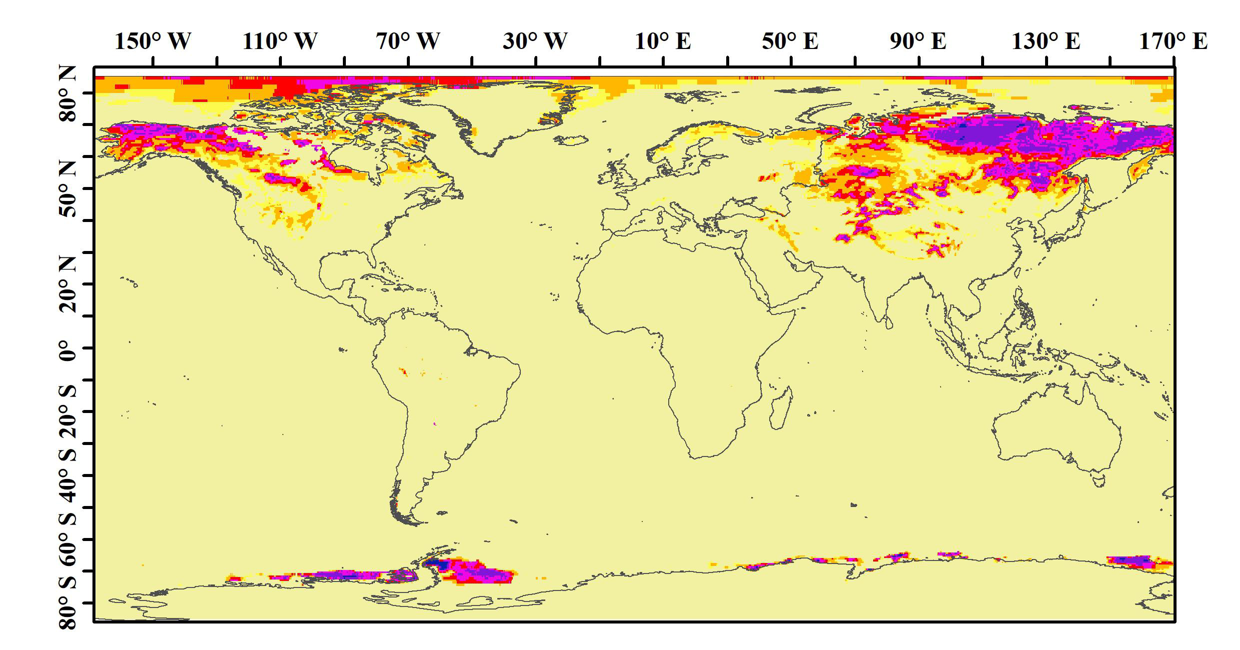
The “Long-term series of daily global snow depth” was produced using the passive microwave remote sensing data. The temporal range is 1980~2018, and the coverage is the global land. The spatial resolutions is 25,067.53 m and the temporal resolution is daily. A dynamic brightness temperature gradient algorithm was used to derive snow depth. In this algorithm, the spatial and temporal variations of snow characteristics were considered and the spatial and seasonal dynamic relationships between the temperature difference between 18 GHz and 36 GHz and the measured snow depth were established. The long-term sequence of satellite-borne passive microwave brightness temperature data used to derive snow depth came from three sensors (SMMR, SSM/I and SSMI/S), and there is a certain system inconsistency among them. So, the inter-sensor calibration was performed to improve the temporal consistency of these brightness temperature data before snow depth derivation. The accuracy analysis shows that the relative deviation of Eurasia snow depth data is within 30%. The data are stored as a txt file every day, each file is a 1383*586 snow depth matrix, and each snow depth represents a 25,067.53m* 25,067.53m grid. The projection of this data is EASE-Grid, and following is the file header which describes the projection detail. File header: ncols 1383 nrows 586 xllcorner -17334193.54 yllcorner -7344787.75 cellsize 25,067.53 NODATA_value -1
2021-08-14 View Details
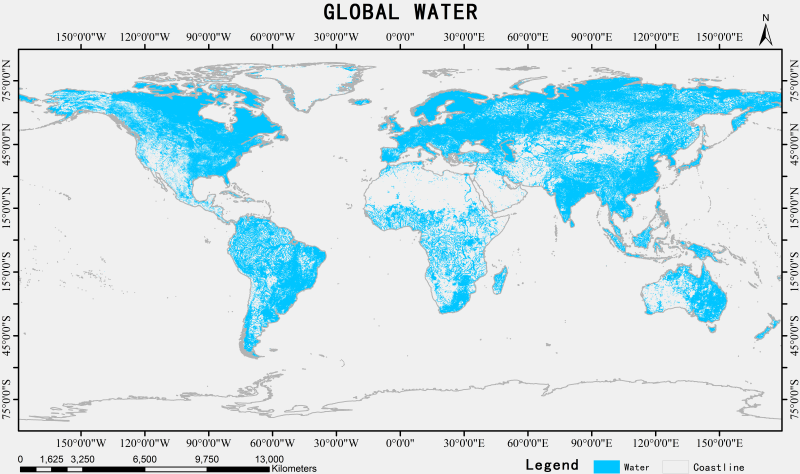
River and lake resources are important components for studying the Earth ecological environment, affecting global ecosystems, heat, material exchange and balance and serving as an important basis for studying changes in the global environmental mechanism. At present, the lack of global lake vector data with large-scale, high-precision, and large-range has hindered hydrological research on rivers and lakes. Taking the data collection of global rivers and lakes of Jun Chen as the source data and combining the domestic high-resolution image GF data of 2 to 3 years before and after 2010, a data set of global rivers and lakes was generated. This data set makes up for the shortcomings of low precision in some areas and is an editable lake and river vector data set with high accuracy.
2020-12-22 View Details
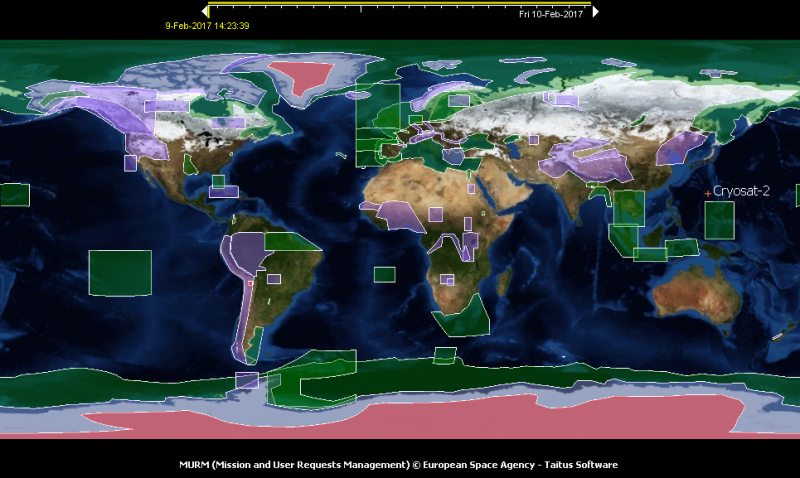
The global Cryosat-2 GDR dataset is generated by the European Space Agency (ESA); it has a temporal coverage from 2010 to 2016 and covers the globe. On April 8, 2010, the ESA launched the Cryosat-2 high-tilt polar orbit satellite. The satellite is equipped with an SAR Interferometer Radar Altimeter (SIRAL), which is mainly used to monitor polar ice thickness and sea ice thickness changes, and, furthermore, to study the effects of melting polar ice on global sea level rise and that of global climate change on Antarctic ice thickness. The altimeter operates in the Ku-band and at a frequency of 13.575 GHz, it includes three measurement modes. One is a low-resolution altimeter measurement mode (LRM) that points to the subsatellite point to obtain all surface observations for land, sea, and ice sheets; its processing is similar to ENVISAT/RA-2, with an orbital resolution of 5 to 7 km. The second is the Synthetic Aperture Radar (SAR) measurement mode, which is mainly used to improve the accuracy and resolution of sea ice observations; it can make the resolution along the orbit reach approximately 250 m. The third is the Interferometric Synthetic Aperture Radar (InSAR), which is mainly used to improve the accuracy of areas with complex terrain such as the edges of ice sheets or ice shelves. The CryoSat -2/SIRAL data products mainly include 0-level data, 1b-level data, 2-level data and high-level data. The Cryosat-2/SIRAL products consist of two files: an XML head file (.HDR) and a data product file (.DBL). The HDR file is an auxiliary ASCII file for fast identification and retrieval of the data files. 1b-level products are stored separately according to the measurement modes, and the data recording formats of different modes are also different. Each waveform in LRM mode and SAR mode has 128 sampling points, while that in SARIn mode has 512 sampling points. 2-level GDR products are available for most scientific applications, including measurement time, geographic location, altitude, and more. In addition, the altitude information in GDR products has been obtained through instrumental calibration, transmission delay corrections, geometric corrections, and geophysical corrections (such as atmospheric corrections and tidal corrections). The GDR products are single global full-track data, that is, the measurement results of the three modes. After different processing, they are combined in chronological order; thereby, the data recording formats are unified. The data in the three modes use different waveform retracking algorithms to obtain altitude values. In the latest updated Baseline C data, the LRM mode data use three algorithms: Refined CFI, UCL and Refined OCOG.
2020-12-17 View Details
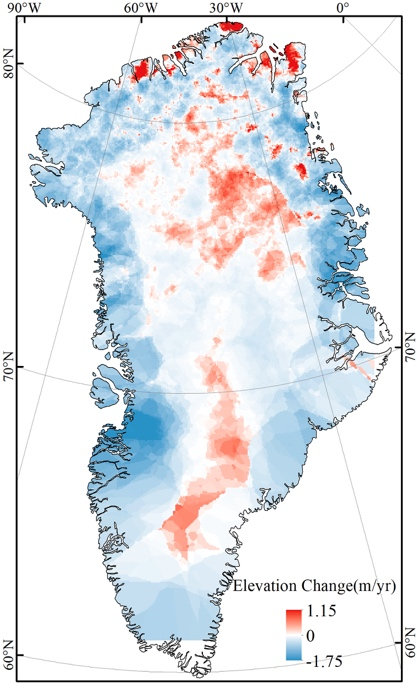
First of all, the data of ice cover elevation change is obtained by using the data of glas12 in 2004 and 2008. In ideal case, each track is strictly repeated. However, due to the track deviation, it can not be guaranteed that the track is strictly repeated according to the design. The deviation varies from several meters to several hundred meters. The grid of 500m * 500m is taken, and the point falling in the same grid is considered as the weight of the repeated track. The elevation change in 2004-2008 is obtained by subtraction of complex points, and the annual elevation change is obtained. Ice sheet elevation change data
2020-10-14 View Details
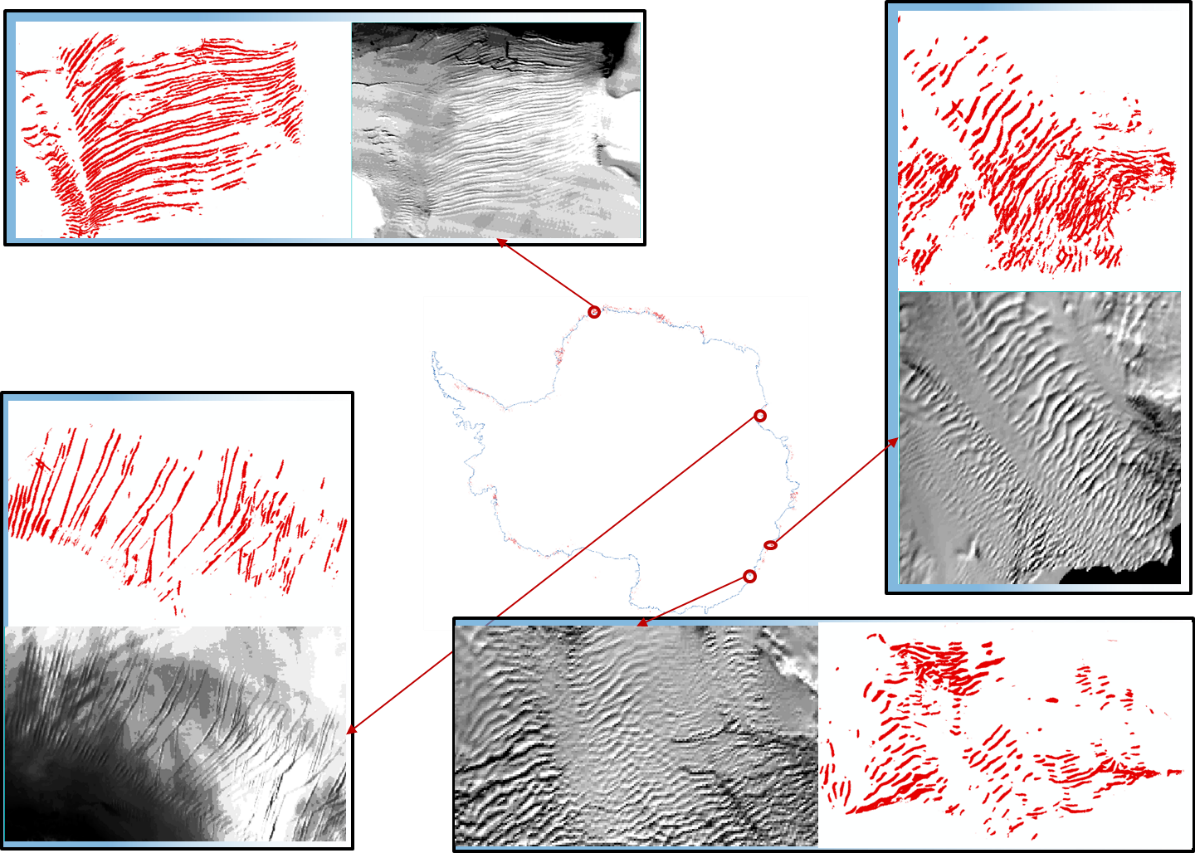
Based on the sentinel-1 hyperspectral wide-band SAR data, using the proposed u-net ice fissure detection method, the ice fissure elevation data of the north and south polar ice sheet are formed. Firstly, the data preprocessing of sentinel-1 hyperspectral wide-band SAR includes radiometric calibration, ice cover range determination and speckle noise removal. In order to suppress the speckle noise of SAR data, and to ensure the ice fracture characteristics, we use ppb method to remove multiplicative noise. This method can not only effectively remove spots, but also retain the characteristics of ice cracks. Secondly, we use the u-net based ice crack detection algorithm to extract ice cracks. In order to obtain the correct ice fracture SAR data samples, we select the SAR samples by comparing the high-resolution optical data of ice fracture to form the ice fracture SAR data samples. Based on the SAR data of ice fracture area and non ice fracture area, we use u-net method to extract ice fracture. Finally, we geocode the detected ice fracture data to form the ice fracture products of the north and south polar.
2020-10-14 View Details
The total solar radiation and the total radiation of absorption and scattering material attenuation are measured by the international general solar radiation meter (li200sz, li-cor, Inc., USA). The measured data are total solar radiation, including direct and diffuse solar radiation, with a wavelength range of 400-1100nm. The unit of measurement is w / m2, and the typical error is ± 3% (incidence angle is within 60 °) under natural lighting. The data of sodankyl ä station in the Arctic comes from cooperation with the site and website download. The coverage time of sodankyl ä station in the Arctic is updated to 2018.
2020-10-14 View Details
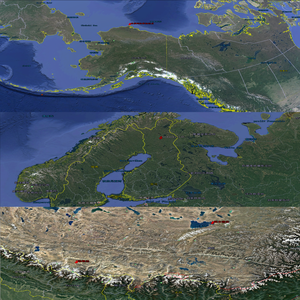
Solar radiation data were obtained using the internationally accepted solar radiation meter (LI200SZ, LI-COR, Inc., USA). The measured data are total solar radiation, including direct and diffuse solar radiation, with a wavelength range of 400-1100 nm. The units of the measurement results are W/㎡, and the typical error under natural lighting is ±3% (within an incident angle of 60°). Data from different locations in the three poles (Everest Station and Namco Station on the Tibetan Plateau, Sodankylä Station in the Arctic, and Dome A Station in the Antarctic) are derived from site cooperation and website downloads. The temporal coverage of data from the Everest Station and Namco Station on the Tibetan Plateau is from 2009 to 2016, that from the Sodankylä Station in the Arctic is from 2001 to 2017, and that from the Dome A Station in the Antarctic is from 2005 to 2014.
2020-10-14 View Details
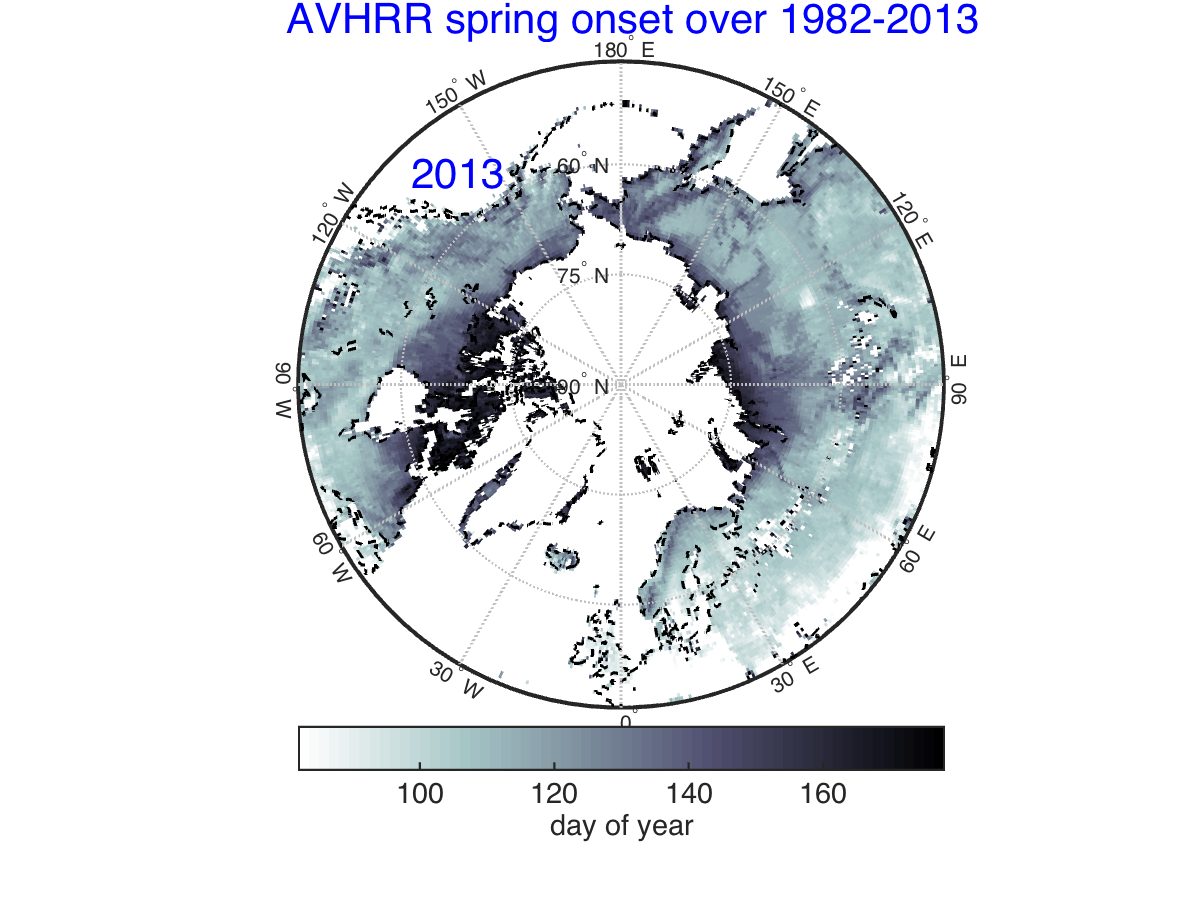
This dataset is based on the long sequence (1981-2013)normalized difference vegetation index product(Version 3) of the latest NOAA Global Inventory Monitoring and Modeling System (GIMMS). First, the NDVI data products were re-sampled from the spatial resolution of 1/12 degree to 0.5 degree, then the time series of every year was smoothed by the double-logistic method, and the smoothed curvature was calculated. The maximum curvature of spring was selected as the returning green stage of the vegetation in Spring. This data can be used to analyze the temporal and spatial characteristics of the Holarctic vegetation phenology in Spring.
2020-09-30 View Details
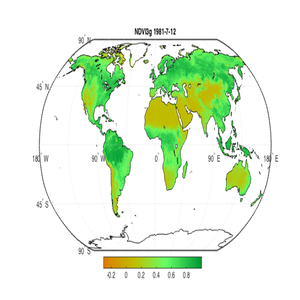
The NDVI data set is the latest release of the long sequence (1981-2015) normalized difference vegetation index product of NOAA Global Inventory Monitoring and Modeling System (GIMMS), version number 3g.v1. The temporal resolution of the product is twice a month, while the spatial resolution is 1/12 of a degree. The temporal coverage is from July 1981 to December 2015. This product is a shared data product and can be downloaded directly from ecocast.arc.nasa.gov. For details, please refer to https://nex.nasa.gov/nex/projects/1349/.
2020-09-30 View Details
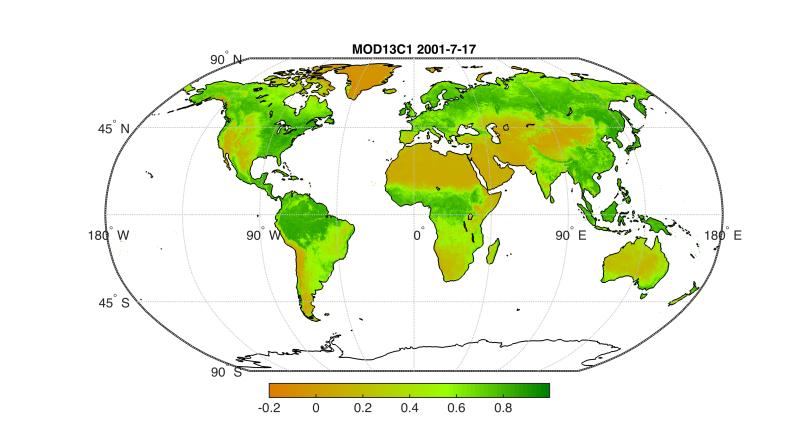
The NDVI data set is the sixth version of the MODIS Normalized Difference Vegetation Index product (2001-2016) jointly released by NASA EOSDIS LP DAAC and the US Geological Survey (USGS EROS). The product has a temporal resolution of 16 days and a spatial resolution of 0.05 degrees. This version is a Climate Modeling Grid (CMG) data product generated from the original NDVI product (MYD13A2) with a resolution of 1 kilometer. Please indicate the source of these data as follows in acknowledgments: The MOD13C NDVI product was retrieved online courtesy of the NASA EOSDIS Land Processes Distributed Active Archive Center (LP DAAC), USGS/Earth Resources Observation and Science (EROS) Center, Sioux Falls, South Dakota, The [PRODUCT] was (were) retrieved from the online [TOOL], courtesy of the NASA EOSDIS Land Processes Distributed Active Archive Center (LP DAAC), USGS/Earth Resources Observation and Science (EROS) Center, Sioux Falls, South Dakota.
2020-09-30 View Details
Contact Support
Links
National Tibetan Plateau Data CenterFollow Us

A Big Earth Data Platform for Three Poles © 2018-2020 No.05000491 | All Rights Reserved
|  No.11010502040845
Tech Support: westdc.cn