")
Global solar radiation and diffuse horizontal solar radiation at Dome C (Antarctica) are measured by radiation sensors (pyranometers CM22, Kipp & Zonen Inc., The Netherlands), and water vapor pressure (hPa) at the ground are obtained from the IPEV/PNRA Project “Routine Meteorological Observation at Station Concordia”, http://www.climantartide.it. This dataset includes hourly solar radiation and its absorbing and scattering losses caused by the absorbing and scattering atmospheric substances (MJ m-2, 200-3600 nm), and the albedos at the top of the atmosphere and the surface. The above solar radiations are calculated by using an empirical model of global solar radiation (Bai, J.; Zong, X.; Lanconelli, C.; Lupi, A.; Driemel, A.; Vitale, V.; Li, K.; Song, T. 2022. Long-Term Variations of Global Solar Radiation and Its Potential Effects at Dome C (Antarctica). Int. J. Environ. Res. Public Health, 19, 3084. https://doi.org/10.3390/ijerph19053084). The observed global solar radiation and meteorological parameters are available at https://doi.org/10.1594/PANGAEA.935421. The data set can be used to study solar radiation and its attenuation at Dome C, Antarctica.
BAI Jianhui
")
Global solar radiation at Qomolangma station (The Tibetan Plateau) is measured by radiation sensor (pyranometers CM22, Kipp & Zonen Inc., The Netherlands), and water vapor pressure (hPa) at the ground is measured by HMP45C-GM (Vaisala Inc., Vantaa, Finland). This dataset includes hourly solar radiation and its absorbing and scattering losses caused by the absorbing and scattering atmospheric substances (MJ m-2, 200-3600 nm), and the albedos at the top of the atmosphere and the surface. The above solar radiations are calculated by using an empirical model of global solar radiation (Bai, J.; Zong, X.; Ma, Y.; Wang, B.; Zhao, C.; Yang, Y.; Guang, J.; Cong, Z.; Li, K.; Song, T. 2022. Long-Term Variations in Global Solar Radiation and Its Interaction with Atmospheric Substances at Qomolangma. Int. J. Environ. Res. Public Health, 19, 8906. https://doi.org/10.3390/ijerph19158906). The observed global solar radiation and meteorological variables are available at https://data.tpdc.ac.cn/zh-hans/data/b9ab35b2-81fb-4330-925f-4d9860ac47c3/. The data set can be used to study solar radiation and its attenuation at Qomolangma region.
BAI Jianhui
")
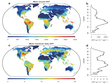
A global continental blended high-resolution planetary boundary layer height (PBLH) dataset is generated with machine learning algorithms, covering a time period from 2017 to 2021 with a 3-hour and 0.25º resolution in space and time. The radiosonde dataset contains around 180 million profiles over 370 stations across the world. The machine learning model was established by taking the parameters derived from ERA5 reanalysis and GLDAS as input while PBLH determined from radiosonde measurements was used as the learning target. Once a start-of-the-art model has been eventually trained, the model was then used to predict PBLHs at other grids across the globe with parameters acuqired or derived from ERA5 and GLDAS, including PBLH, lower tropospheric stability, near-surface wind speed and standard deviation of orography extracted from ERA5 reanalysis, sensible heat flux, latent heat flux, transpiration, evapotranspiration, downward long wave radiation, downward short wave radiation, total precipitation rate and near-surface pressure from GLDAS. Overall, this harmonized high-resolution PBLH dataset is outstanding in terms of both spatiotemporal coverage and good accuracy, as compared to the PBLHs retrieved from radiosonde.
GUO Jianping , ZHANG Jian , SHAO Jia
)")
This data set contains the high-resolution tropospheric nitrogen dioxide vertical column concentration pomino v2.0.1 data in East Asia from 2004 to 2020, which provides an important data basis for studying the spatial distribution characteristics and temporal variation trend of tropospheric nitrogen dioxide in China. Based on the tropospheric nitrogen dioxide slant column concentration provided by KNMI, the pomino tropospheric nitrogen dioxide vertical column concentration is calculated through the tropospheric AMF retrieval algorithm developed by ourselves. The comparison with the ground-based observation data shows that the tropospheric nitrogen dioxide column concentration of pomino can better capture the day-to-day variation trend, and has better correlation with the ground-based observation data. At present, the data has been used for scientific research by many universities and scientific research institutions at home and abroad. In the future, the data set will provide more comprehensive data support for scientific research projects on the Qinghai Tibet Plateau.
LIN Jintai
")
This data set contains the high-resolution tropospheric nitrogen dioxide vertical column concentration pomino v2.1 data in East Asia from 2012 to 2020. It is a new version of the data after bug fix of v2.0.1, which provides an important data basis for studying the spatial distribution characteristics and temporal change trend of tropospheric nitrogen dioxide in China. Based on the tropospheric nitrogen dioxide slant column concentration provided by KNMI, the pomino tropospheric nitrogen dioxide vertical column concentration is calculated through the tropospheric AMF retrieval algorithm developed by ourselves. The comparison with the ground-based observation data shows that the tropospheric nitrogen dioxide column concentration of pomino can better capture the day-to-day variation trend, and has better correlation with the ground-based observation data. At present, the data has been used for scientific research by many universities and scientific research institutions at home and abroad. In the future, the data set will provide more comprehensive data support for scientific research projects on the Qinghai Tibet Plateau.
LIN Jintai

This dataset contains the monthly/yearly surface shortwave band albedo, fraction of absorbed photosynthetically active radiation (fPAR), leaf area index (LAI), vegetation continuous fields (tree cover and non-tree vegetation cover, VCF), land surface temperature (LST), net radiation (RN), evapotranspiration (ET), aboveground autotrophic respiration (RA-ag), belowground autotrophic respiration (RA-bg), gross primary production (GPP) and net primary production (NPP) in China from 2001 to 2018. The spatial resolution are 0.1 degree. Moreover, the dataset also includes these 11 ecosystem variables under climate-driven scenario (i.e., under no human disturbance). So, it can show the relative influences of climate change and human activities on land ecosystem in China during the 21st century.
CHEN Yongzhe, FENG Xiaoming, TIAN Hanqin, WU Xutong, GAO Zhen, FENG Yu, PIAO Shilong, LV Nan, PAN Naiqing, FU Bojie
")
Kilometer-level spatially complete (seamless) land surface temperature products have a wide range of applications needs in climate change and other fields. Satellite retrieved LST has high reliability. Integrating the LST retrieved from thermal infrared and microwave remote sensing observation is an effective way to obtain the SLT with certain accuracy and spatial integrity. Based on this guiding ideology, the author developed a framework for retrieving 1km and seamless LST over China landmass, and generated the LST data set accordingly (2002-2020) Firstly, a look-up table based empirical retrieval algorithm is developed for retrieving microwave LST from AMSR-E/AMSR2 observations. Then, AMSR-E/AMSR2 LST is downscaled by using geographic weighted regression to obtain 1km LST. Finally, the multi-scale Kalman filter is used to fuse AMSR-E/AMSR2 LST and MODIS LST to generate a 1km seamless LST data set. The ground valuation results show that the root mean square error (RMSE) of the 1km seamless LST is about 3K. In addition, the spatial distribution of the 1km seamless LST is consistent with MODIS LST and CLDAS LST.
CHENG Jie, DONG Shengyue, SHI Jiancheng
")
Land surface temperature (LST) is a key parameter in the study of surface energy balance. It is widely used in the fields of meteorology, climate, hydrology, agriculture and ecology. As an important means to obtain global and regional scale LST information, satellite (thermal infrared) remote sensing is vulnerable to the influence of cloud cover and other atmospheric conditions, resulting in temporal and spatial discontinuity of LST remote sensing products, which greatly limits the application of LST remote sensing products in related research fields. The preparation of this data set is based on the empirical orthogonal function interpolation method, using Terra / Aqua MODIS surface temperature products to reconstruct the lst under ideal clear sky conditions, and then using the cumulative distribution function matching method to fuse era5 land reanalysis data to obtain the lst under all-weather conditions. This method makes full use of the spatio-temporal information of the original MODIS remote sensing products and the cloud impact information in the reanalysis data, alleviates the impact of cloud cover on LST estimation, and finally reconstructs the high-quality global 0.05 ° spatio-temporal continuous ideal clear sky and all-weather LST data set. This data set not only realizes the seamless coverage of space-time, but also has good verification accuracy. The reconstructed ideal clear sky LST data in the experimental areas of 17 land cover types in the world, the average correlation coefficient (R) is 0.971, the bias (bias) is -0.001 K to 0.049 K, and the root mean square error (RMSE) is 1.436 K to 2.688 K. The verification results of the reconstructed all-weather LST data and the measured data of ground stations: the average R is 0.895, the bias is 0.025 K to 2.599 K, and the RMSE is 4.503 K to 7.299 K. The time resolution of this data set is 4 times a day, the spatial resolution is 0.05 °, the time span is 2002-2020, and the spatial range covers the world.
ZHAO Tianjie, YU Pei
")
Surface solar irradiance (SSI) is one of the products of FY-4A L2 quantitative inversion. It covers a full disk without projection, with a spatial resolution of 4km and a temporal resolution of 15min (there are 40 observation times in the whole day since 20180921, except for the observation of each hour, there is one observation every 3hr before and after the hour), and the spectral range is 0.2µ m~5.0 µ m. The output elements of the product include total irradiance, direct irradiance on horizontal plane and scattered irradiance, the effective measurement ranges between 0-1500 w / m2. The qualitative improvement of FY-4A SSI products in coverage, spatial resolution, time continuity, output elements and other aspects makes it possible to further carry out its fine application in solar energy, agriculture, ecology, transportation and other professional meteorological services. The current research results show that the overall correlation of FY-4A SSI product in China is more than 0.75 compared with ground-based observation, which can be used for solar energy resource assessment in China.
SHEN Yanbo, HU Yueming, HU Xiuqing
")
Land surface temperature (LST) is one of the important parameters of the interface between the earth's surface and atmosphere. It is not only the direct reflection of the interaction between the surface and the atmosphere, but also has a complex feedback effect on the earth atmosphere process. Therefore, land surface temperature is not only a sensitive indicator of climate change and an important prerequisite for mastering the law of climate change, but also a direct input parameter of many models, which has been widely used in many fields, such as meteorology, climate, environmental ecology, hydrology and so on. With the deepening and refinement of Geosciences and related fields, there is an urgent need for all weather LST based on satellite remote sensing. The generation principle of this dataset is a satellite thermal infrared remote sensing reanalysis data integration method based on a new land surface temperature time decomposition model. The main input data of the method are Aqua MODIS LST products and GLDAS data, and the auxiliary data include vegetation index and surface albedo provided by satellite remote sensing. The method makes full use of the high-frequency and low-frequency components of land surface temperature and the spatial correlation of land surface temperature provided by satellite thermal infrared remote sensing and reanalysis data, and finally reconstructs a high-quality all-weather land surface temperature data set. The evaluation results show that this data set has good image quality and accuracy, which is not only seamless in space, but also highly consistent with the amplitude and spatial distribution of 1 km daily Aqua MODIS LST products widely used in current academic circles. When MODIS LST is used as reference, the mean deviation (MBE) of the data set is 0.08k to 0.16k, and the standard deviation of deviation (STD) is 1.12k to 1.46k. Compared with the daily 1km AATSR LST product released by ESA, the MBE and STD of the product are -0.21k to 0.25k and 1.27k to 1.36k during the day and night. Based on the measured data of 15 stations in Heihe River Basin, Northeast China, North China and South China, the test results show that the MBE is -0.06k to -1.17k, and the RMSE is 1.52k to 3.71k, and there is no significant difference between clear sky and non clear sky. The time resolution of this data set is twice a day, the spatial resolution is 1km, and the time span is from 2000 to 2021; The spatial scope includes the main areas of China's land (including Hong Kong, Macao and Taiwan, excluding the islands in the South China Sea) and the surrounding areas (72 ° E-135 ° E,19 ° N-55 ° N)。 This dataset is abbreviated as trims LST (thermal and reality integrating modem resolution spatial sealing LST) for users to use. It should be noted that the spatial subset of trims LST, trims lst-tp (1 km daily land surface temperature data set in Western China, trims lst-tp; 2000-2021) V2) has also been released in the national Qinghai Tibet Plateau scientific data center to reduce the workload of data download and processing for relevant users.
ZHOU Ji, ZHANG Xiaodong, TANG Wenbin, DING Lirong, MA Jin , ZHANG Xu
")
Data content: surface temperature data of the Aral Sea basin from 2015 to 2018. Data sources and processing methods: the first band of mod11a2 product was extracted from the NASA medium resolution imaging spectrometer as the surface temperature data, multiplied by the scale factor of 0.02. Data quality: the spatial resolution is 1000m × 1000m, the temporal resolution is 8 days, and the value of each pixel is the average value of land surface temperature in 8 days. Data application results: under the background of climate change, it can be used to analyze the correlation between meteorological elements and vegetation characteristics, and can also be combined with other meteorological data to analyze the regional distribution of a certain vegetation type.
LIU Tie
")
The global monthly all-sky land surface temperature (2000-2020) is produced by the method from Chen et al. 2017 JHM.
CHEN Xuelong, BOB Su, MA Yaoming
 surface solar radiation dataset with by merging sunshine hours over China China (1983-2017)")
This data set is a national high-resolution solar radiation data set covering 34 years (1983.7-2017.6), with a resolution of 10 km. The data unit is W / m2. The data set is developed by merging the global high-resolution (3 hours, 10 km) surface solar radiation data set (1983-2017) with isccp-hxg cloud products as the main input, with ground based sunshine duration derived surface solar raidation data from 2261 meteorological stations in China by using the geographic weighted regression method. The validation results show that this dataset can provide more accurate simulation of long-term variability of surface solar radiation than that of gewex-srb, cmsaf-clara-a2 and the isccp-hxg based surface solar radiation product. This data can provide favorable data support for the application and research of long-term change of hydrology in land surface process simulation.
FENG Fei, WANG Kaicun
")
Land surface temperature (LST) is a key variable for high temperature and drought monitoring and climate and ecological environment research. Due to the sparse distribution of ground observation stations, thermal infrared remote sensing technology has become an important means of quickly obtaining ground temperature over large areas. However, there are many missing and low-quality values in satellite-based LST data because clouds cover more than 60% of the global surface every day. This article presents a unique LST dataset with a monthly temporal resolution for China from 2003 to 2017 that makes full use of the advantages of MODIS data and meteorological station data to overcome the defects of cloud influence via a reconstruction model. We specifically describe the reconstruction model, which uses a combination of MODIS daily data, monthly data and meteorological station data to reconstruct the LST in areas with cloud coverage and for grid cells with elevated LST error, and the data performance is then further improved by establishing a regression analysis model. The validation indicates that the new LST dataset is highly consistent with in situ observations. For the six natural subregions with different climatic conditions in China, verification using ground observation data shows that the root mean square error (RMSE) ranges from 1.24 to 1.58 K, the mean absolute error (MAE) varies from 1.23 to 1.37 K and the Pearson coefficient (R2) ranges from 0.93 to 0.99. The new dataset adequately captures the spatiotemporal variations in LST at annual, seasonal and monthly scales. From 2003 to 2017, the overall annual mean LST in China showed a weak increase. Moreover, the positive trend was remarkably unevenly distributed across China. The most significant warming occurred in the central and western areas of the Inner Mongolia Plateau in the Northwest Region, and the average annual temperature change is greater than 0.1K (R>0:71, P<0:05), and a strong negative trend was observed in some parts of the Northeast Region and South China Region. Seasonally, there was significant warming in western China in winter, which was most pronounced in December. The reconstructed dataset exhibits significant improvements and can be used for the spatiotemporal evaluation of LST in high-temperature and drought-monitoring studies. More detail please refer to Zhao et al (2020). doi.org/10.5281/zenodo.3528024
MAO Kebiao
The Land Surface Temperature in China dataset contains land surface temperature data for China (about 9.6 million square kilometers of land) during the period of 2003-2017, in Celsius, in monthly temporal and 5600 m spatial resolution. It is produced by combing MODIS daily data(MOD11C1 and MYD11C1), monthly data(MOD11C3 and MYD11C3) and meteorological station data to reconstruct real LST under cloud coverage in monthly LST images, and then a regression analysis model is constructed to further improve accuracy in six natural subregions with different climatic conditions.
MAO Kebiao
")
Vulnerability assessment dataset of hectometre level for 34 key nodes assessment the flood risk of key nodes in the Belt and Road under the extreme precipitation events, in order to provide basis for decision-making for the local government department, at the same time before flood disaster early warning, which may take the disaster prevention and mitigation measures for the precious time, reduce people's lives and property damage brought by the flood. Based on the data of GDP, population, land ues, road density and river density in the Belt and Road, this dataset combined with the methods of spatial analysis of ArcGIS, assigning different weights to each indicator and building assessment 34 key nodes under the condition of extreme precipitation in flood vulnerability level, which was divided into 5 levels by using natural break point method, representing no vulnerability, low vulnerability, middle vulnerability, high vulnerability, extreme high vulnerability, respectively.
GE Yong, LI Qiangzi, LI Yi
")
The pan third pole historical extreme precipitation data set includes 2000-2018 extreme precipitation identification data. One belt, one road, was used to assess the rainfall in the important area along the GPM IMERG Final Run (GPM) daily rainfall. The extreme precipitation threshold of 34 important nodes was evaluated by percentile method. The daily precipitation period was identified by the calculated threshold, and the surface inundation area was produced on the basis of extreme precipitation. The data range mainly includes 34 key nodes of Pan third pole (Vientiane, Alexandria, Yangon, Calcutta, Warsaw, Karachi, yekajerinburg, Chittagong, Djibouti, etc.) The data set can provide the basis for local government decision-making, so as to correctly identify extreme precipitation and reduce the loss of life and property caused by extreme precipitation.
HE Yufeng
")
Land surface temperature is a critical parameter in land surface energy balance. This dataset provides the monthly land surface temperature of UAV remote sensing for typical ground stations in the middle reaches of Heihe River basin from July to September in 2019. The land surface temperature retrieval algorithm is an improved single-channel algorithm, which was applied to the land surface brightness temperature data obtained by the UAV thermal infrared remote sensing sensor, and finally the land surface temperature data with a spatial resolution of 0.4m was obtained.
ZHOU Ji, LIU Shaomin, WANG Ziwei

Vulnerability refers to a property of the system that is susceptible to changes in structure and function due to the system's sensitivity to internal and external disturbances and its lack of ability to respond, that is, the ability of the region to cope with disasters to reduce losses when heat waves occur. This dataset is based on the pan-third pole regional road network data, GDP data, medical facility spatial distribution data, vegetation coverage data, and water distribution data as basic data,and takes 2015 as the base year. The Euclidean Metric calculation method is adopted to determine the spatial distribution of road networks, water and medical facilities in the area. The distance from roads, water bodies, medical facilities, GDP, and vegetation coverage are used as evaluation indicators. The equal-weight overlapping addition is used to evaluate the vulnerability of heat waves at each node. In order to eliminate the impact of unit differences, the data of each index layer is normalized before the evaluation.Finally, the vulnerability level of each node is divided by the natural Jenks method.
GE Yong, YANG Fei, LIU Qingsheng
Contact Support
Links
National Tibetan Plateau Data CenterFollow Us

A Big Earth Data Platform for Three Poles © 2018-2020 No.05000491 | All Rights Reserved
|  No.11010502040845
Tech Support: westdc.cn